Dashboard System
To visualize and analyze data collected from sensors on my DI-FARM device, I built a dashboard using Next.js for the frontend and Node.js for the backend. This setup helped me track livestock health and movement in real-time.
Frontend – Built with Next.js
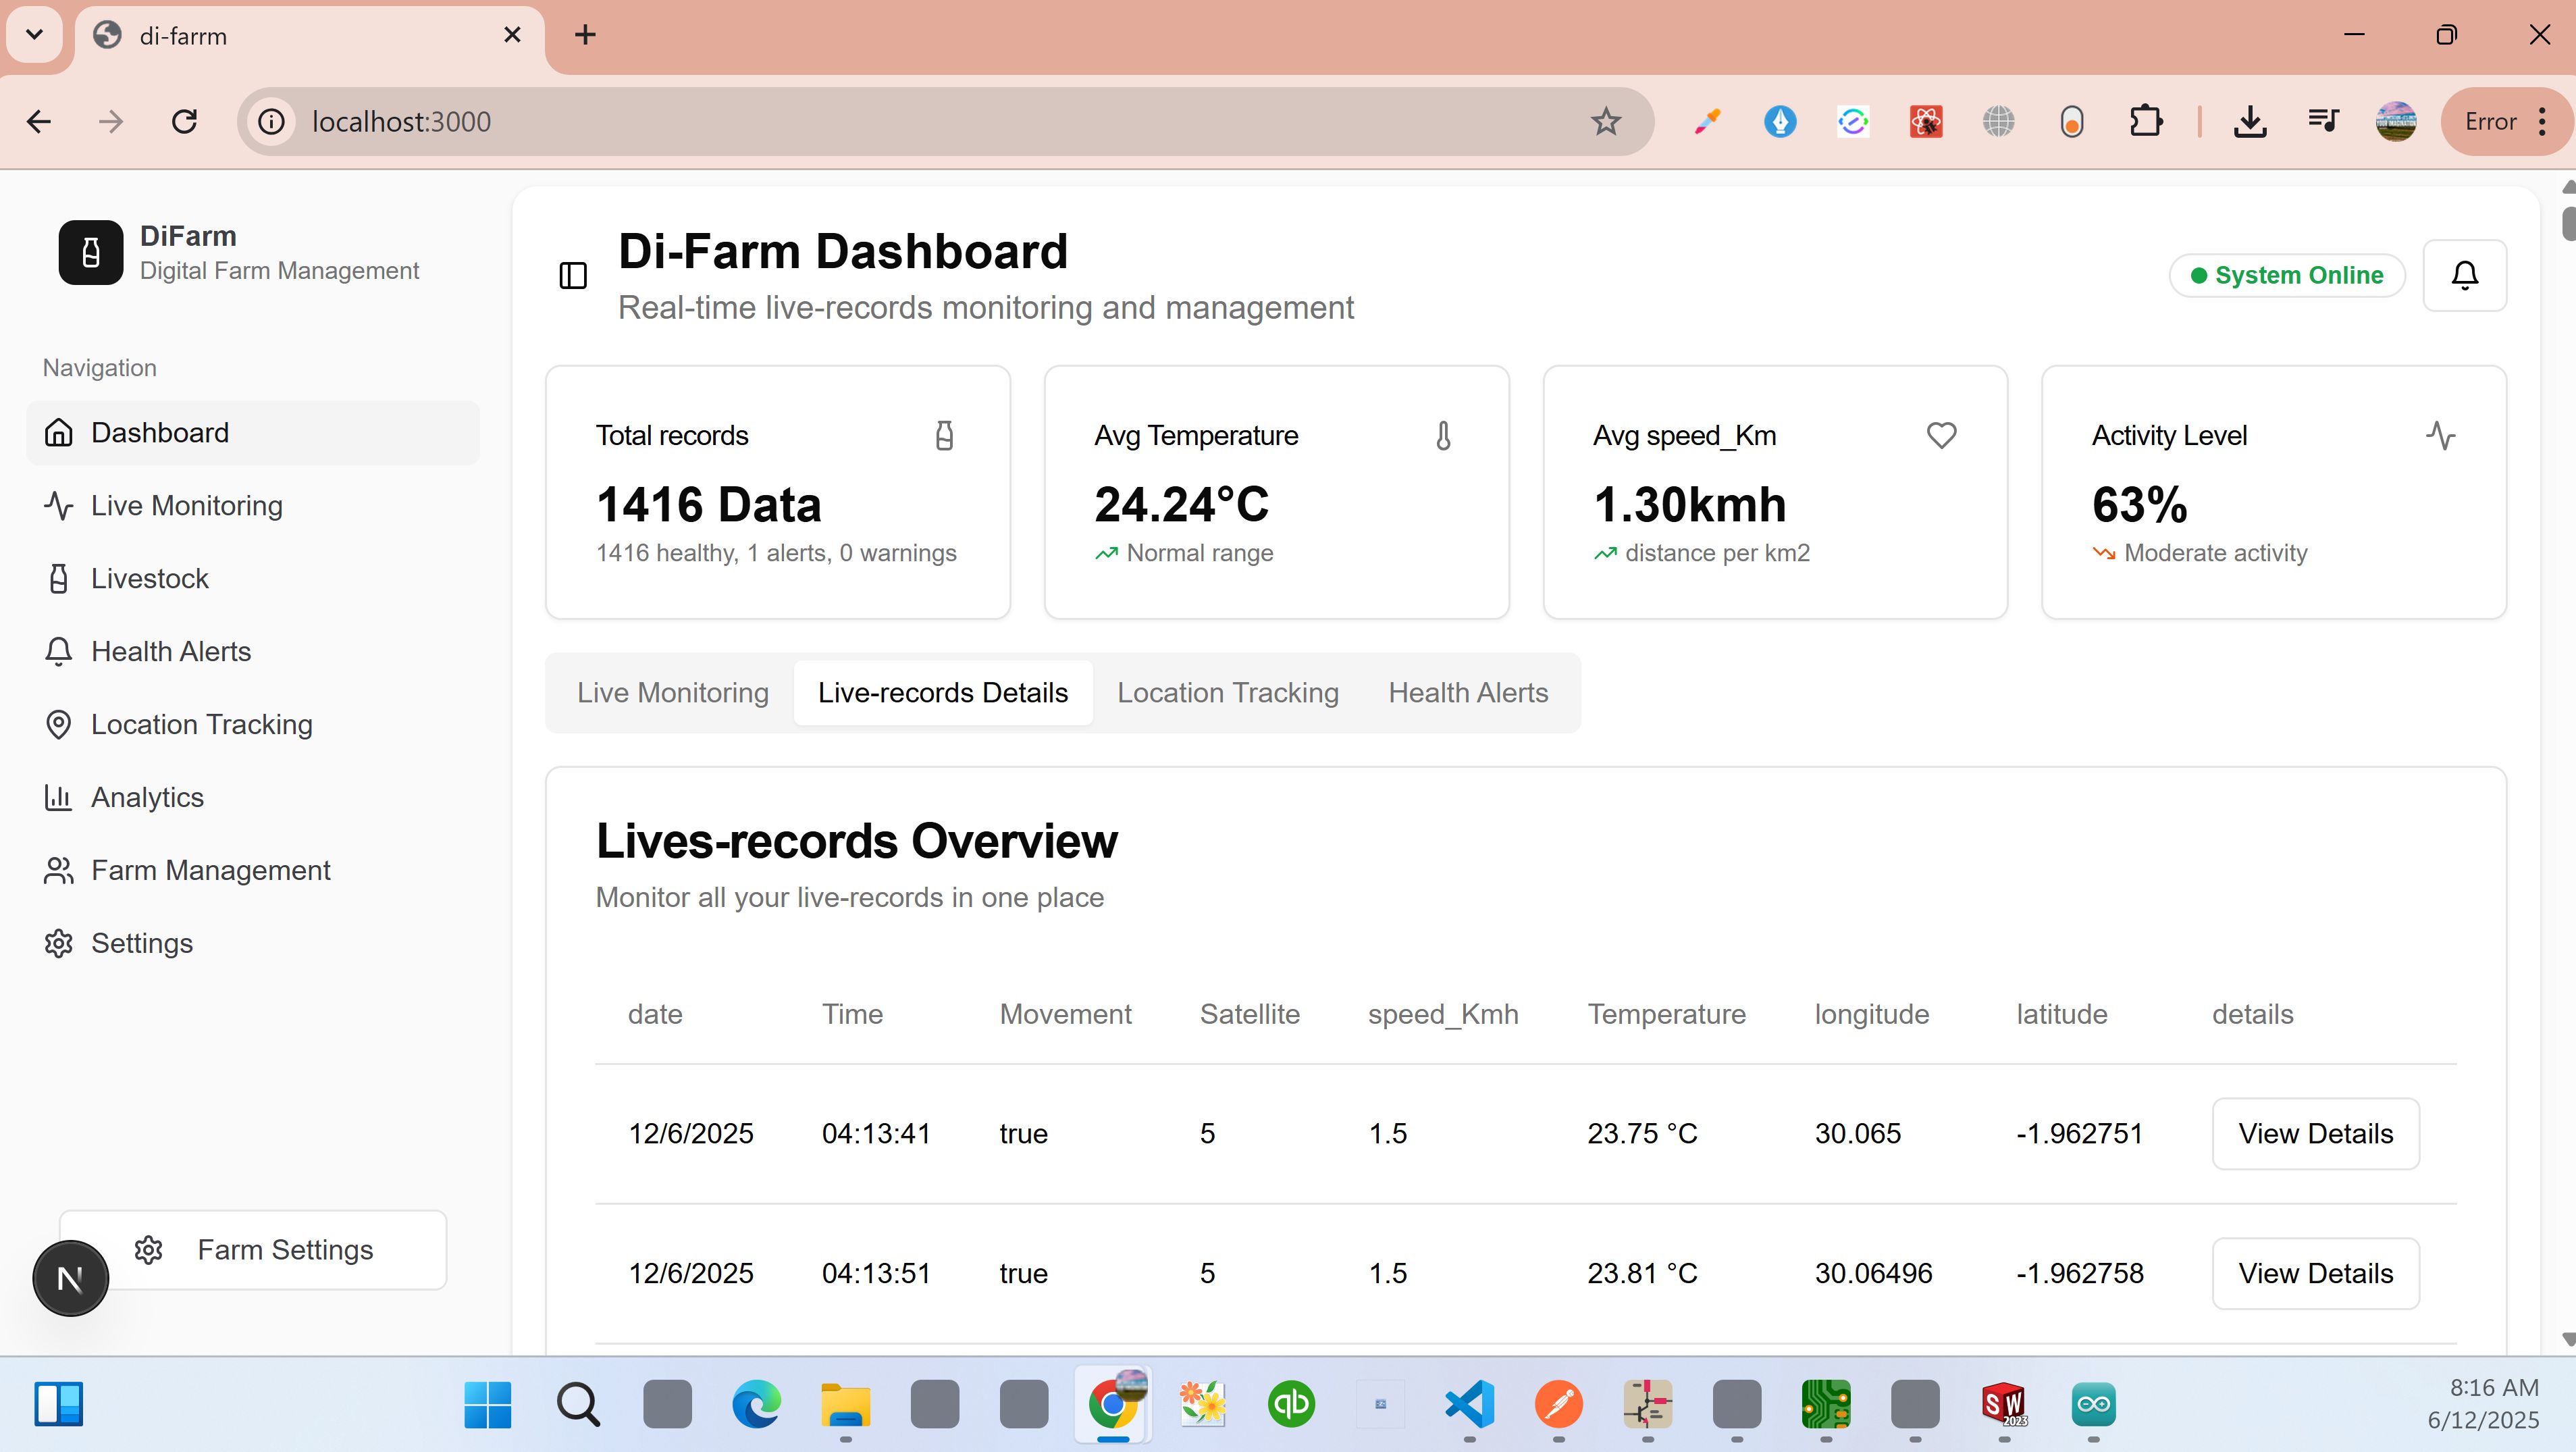
I used Next.js to build dynamic, real-time charts and tables. The dashboard fetches data from the backend using APIs and displays temperature, movement status, GPS coordinates, and timestamps.
Main features of my dashboard:
- Line chart for temperature trends
- Table of GPS logs
- Average records within a given period of time
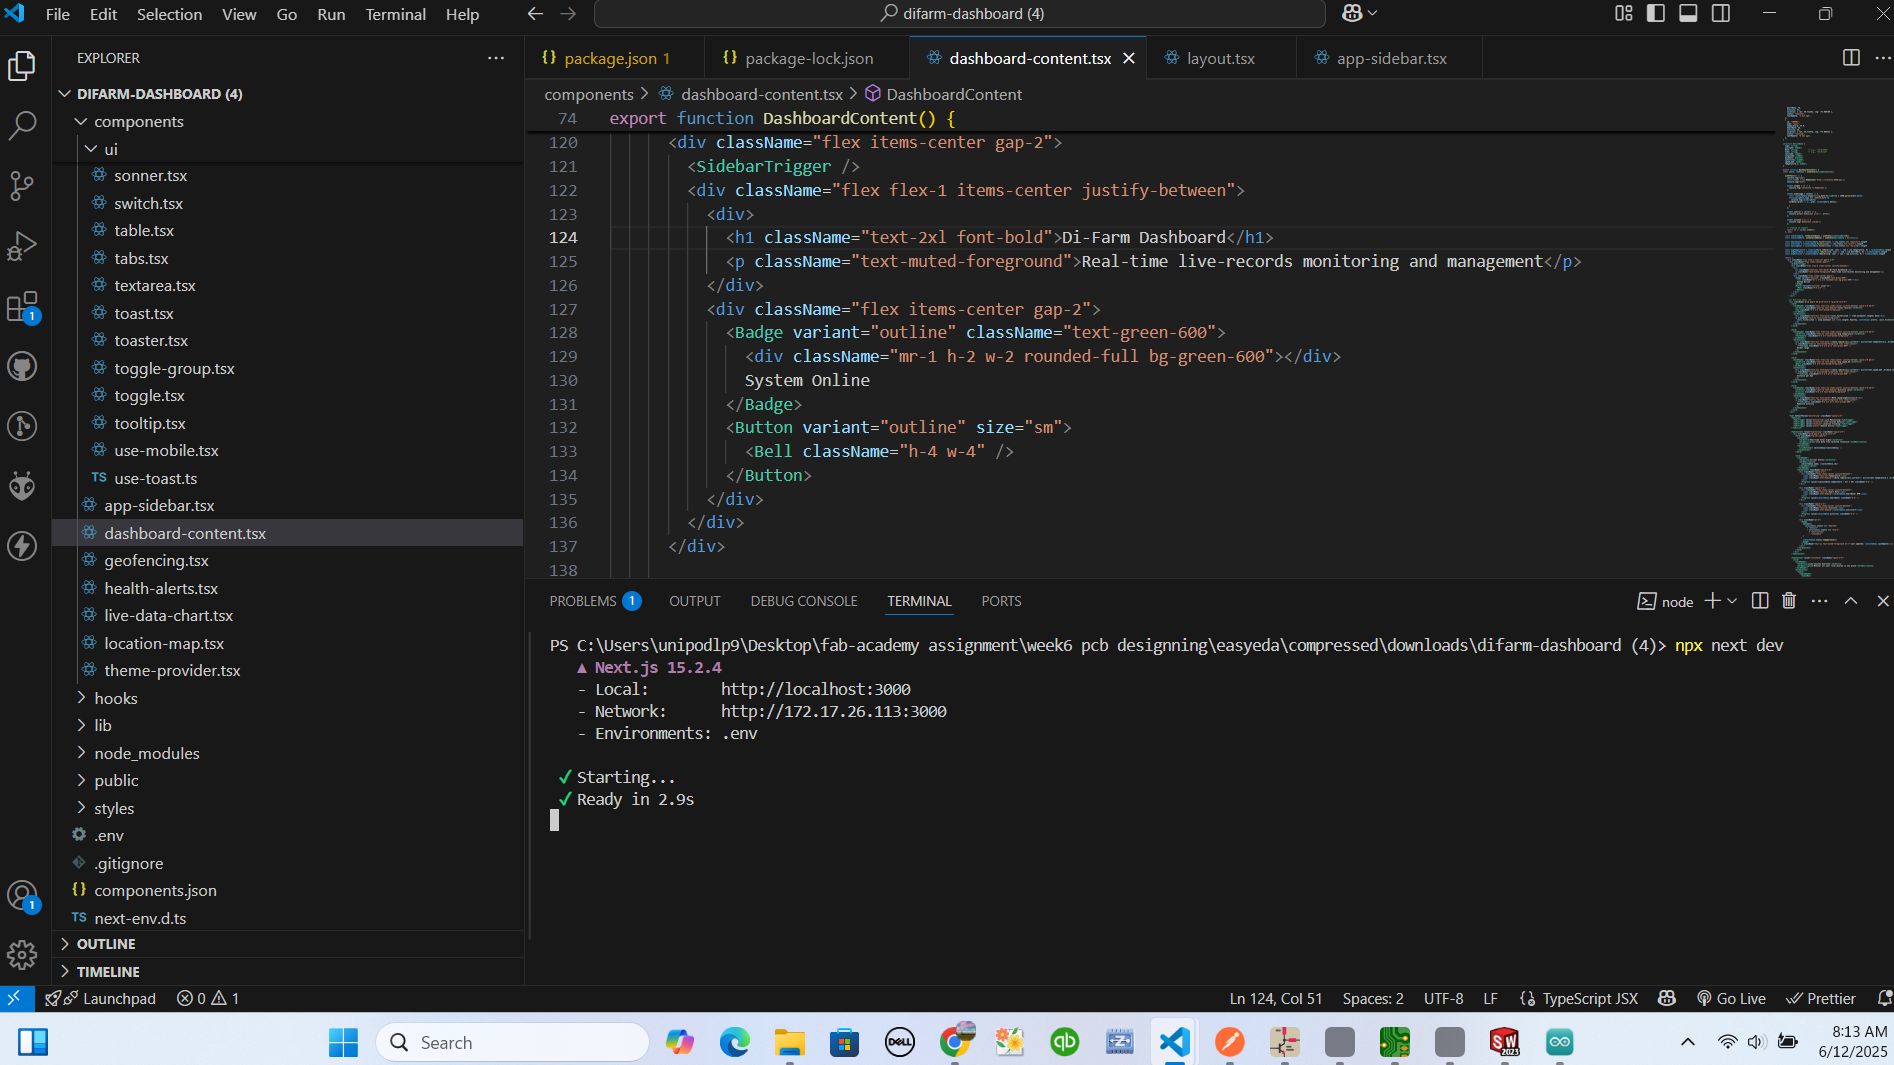
Below is a screenshot of the frontend source code:
Backend – Powered by Node.js
I created a Node.js backend with Express to receive data from the ESP32 C3 microcontroller. This backend stores incoming data from microcontroller using APIs via network and serves it to the frontend through API endpoints.
What my backend does:
- Receives POST requests from the ESP32
- Parses JSON payloads and stores them in memory or a database
- Serves GET requests to the dashboard
Here’s a photo of the backend code file:
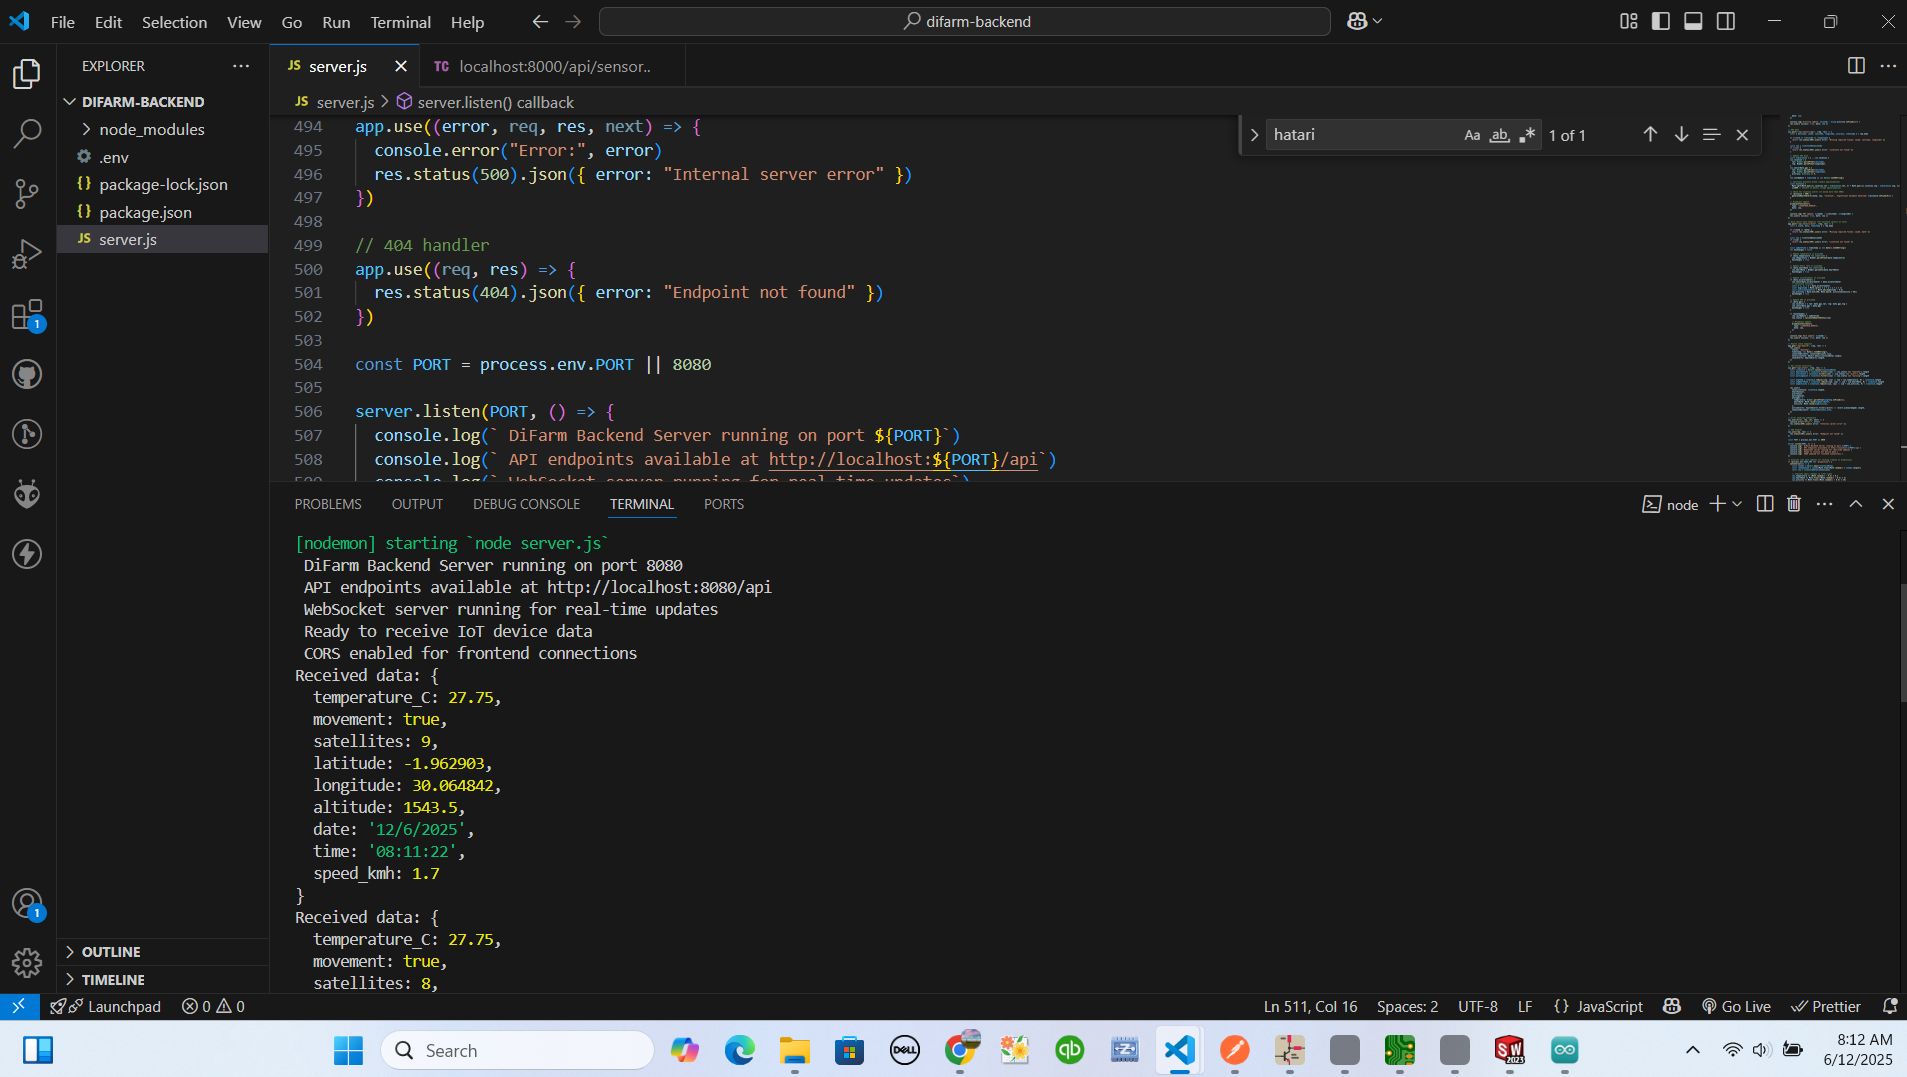
API Payload Structure
Each device sends data like this:
{
  "temperature_C": 38.2,
  "movement": true,
  "satellites": 8,
  "latitude": -1.962679,
  "longitude": 30.064,
  "altitude": 1540.5,
  "date": "18/6/2025",
  "time": "16:30:12",
  "speed_kmh": 1.2
}
Visualization Results
I will add here some screenshots and graphs showing how data is presented on the dashboard after live collection.