Week 15: Interface & Application Programming
Objectives of the week
The objective of this assignment is to explore and compare different interface and application programming tools: Node-RED, Python Tkinter, and Processing. The focus is on:
- Understanding the interface and visualization capabilities of each tool
- Observing how input and output can be represented
- Comparing ease of use, flexibility, and learning curve
- Documenting observations for future hardware or software integration
Tools Overview
| Tool | Type | Platform | Key Features |
|---|---|---|---|
| Node-RED | Flow-based | Web Browser | Drag-and-drop flow programming, visual dashboards, easy integration with IoT APIs |
| Python Tkinter | Code-based GUI | Desktop (Python) | Customizable desktop GUI, live updates, buttons, sliders, labels, progress bars |
| Processing | Code-based GUI | Desktop/IDE | Visual programming focused on graphics, interactive sketches, and animation, suitable for real-time visualizations |
Node-RED
Node-RED allows us to create IoT applications without writing code from scratch, create interactive visualizations of our projects, and use it for learnings, tutorials, and simulations.
i. Installation
- Install Node.js (v22+)
- Install Node-RED globally:
npm install -g --unsafe-perm node-red - Install the Dashboard nodes:
cd %HOMEPATH%\.node-red npm install node-red-dashboard - Start Node-RED:
node-red - Open the Node-RED editor in your browser:
http://127.0.0.1:1880
ii. Flow Design Example
Goal: Simulate a sensor value and display it on a dashboard gauge.
Flow Structure:
[Inject] → [Function] → [Gauge]
- Inject Node: Generates a timestamp when clicked to simulate an input event
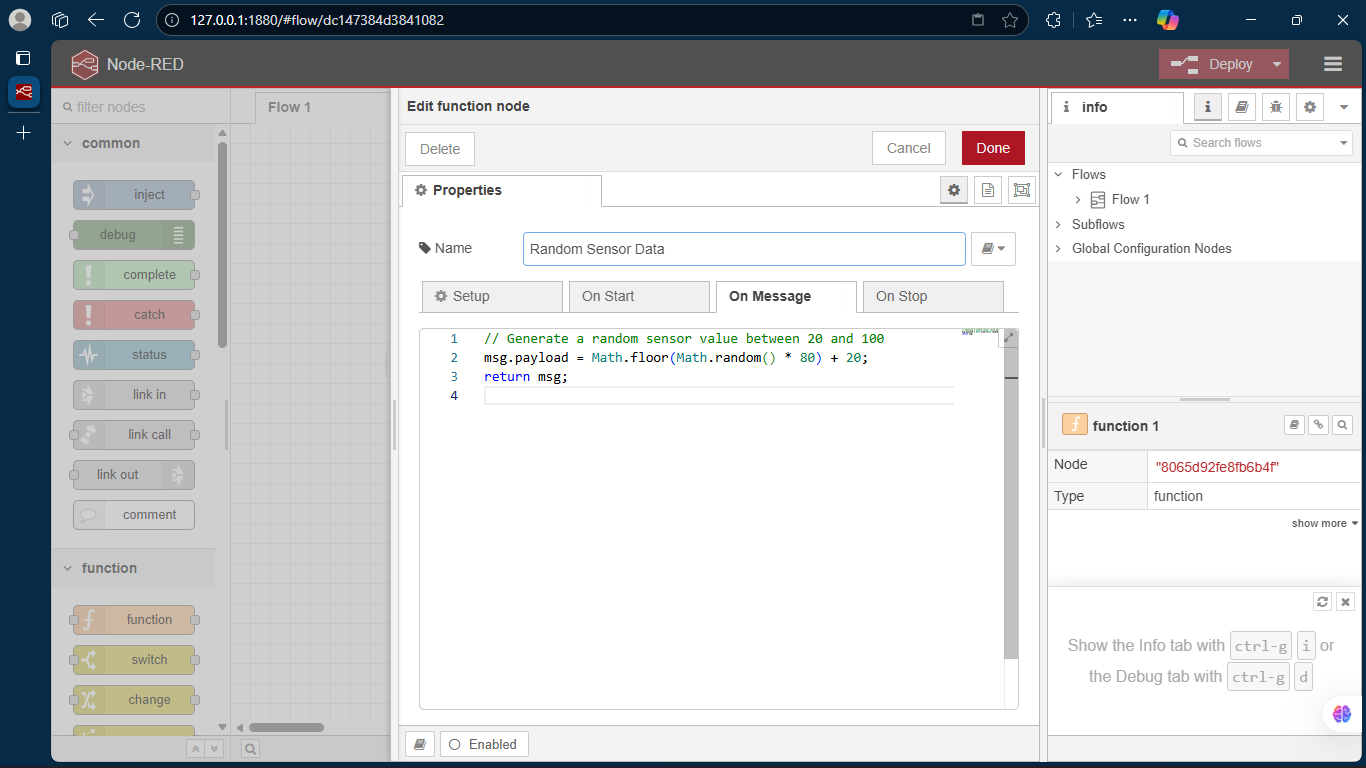
- Function Node: Generates a random value to simulate sensor data:
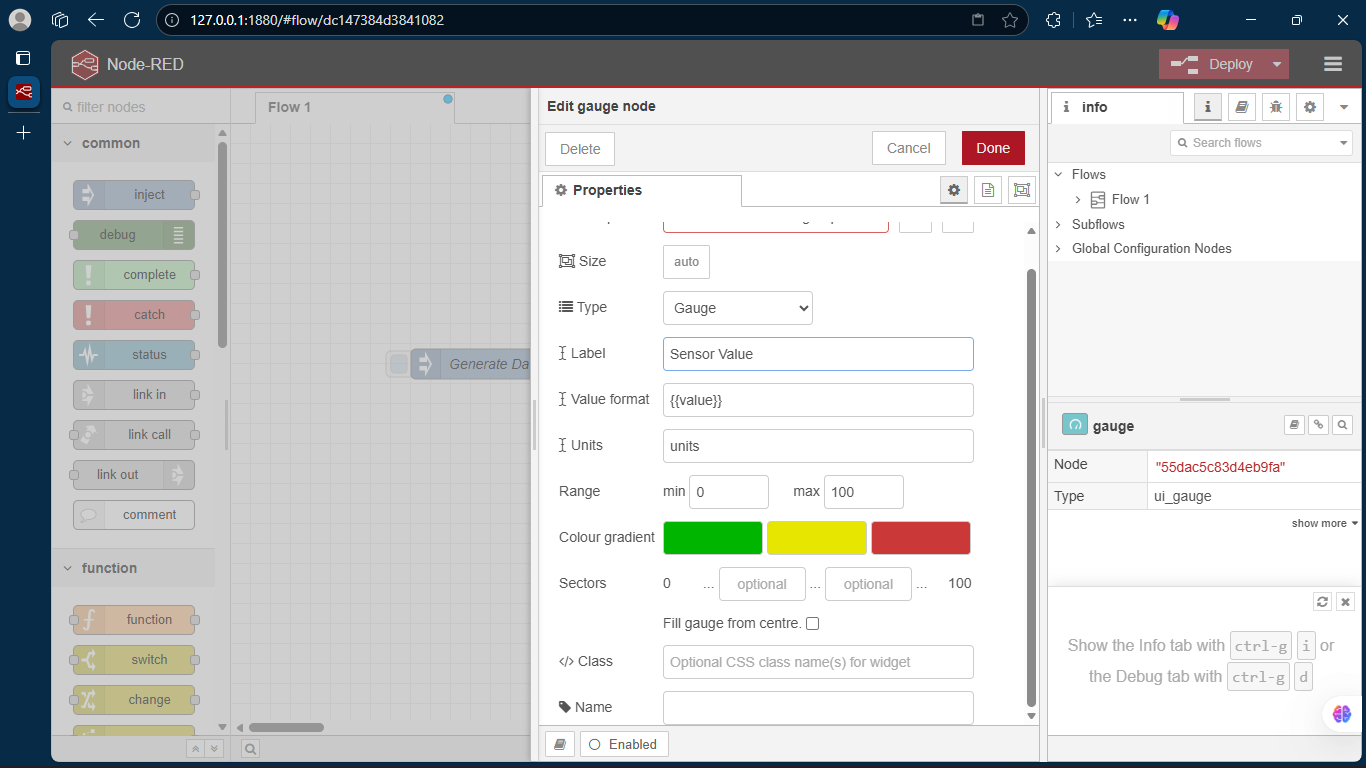
msg.payload = Math.floor(Math.random() * 100); return msg; - Gauge Node: Displays the value on a visual dashboard
Steps:
- Drag Inject, Function, and Gauge nodes to the workspace
- Configure each node (payload type, function code, dashboard group/tab)
- Connect nodes: Inject → Function → Gauge
- Click Deploy and test by clicking the inject button
- Open the dashboard:
http://127.0.0.1:1880/ui
Observation:
- Node-RED allows creating visual interfaces without writing code.
- Drag-and-drop interface is intuitive for beginners.
- External nodes like Firebase may require proper configuration; incorrect setup leads to runtime errors.
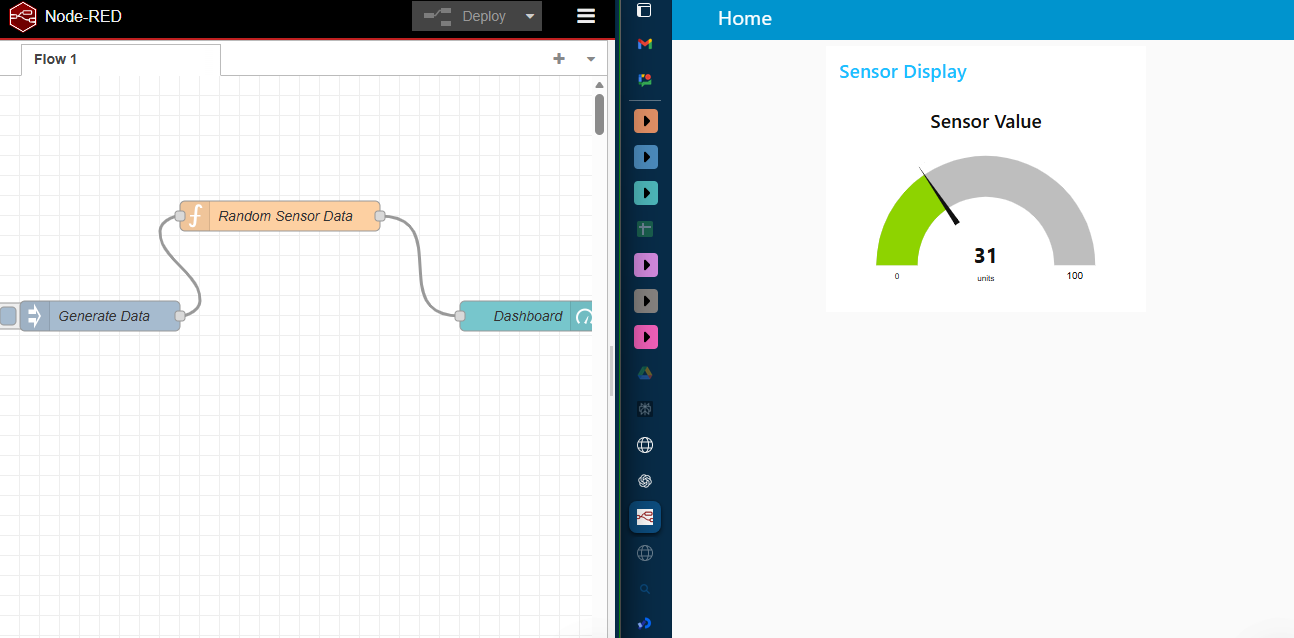
iii. View of the Node-Red
Node-RED Flow Screenshot:
Node-RED Dashboard Screenshot:
Python Tkinter
i. Overview
Tkinter is the built-in Python library for GUI development. It provides:
- Buttons, labels, sliders, progress bars, text fields
- Live updating interfaces using the after() function
- Fully programmable control over layout and behavior
Tkinter runs on desktop environments and does not require a browser.
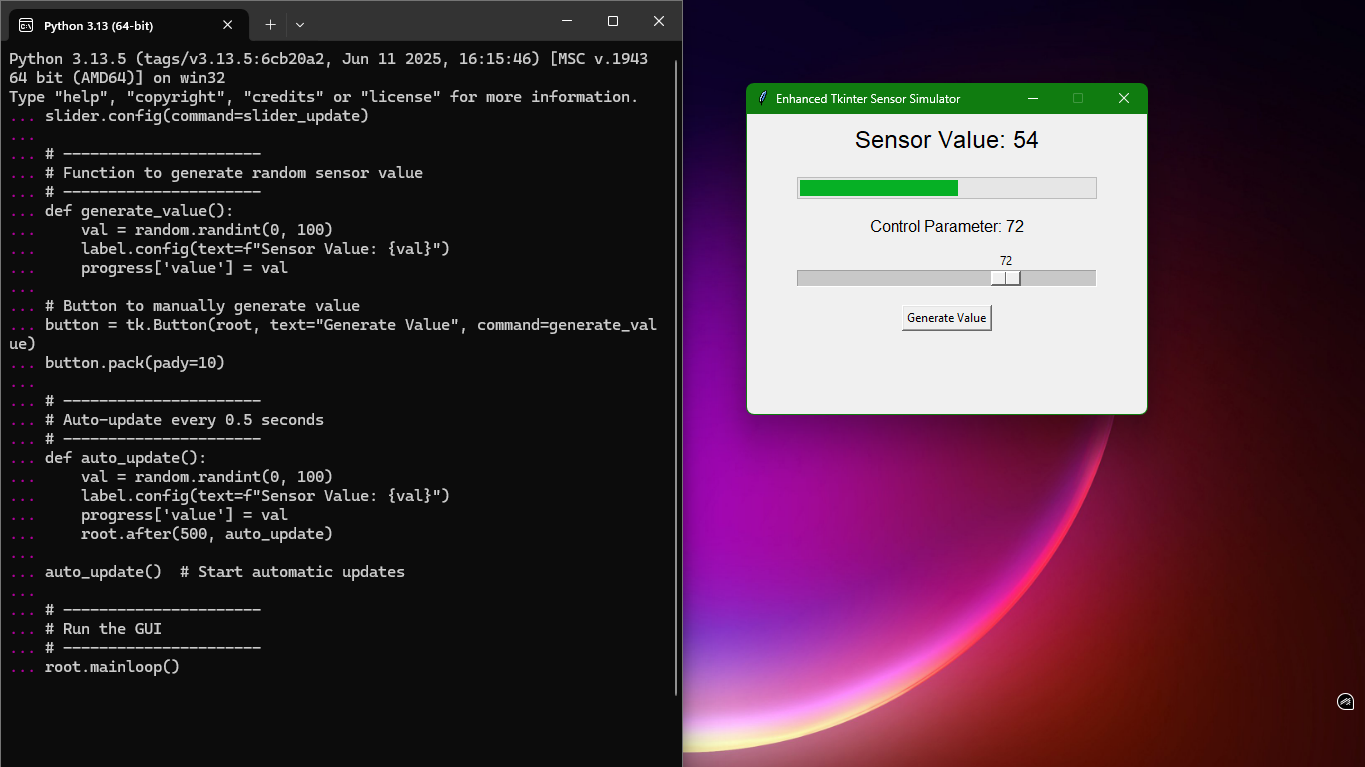
ii.Tkinter GUI
Goal: Simulate live sensor readings with interactive widgets.
Features Implemented:
- Label showing sensor value
- Progress bar visualizing sensor value
- Slider to simulate user control
- Button for manual updates
- Auto-update every 0.5 seconds
Code:
import tkinter as tk
import random

class SensorGUI:
    def __init__(self, root):
        self.root = root
        self.root.title("Sensor Data Monitor")
        self.root.geometry("400x300")

        self.sensor_value = 50

        # Create widgets
        self.label = tk.Label(root, text="Sensor Value: 50", font=("Arial", 14))
        self.label.pack(pady=20)

        self.progress = tk.Scale(root, from_=0, to=100, orient=tk.HORIZONTAL,
                               length=300, showvalue=1)
        self.progress.set(50)
        self.progress.pack(pady=10)

        self.update_btn = tk.Button(root, text="Update Manually", command=self.update_value)
        self.update_btn.pack(pady=10)

        # Auto-update every 500ms
        self.auto_update()

    def update_value(self):
        self.sensor_value = random.randint(0, 100)
        self.label.config(text=f"Sensor Value: {self.sensor_value}")
        self.progress.set(self.sensor_value)

    def auto_update(self):
        self.update_value()
        self.root.after(500, self.auto_update)

if __name__ == "__main__":
    root = tk.Tk()
    app = SensorGUI(root)
    root.mainloop()
iii. Observation
- Tkinter allows full flexibility for designing GUIs.
- Supports multiple widgets and live updates.
- More coding knowledge is required than Node-RED.
- Can be extended to include graphs, multiple controls, or logging features.
iv. Hero Shot
Processing

i.Overview
Processing is a visual programming environment designed for interactive graphics and animation.
- Focused on real-time visual representation
- Simple syntax for drawing shapes, updating values, and handling user inputs
- Supports buttons, sliders, and key/mouse interaction
- Cross-platform (Windows, Mac, Linux)
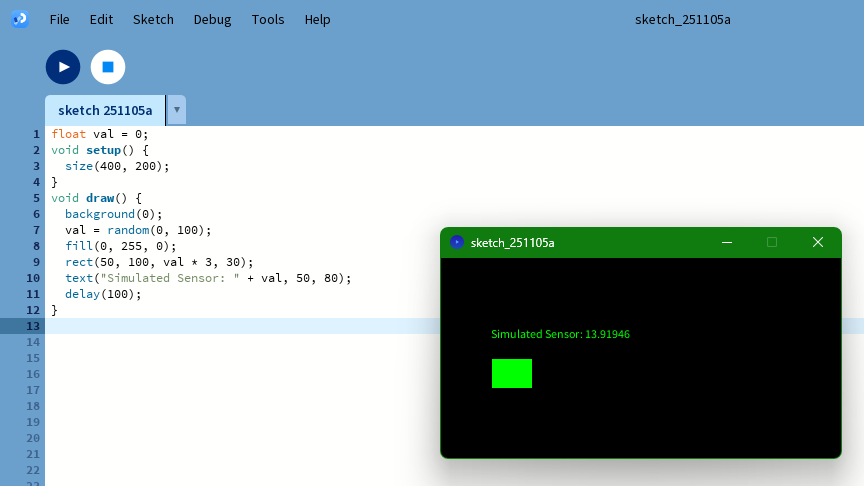
ii. Processing Example
Goal: Simulate a sensor value and display as a circle size that changes with input.
Code:
float sensorValue = 50;
float circleSize = 100;

void setup() {
  size(800, 600);
  textSize(20);
}

void draw() {
  background(40);

  // Draw circle with size based on sensor value
  fill(100, 150, 255);
  ellipse(width/2, height/2, circleSize, circleSize);

  // Display sensor value
  fill(255);
  text("Sensor Value: " + int(sensorValue), 20, 30);
  text("Press UP/DOWN arrows to change value", 20, 60);
  text("Click to randomize", 20, 90);
}

void keyPressed() {
  if (keyCode == UP) {
    sensorValue = min(100, sensorValue + 5);
  } else if (keyCode == DOWN) {
    sensorValue = max(0, sensorValue - 5);
  }
  circleSize = map(sensorValue, 0, 100, 50, 300);
}

void mousePressed() {
  sensorValue = random(0, 100);
  circleSize = map(sensorValue, 0, 100, 50, 300);
}
iii. Observation
- Processing is ideal for visual and graphical representation of dynamic data.
- Real-time interaction is simple using keyboard, mouse, or other inputs.
- Less suitable for integrating multiple widgets like sliders, progress bars, and buttons (requires more code).
- Strong focus on animations and visual feedback, making it great for simulations and creative coding.
iv. Screenshot
Comparison of Tools
| Feature | Node-RED | Python Tkinter | Processing |
|---|---|---|---|
| Programming Type | Flow-based, visual | Code-based | Code-based, visual focus |
| Platform | Web Browser | Desktop (Python) | Desktop / IDE |
| Ease of UI creation | High (drag-and-drop) | Medium (requires code) | Medium (requires code) |
| Real-time Updates | Yes, with dashboard | Yes, via after() | Yes, via draw() loop |
| Integration with Hardware | Easy (IoT, APIs) | Possible with libraries | Limited (requires code) |
| Learning Curve | Low | Medium | Medium |
| Suitable for | Rapid prototyping, IoT | Custom GUIs, simulations | Visual simulations, graphics |
Conclusion
Node-RED: Best for beginners and rapid prototyping; visual flows make building dashboards easy.
Python Tkinter: Suitable for custom desktop GUIs; highly flexible but requires coding.
Processing: Best for visual simulations and animation; excellent for demonstrating dynamic behavior.
All three tools demonstrate interface design, input/output handling, and real-time visualization. Node-RED provides drag-and-drop simplicity, Tkinter provides coding flexibility, and Processing focuses on interactive graphical simulations.
References
- Node-RED Documentation: https://nodered.org/docs/
- Node-RED Dashboard: https://flows.nodered.org/node/node-red-dashboard
- Tkinter Documentation: https://docs.python.org/3/library/tkinter.html
- Processing Reference: https://processing.org/reference/