Group Assignment - Electronic Design
In this Week, I have Contributed in the understanding characteristics of Electonic components such as Microcontrollers and Multimeters
Objectives of the Week
- To use the test equipment in our lab to observe the operation of a microcontroller circuit board
- Demonstrate the use of a multimeter and oscilloscope
Oscilloscope
An oscilloscope is an electronic test instrument used to observe and analyze varying signal voltages. It displays a graph of an electrical signal, usually as voltage (Y-axis) over time (X-axis). The process of using an oscilloscope involves:
- Receiving a signal through a probe connected to a test point in a circuit.
- Amplifying and conditioning the input signal to suitable levels.
- Sampling the signal using an analog-to-digital converter (in digital scopes).
- Displaying the waveform on a screen as voltage vs. time.
- Allowing user adjustments for time base, voltage scale, and triggering.
- Analyzing waveform features such as rise time, frequency, or distortion.
- Storing data for further analysis or exporting in modern digital models.
Specifications of Oscilloscope
| Feature | Specification |
|---|---|
| Model | Tektronix MSO22 |
| Analog Channels | 2 |
| Bandwidth Options | 70 MHz / 100 MHz / 200 MHz / 350 MHz / 500 MHz (upgradable via license) |
| Sample Rate | Up to 2.5 GS/s (half channels), 1.25 GS/s (all channels) |
| Record Length | 10 million points per channel |
| Vertical Resolution | 8 bits (up to 16 bits in High-Resolution mode) |
| Digital Channels (Optional) | 16 channels (MSO capability) |
| Waveform Capture Rate | >4,000,000 wfms/sec |
| Display | 10.1” capacitive touchscreen, 1280 x 800 resolution |
| Connectivity | USB 2.0, LAN (Ethernet), VNC remote access |
| Trigger Types | Edge, Pulse Width, Runt, Timeout, Logic, Setup & Hold, Rise/Fall Time, Bus |
| Math & Analysis Tools | 37 measurements, cursors, FFT, limit testing, equation editor |
Multimeter
Multimeters are essential for diagnosing electrical/electronic issues in circuits. It is a versatile electronic measuring instrument used to check basic electrical parameters like Voltemeter, Ammeter, Continuity test, etc…
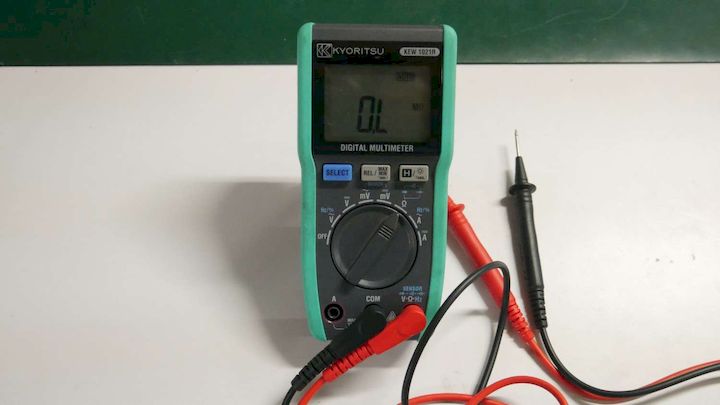
- Measuring the Voltage and Current both AC and DC
- Measuring the resistance value
- Troubleshooting the electronic components
- Checking the continuity test on circuit
Interpret a Signal
We create an analog-like output using PWM on pin 9. An LED is connected to visualize the signal, and both an oscilloscope and multimeter are used for signal analysis.
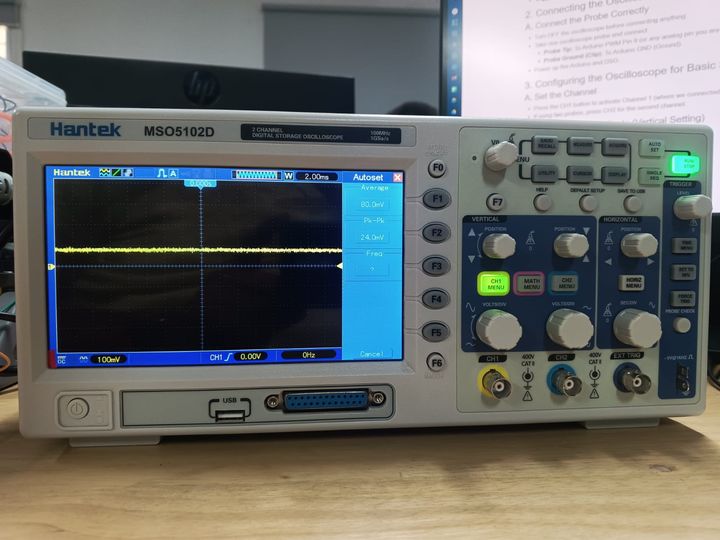
1. Key Components of the Digital Storage Oscilloscope (DSO)
- Power Button: Switches the oscilloscope ON or OFF.
- Display Screen: Shows the real-time waveform.
- Probe Inputs (CH1, CH2): Connect probes here for signal monitoring.
- Time/Div Knob: Adjusts the time scale (horizontal axis).
- Volts/Div Knob: Adjusts the voltage scale (vertical axis).
- Trigger Controls: Helps capture a steady waveform on screen.
2. Connecting the Oscilloscope to Arduino
A. Proper Probe Connection
- Turn OFF the oscilloscope before making any connections.
- Take a probe and connect:
- Probe Tip: To Arduino's PWM pin (e.g., pin 9).
- Ground Clip: To Arduino’s GND pin.
- Power ON both the Arduino and the oscilloscope.
3. Setting Up the Oscilloscope for Signal Visualization
A. Select the Active Channel
- Press the CH1 button to enable Channel 1 (where the probe is connected).
- Use CH2 if you’re using a second probe on another signal.
B. Set the Voltage Scale (Vertical)
- Use the Volts/Div knob to set the vertical scale.
- Start at 1V/div and adjust as needed.
- For Arduino's 5V PWM signal, try 2V/div for a clear view.
C. Set the Time Scale (Horizontal)
- Use the Time/Div knob to adjust the time base.
- Start with 1ms/div for PWM around 500Hz.
- Use 100µs/div or less for faster signals.
D. Configure Trigger Settings
- Open the Trigger Menu and configure as follows:
- Mode: Edge
- Source: CH1
- Slope: Rising
- Level: Adjust the trigger level until waveform is steady
4. Viewing the Signal on the Oscilloscope
- Press AUTOSET to let the DSO automatically adjust settings.
- If AUTOSET isn’t effective, manually fine-tune Volts/Div and Time/Div.
- Look for the waveform:
- For PWM, you should see a consistent square wave.
- For analog sensors, expect more varied waveforms.
- Use the measurement tools or cursors (if available) to analyze signal voltage and timing.
5. Capturing and Analyzing the Signal
- Use the Save function on the DSO (if available) to capture the waveform.
- Compare the signal with expected behavior from your Arduino code.
- Make changes to the code if signal characteristics are off.
            // Arduino Code for generating a PWM signal

            void setup() {
            pinMode(9, OUTPUT); // Set pin 9 as output
            }

            void loop() {
            for (int pwmValue = 0; pwmValue < 255; pwmValue++) {
                analogWrite(9, pwmValue);  // Output PWM signal on pin 9
                delay(50);                  // Wait for 50 milliseconds
            }
            }