
For the group assignment, I didn’t have a proper place to carry out the activity, so I contacted a friend, Omar, who had the necessary equipment at his house. He has been helping me with some of the equipment he owns and with key concepts to better understand electronics. This helped me a lot, as he had the equipment required for the assignment, which allowed me to see its utility and gain a clearer understanding of various aspects of electronics.
I currently work at Fab Lab iFurniture as a Fab Manager, so whenever we have visitors or organize training sessions, I am responsible for leading this workshop on risk prevention and workplace safety. For this reason, I have organized a group invitation to my colleagues from Fab Academy to participate in this workshop.
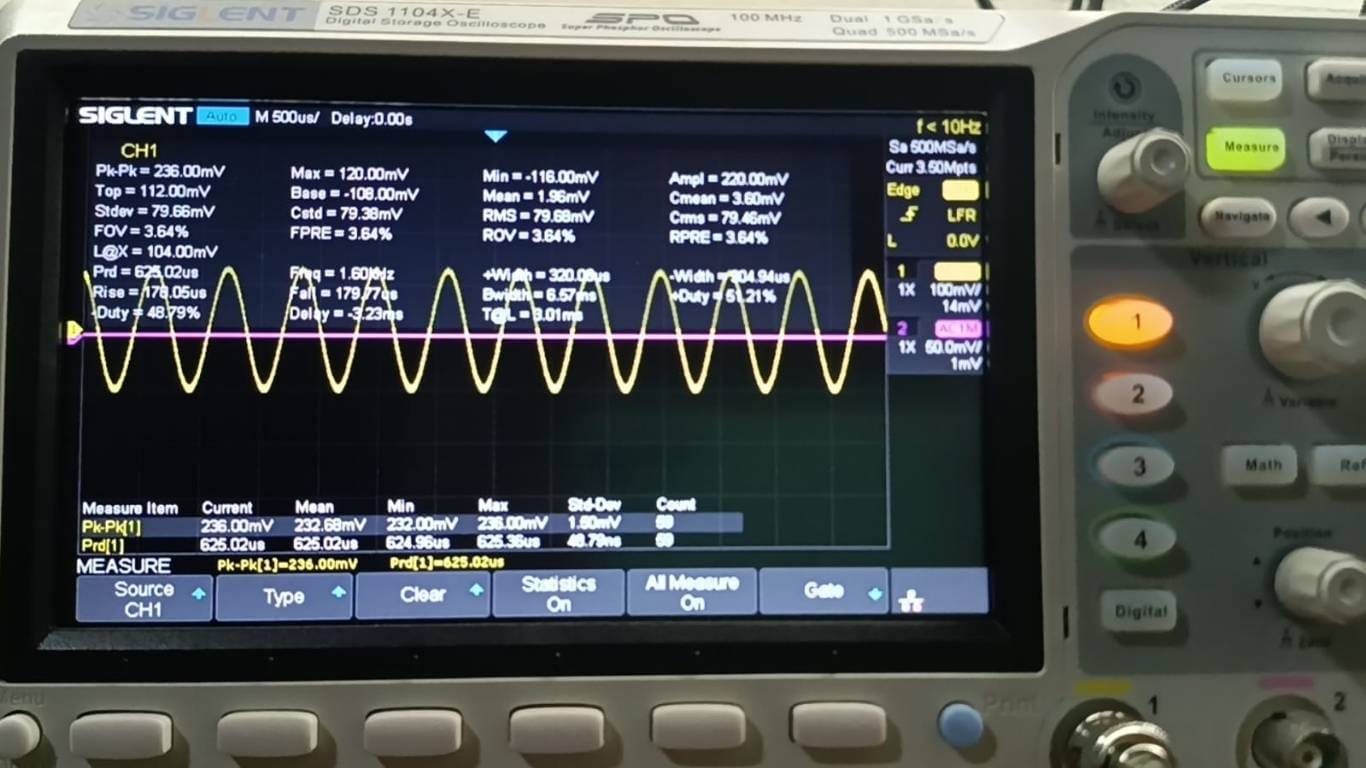
What is displayed on the screen is the result of configuring the LED to trigger every 0.1 seconds. Each pulse or square on the screen represents 100 millivolts. In my LED, the voltage is 200 millivolts, so each square represents 50 milliseconds. In practice, I have 2 squares, which equal 100 milliseconds.
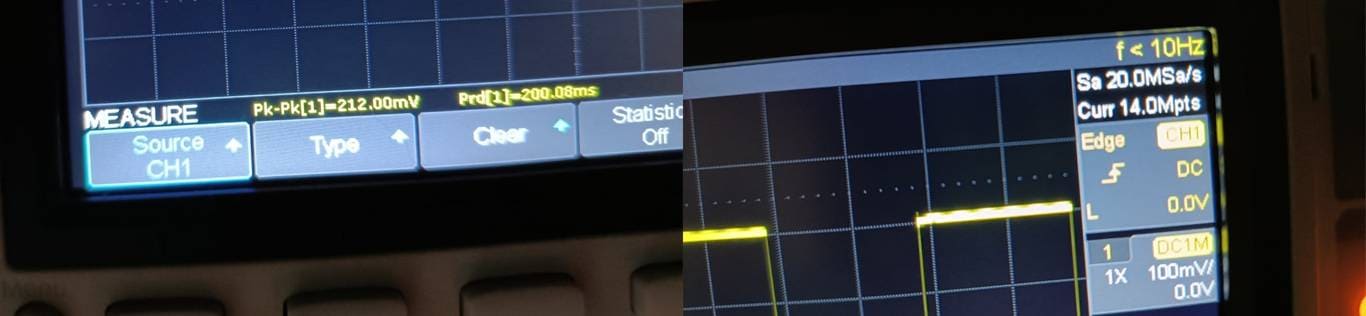
In the signal analysis, the Pk-Pk (peak-to-peak) value I obtained is 212.00 mV. The sampling rate is 20.0 MSa/s (million samples per second), with a memory depth of 14.0 Mpts (million points per channel). This indicates that the oscilloscope is sampling at a high rate and has sufficient memory capacity to capture complex and high-resolution signals.
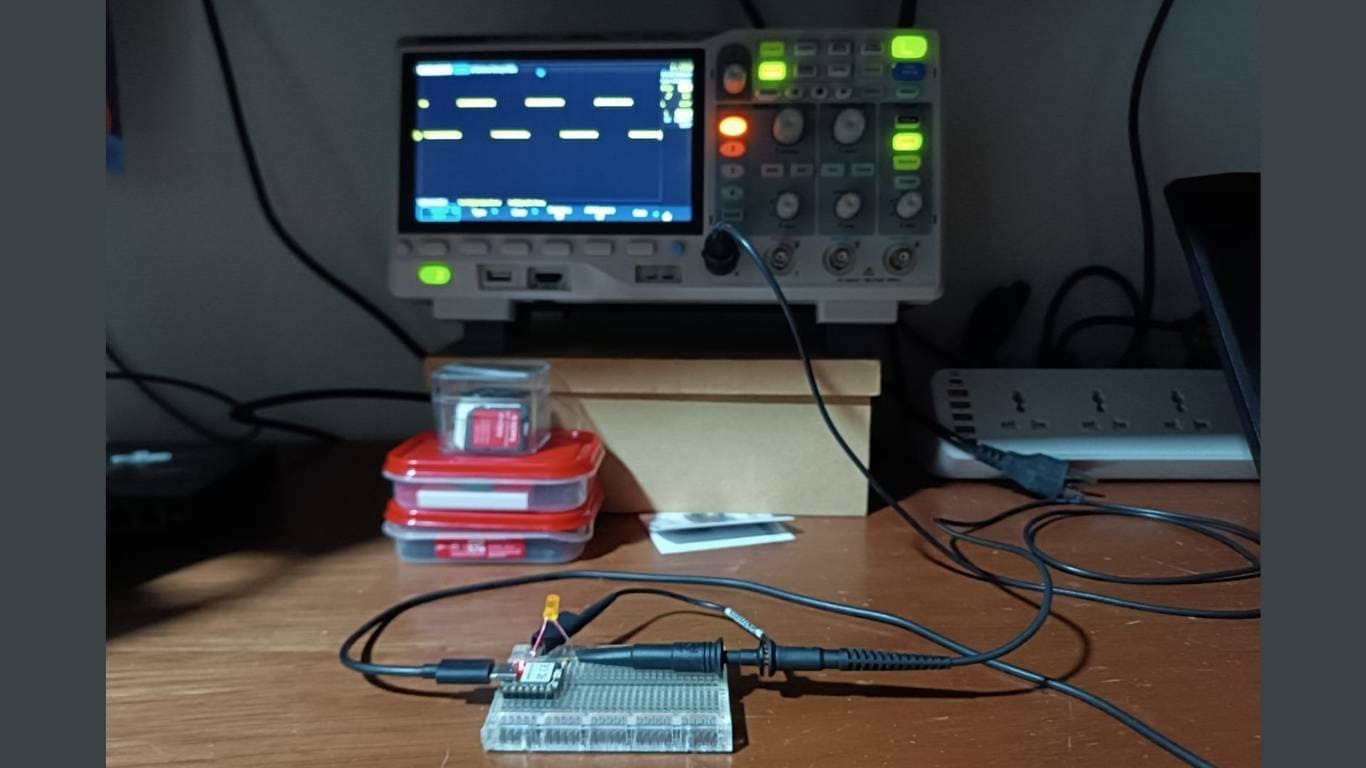
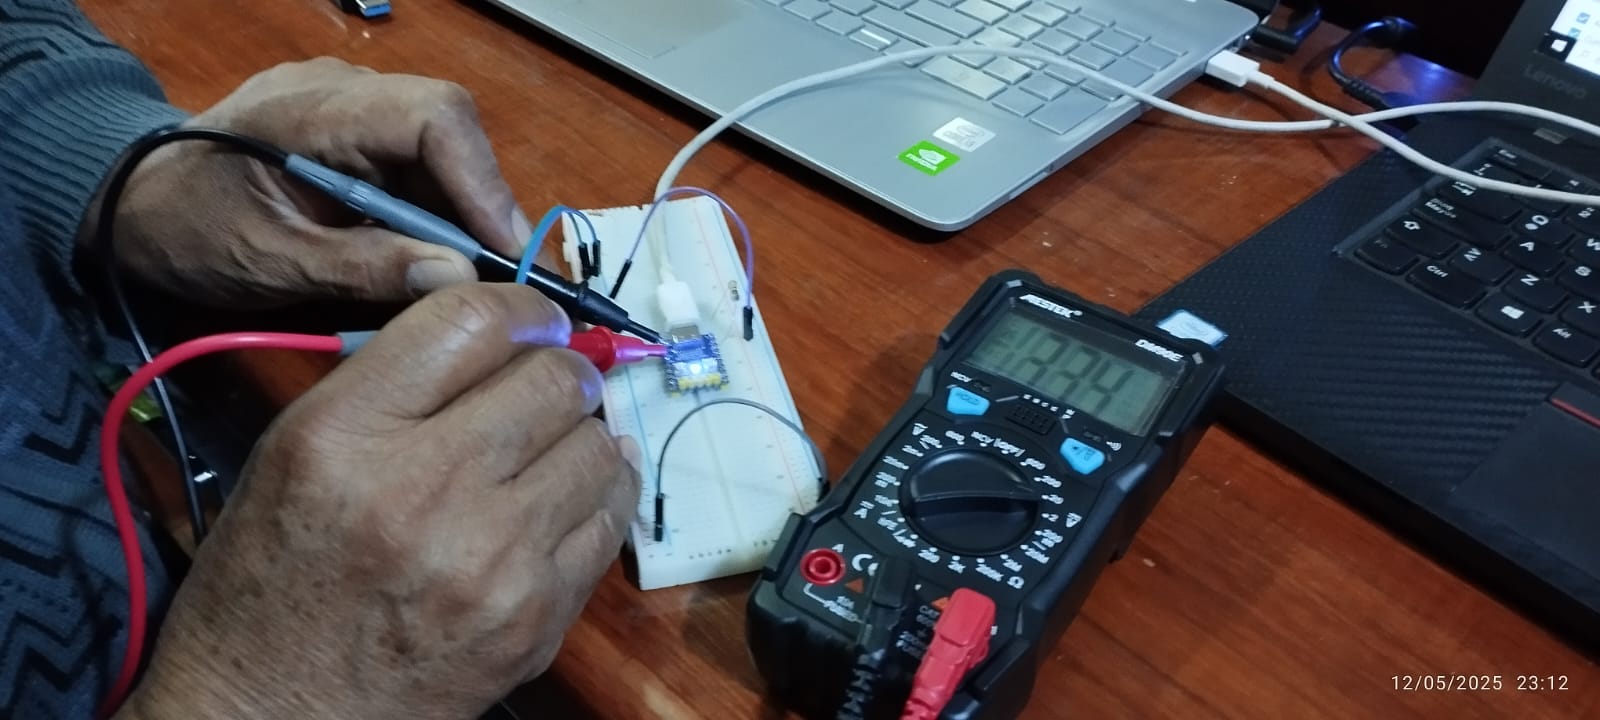
For this exercise, the microcontroller must be connected to a power source in order to use the oscilloscope. This is necessary because the oscilloscope measures the electrical signals generated by the microcontroller, and it needs the microcontroller to be active and functioning in order to obtain accurate readings.
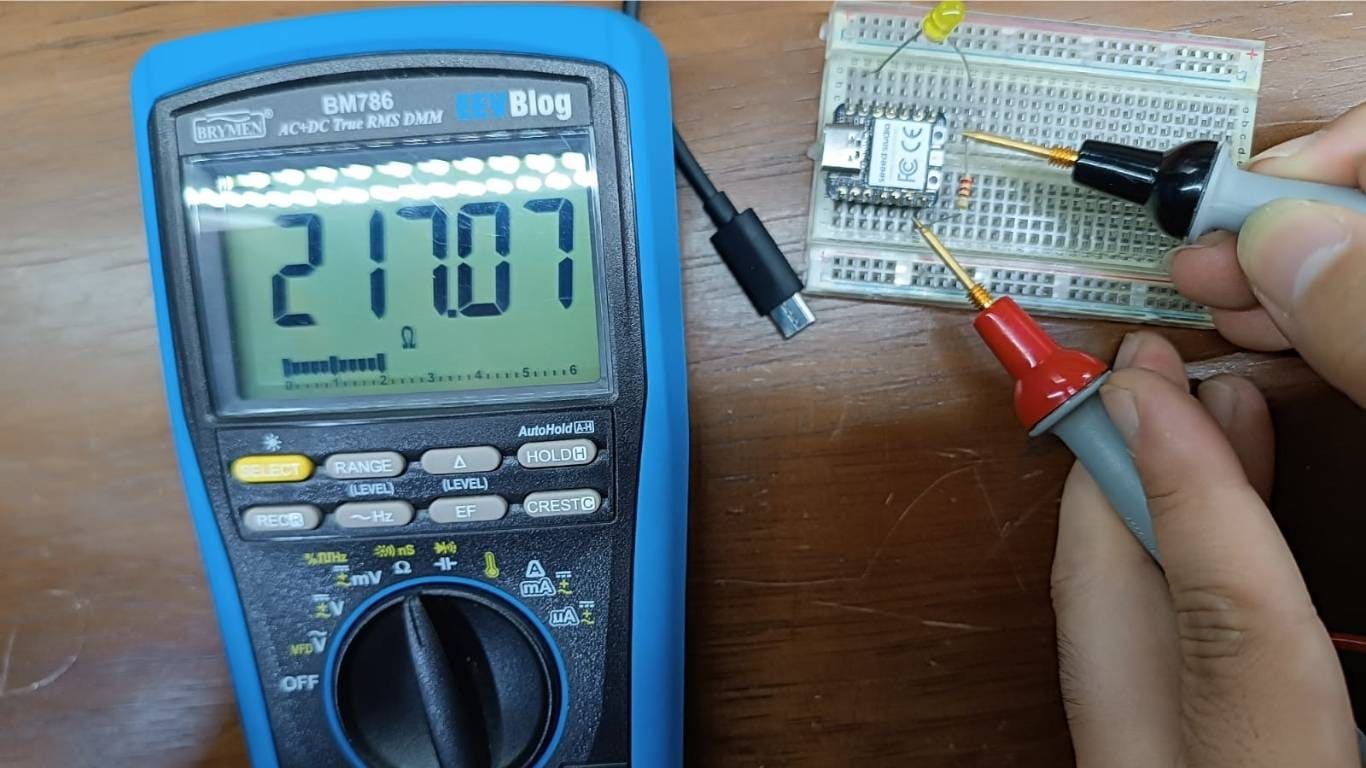
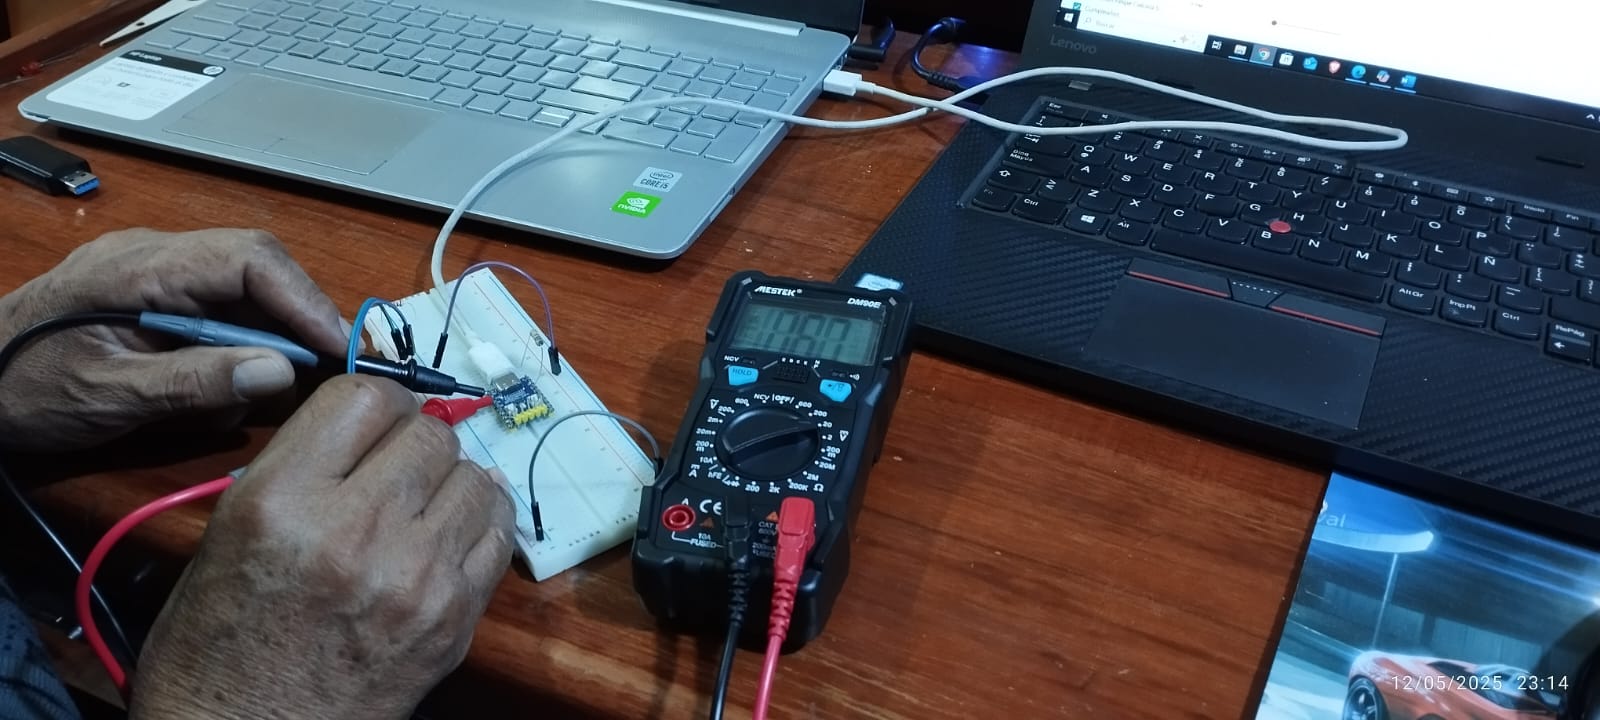
Now I will use the multimeter to measure the resistance. For this, the component must be disconnected from the power source to make an accurate measurement. The reading obtained in ohms is 217.07 Ω.
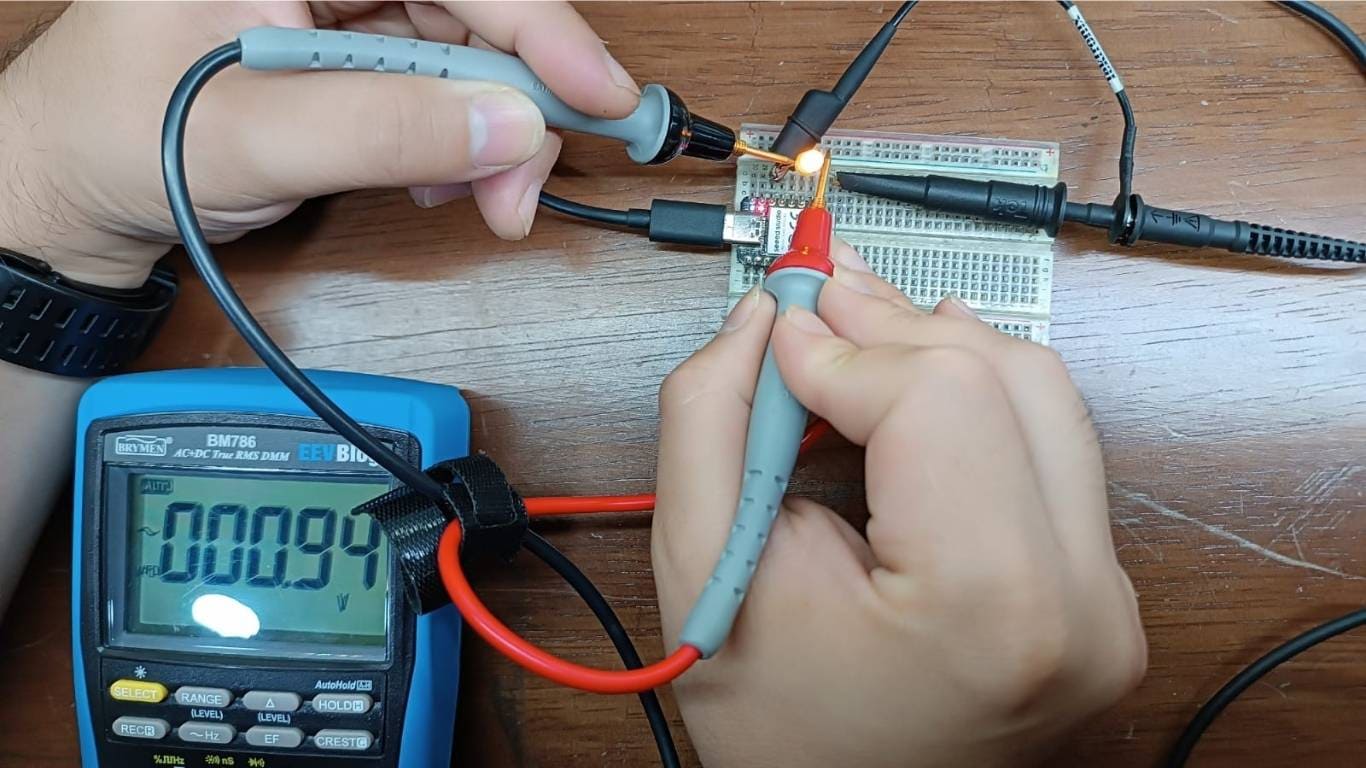
To measure the LED, it must be connected to a power source. Then, we perform the same process with the multimeter, and the reading obtained was 0.94 V. This value corresponds to the voltage drop across the LED when it is operating. The LED typically has a voltage drop that varies depending on its type and color. In this case, the 0.94 V reading indicates that the LED is functioning correctly within the expected range, as the typical voltage drop of common LEDs is usually between 1.8 V and 3.2 V, depending on the type of LED.
For this task, I used my personal oscilloscope, since the UNCP Fab Lab where I work doesn't currently have this testing instrument. So, I made the most of this instrument, as it's a PC oscilloscope with a good bandwidth (20 MHz). The software is intuitive. In addition, it allowed me to better understand the concepts of measuring different signals. This measuring instrument is very similar to a bench oscilloscope.

The Hantek oscilloscope has 8 channels for performing various tests. It features over 80 types of diagnostic functions, and a video help function: it provides video help for diagnostics, which can be viewed online. Diagnostic results can be generated as a report, printed, or taken as screenshots with the touch of a button.
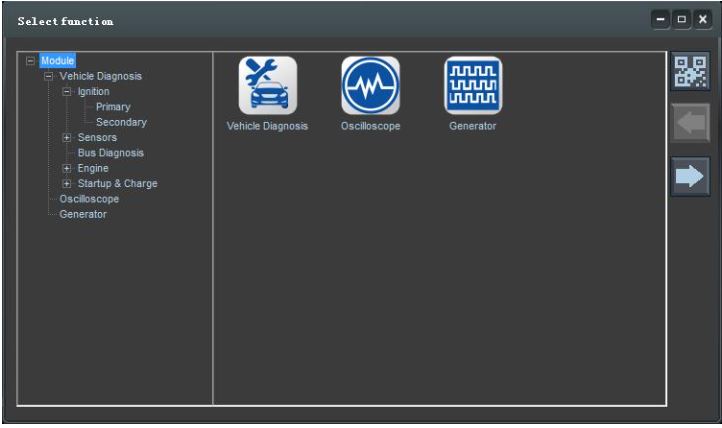
On the home screen there are three diagnostic functions, oscilloscope and signal generator.
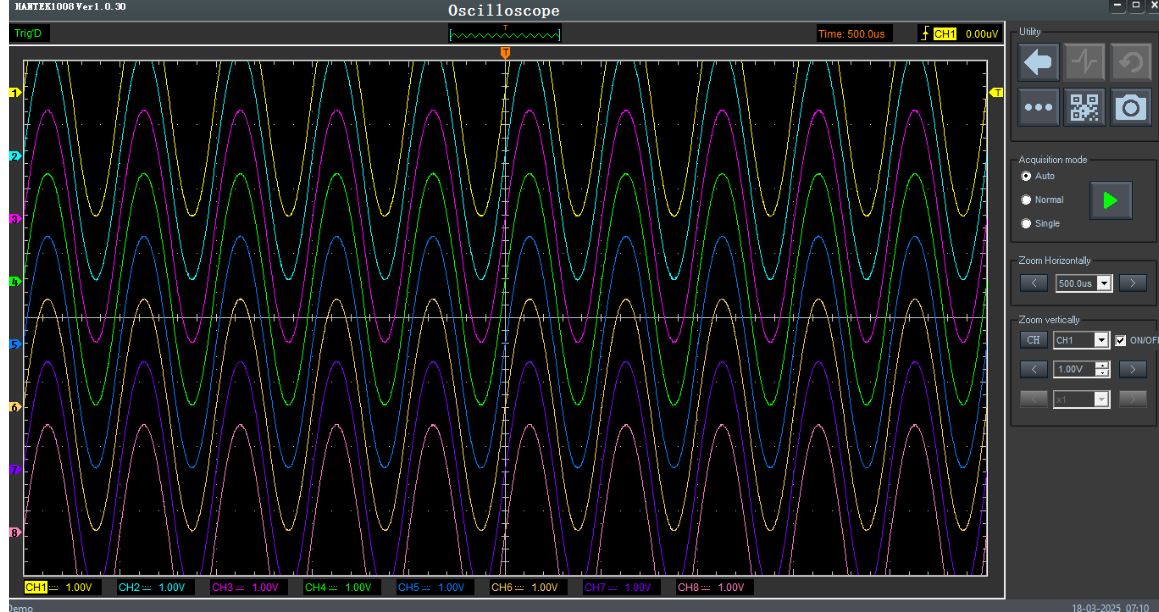
The first step is to turn on the oscilloscope and, by default, observe the functions of 08 channels. To perform the tests, we will deactivate 07 channels, leaving only channel 01 for testing on the XIAO ESP 32C3 microcontroller.
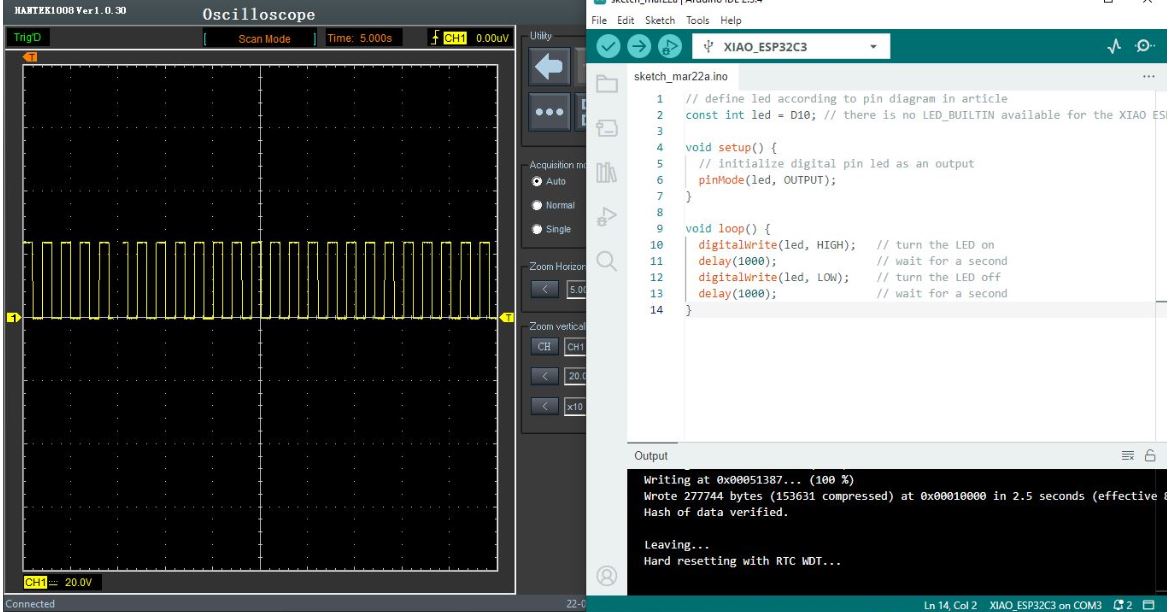
On the screen connected to the Hantek oscilloscope, you can see the measurement of the output signal on the LED diode connected to pin D10 and GND of the XIAO ESP32C3 microcontroller.
For the second measurement, we used the multimeter, which is a portable electrical instrument capable of directly measuring electrical magnitudes, such as voltage, resistance and current. In this case, I measured the 3v3 output voltage of the RP2040 zero card.

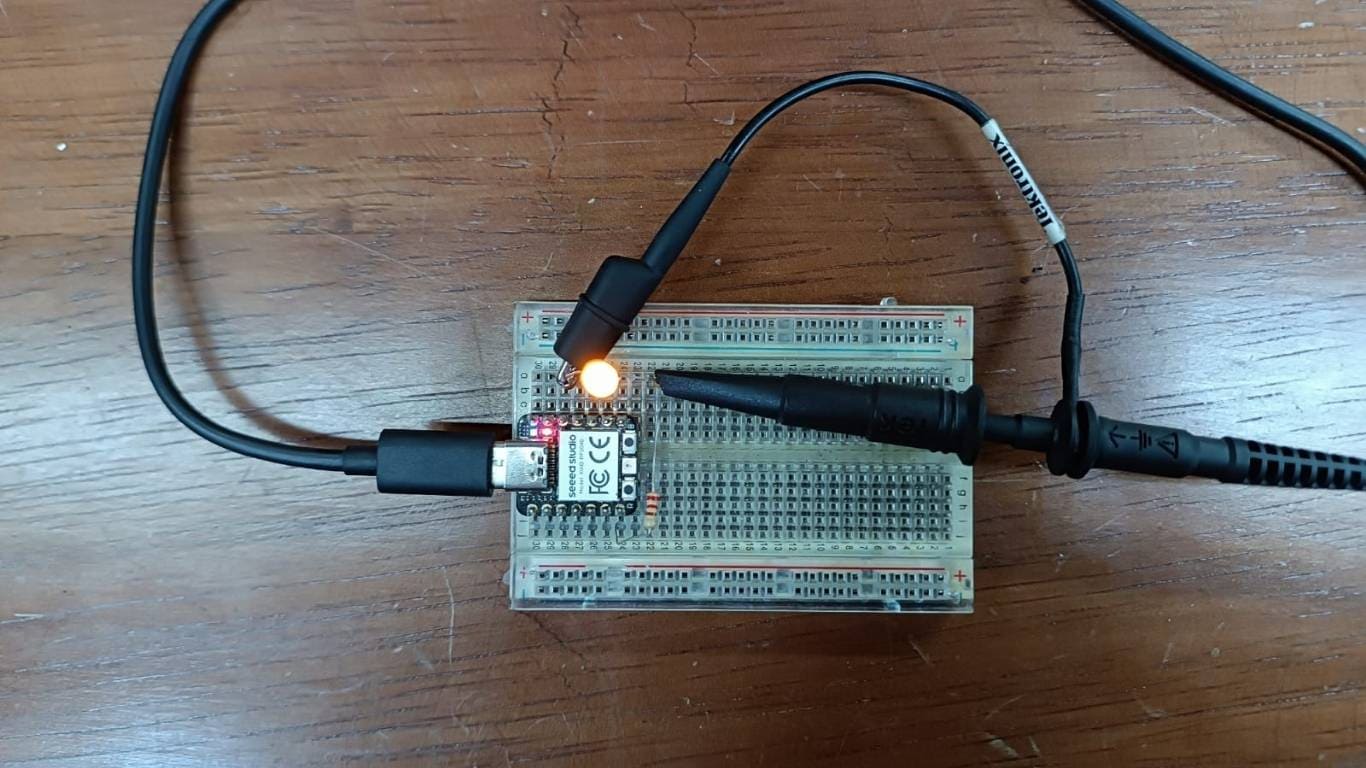
For this week's group assignment on Electronics Design, we used the Seeed Studio XIAO microcontroller along with a capacitive RGB LED module. To carry out the measurements, we assembled a basic test circuit on a breadboard, which allowed easy access for probing with both a multimeter and an oscilloscope.
The objective was to observe how the microcontroller behaves electrically, fulfill the Fab Academy assignment, and improve our understanding of signal behavior in active components like LEDs controlled via PWM.

We started by assembling the circuit using a breadboard. This made it easier to connect and disconnect components and wires for measurement. The circuit includes the Xiao microcontroller and a capacitive RGB LED module.
We first used a multimeter to measure voltage across the RGB LED pins. Because this module uses PWM (Pulse Width Modulation), the voltage varies depending on the duty cycle. This allowed us to detect voltage shifts when changing colors.
Using the oscilloscope, we measured the PWM waveform from the LED module. We initially made a mistake by probing without a dedicated ground wire, which almost caused a short circuit. After correcting this, we could clearly see the pulse patterns controlling the LED intensity.
For this group assignment, we developed a simple Arduino sketch to test the PWM control of an RGB LED using the Seeed Studio XIAO microcontroller. The RGB module used in this test is a common anode type, which means the LED turns ON with a LOW signal (0V) and turns OFF with a HIGH signal (3.3V).
In our code, the GPIO pins are connected as follows:
The program cycles through different color combinations using PWM signals, allowing us to analyze both voltage changes with a multimeter and waveform characteristics using an oscilloscope.
Download Week6_example.inoTeam: Manuel Ayala-Chauvin, Sandra Nuñez-Torres
Institution: Fablab - Universidad Tecnológica Indoamérica
Year: 2025
We analyzed a basic circuit using an Arduino UNO, a red LED, a resistor, and a breadboard. The LED was observed to be ON, confirming that the circuit was correctly powered and functional.

| Measured Parameter | Obtained Value |
|---|---|
| Voltage at Arduino digital output (control pin) | 4.96V |
| Voltage across LED (anode-cathode) | 1.85V |
| Voltage across resistor | 3.11V |
| Current through LED (calculated with Ohm's Law) | 9.42 mA |
The goal is to use the oscilloscope to visualize the PWM signal generated by Arduino. This demonstrates how the duty cycle of the signal changes over time, affecting the LED brightness.
The images show an experiment using an Arduino Uno and a Siglent SDS 1202X-E oscilloscope to observe the PWM signal generated by the microcontroller.
The oscilloscope displays a flat line at 3.3V, indicating that the measured pin is in a constant HIGH state (no PWM modulation visible yet).

The oscilloscope shows a 5V signal, meaning the measured pin is in HIGH state without variations.

A pulsed (PWM) signal appears, with transitions between 0V and 5V. This confirms that Arduino is correctly generating the PWM signal.

The Arduino code implements a progressive fading effect on an LED connected to pin 6 using PWM (Pulse Width Modulation).
led = 6; → Defines pin 6 as the LED output.brillo = 0; → Stores the LED brightness level (PWM value from 0 to 255).aumento = 5; → Defines how much the brightness increases or decreases in each
iteration.setup)pinMode(led, OUTPUT); → Configures pin 6 as an output.
loop)analogWrite(led, brillo); → Sends a PWM signal to the LED.brillo = brillo + aumento; → Increases or decreases brightness.aumento direction is
reversed.delay(100); → Waits 100 ms before the next update.The LED gradually increases in brightness until it reaches the maximum (255). Then, it gradually dims until it reaches 0. This cycle repeats indefinitely.

Click the link below to download the Arduino code:
PwmLED.inoThe circuit functions correctly based on the performed measurements. The LED receives the appropriate voltage, and the current remains within the recommended limits. Further testing could involve programming variations in the Arduino output signal and using an oscilloscope to visualize the waveform.