
This week, the members of Group 1 met to define and evaluate which output devices we would use and which equipment would be available for our research, taking into account the infrastructure of each Fab Lab we are in. Jhonathan is located in Bogotá, Colombia, and I am in Lima, Peru, so we had to coordinate remotely using online communication tools. Based on the evaluation of the available resources at each Fab Lab, we discussed options for output devices, such as displays, LEDs, and other electronic components, to ensure that each of us had access to the necessary equipment for the project's development. This coordination and resource analysis process is crucial to optimize the use of the equipment based on each lab's capabilities.
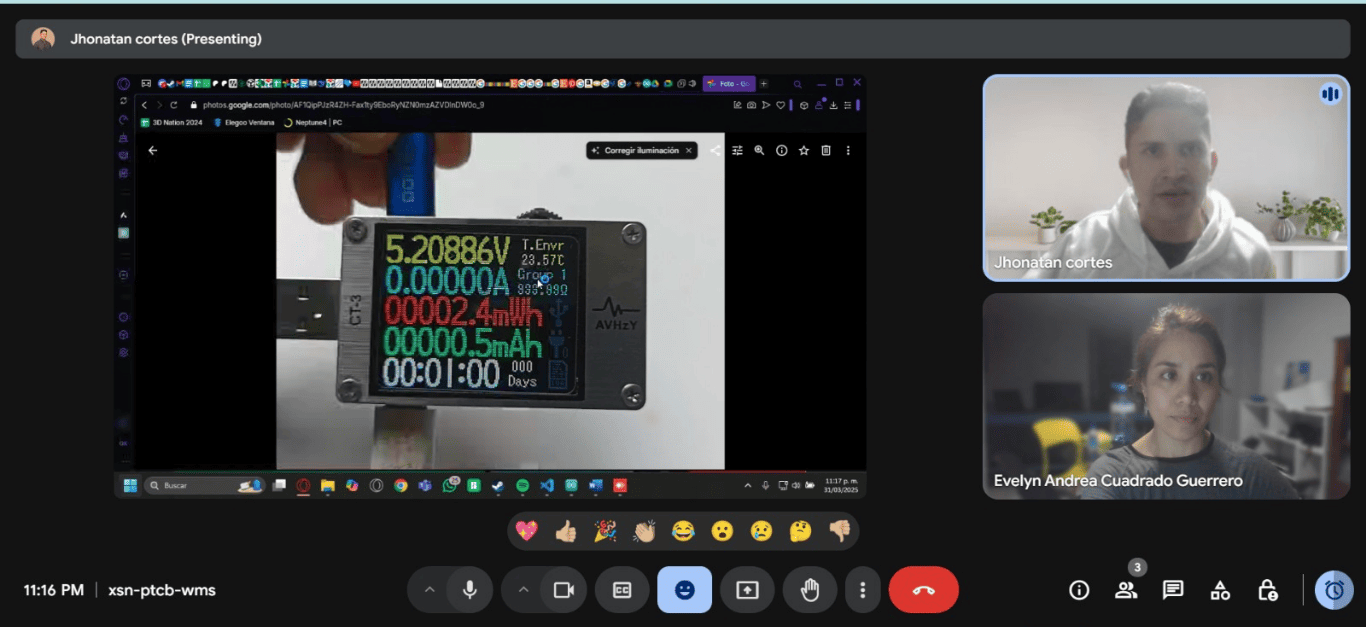
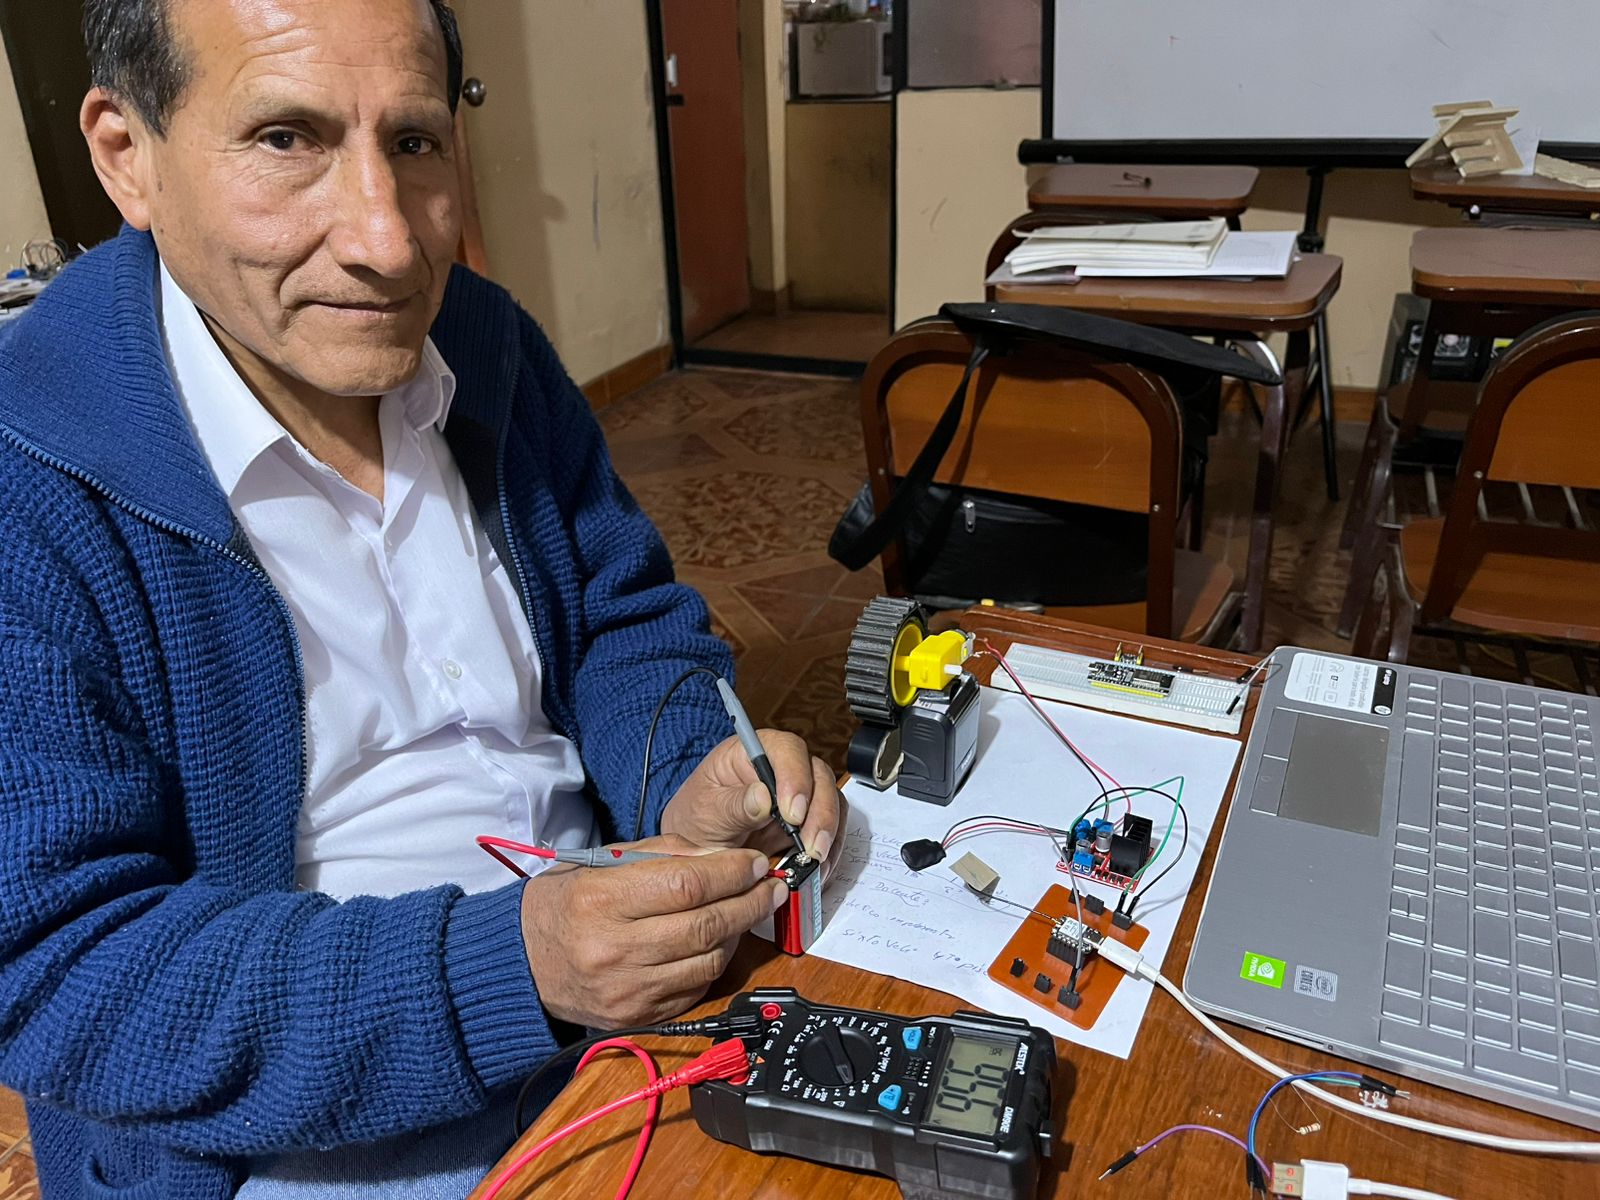
From Bogotá, Jhonathan was able to perform this exercise using a power meter, while I carried out the same activity with a multimeter. Jhonathan explained how to take measurements with a standard multimeter and how to interpret voltage, current, and resistance readings. Through his explanation, I was able to understand the key differences between a power meter and a multimeter. A power meter is more specialized for measuring active, reactive, and apparent power, while a multimeter, although versatile, does not provide a direct power reading but instead measures only basic electrical parameters such as voltage, current, and resistance. This difference allowed me to understand the limitations and advantages of each device in energy measurements.
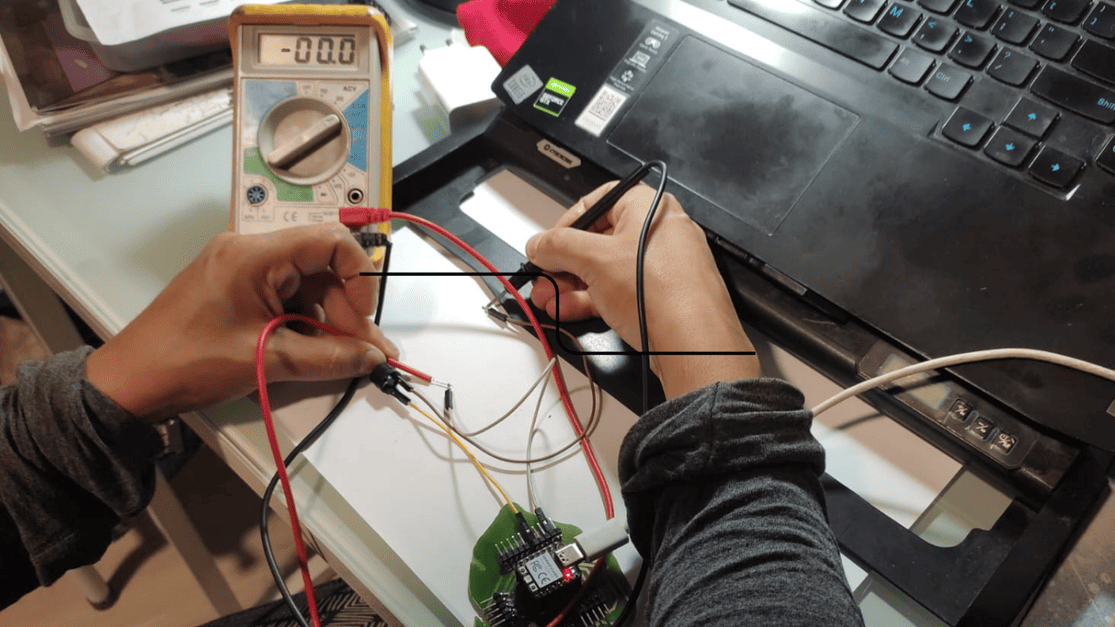
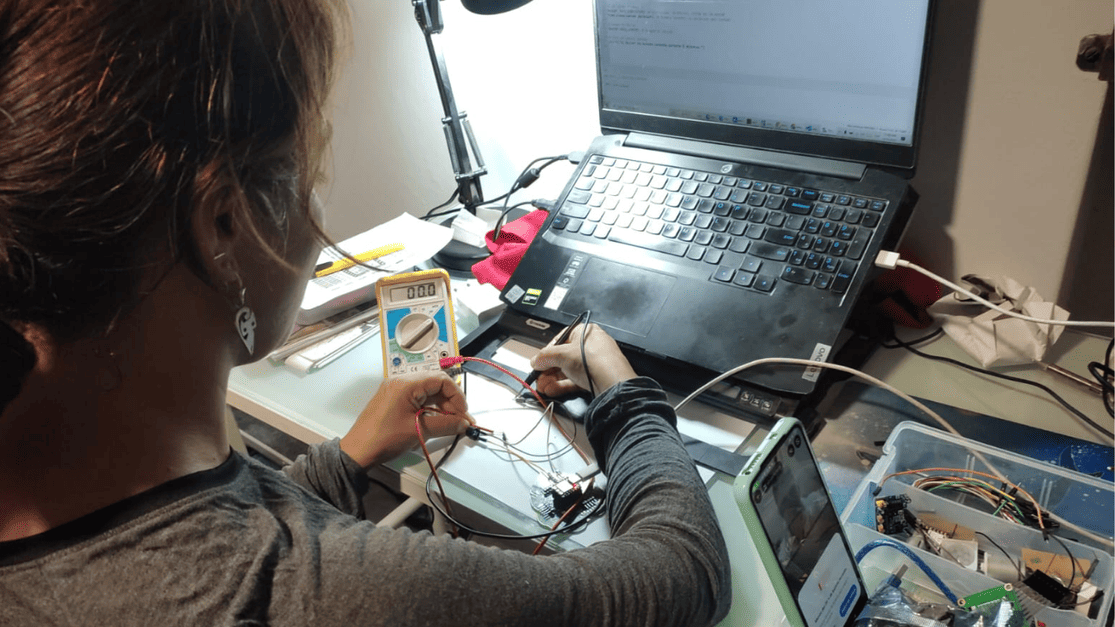
When I measured the buzzer without having it connected to the program, the multimeter displayed a result of 00.0, indicating that the current or voltage was too low to be detected accurately. However, when measuring it while connected to the program, the result shifted to -00.0. This suggests that the buzzer has an extremely low power consumption, making it difficult to get precise measurements with a standard multimeter. This negative reading could be related to how the multimeter handles small signals or a slight fluctuation in the measurement. In comparison, a power meter would be able to record the energy consumption of devices with low current demands, like this buzzer, with greater accuracy.
The measurement I performed for the buzzer was in amperes of direct current (DCA) on the multimeter. Direct current (DC) flows in a single direction, meaning that electrons move uniformly in that direction. During the measurement, the multimeter display alternated between positive and negative readings. This indicates that the multimeter is measuring the current flowing through the buzzer, although it does not provide a precise numerical reading as a more specialized device, such as a power meter, would. Despite not offering an exact figure, it can be interpreted that the buzzer is functioning and that the multimeter is correctly measuring the current. The fluctuation between positive and negative simply reflects the minimal variations that can be difficult to detect accurately due to the buzzer's low current demand.

Initially, we met to define how we would approach the assignment, how we would form the groups, and what our methodology would be.
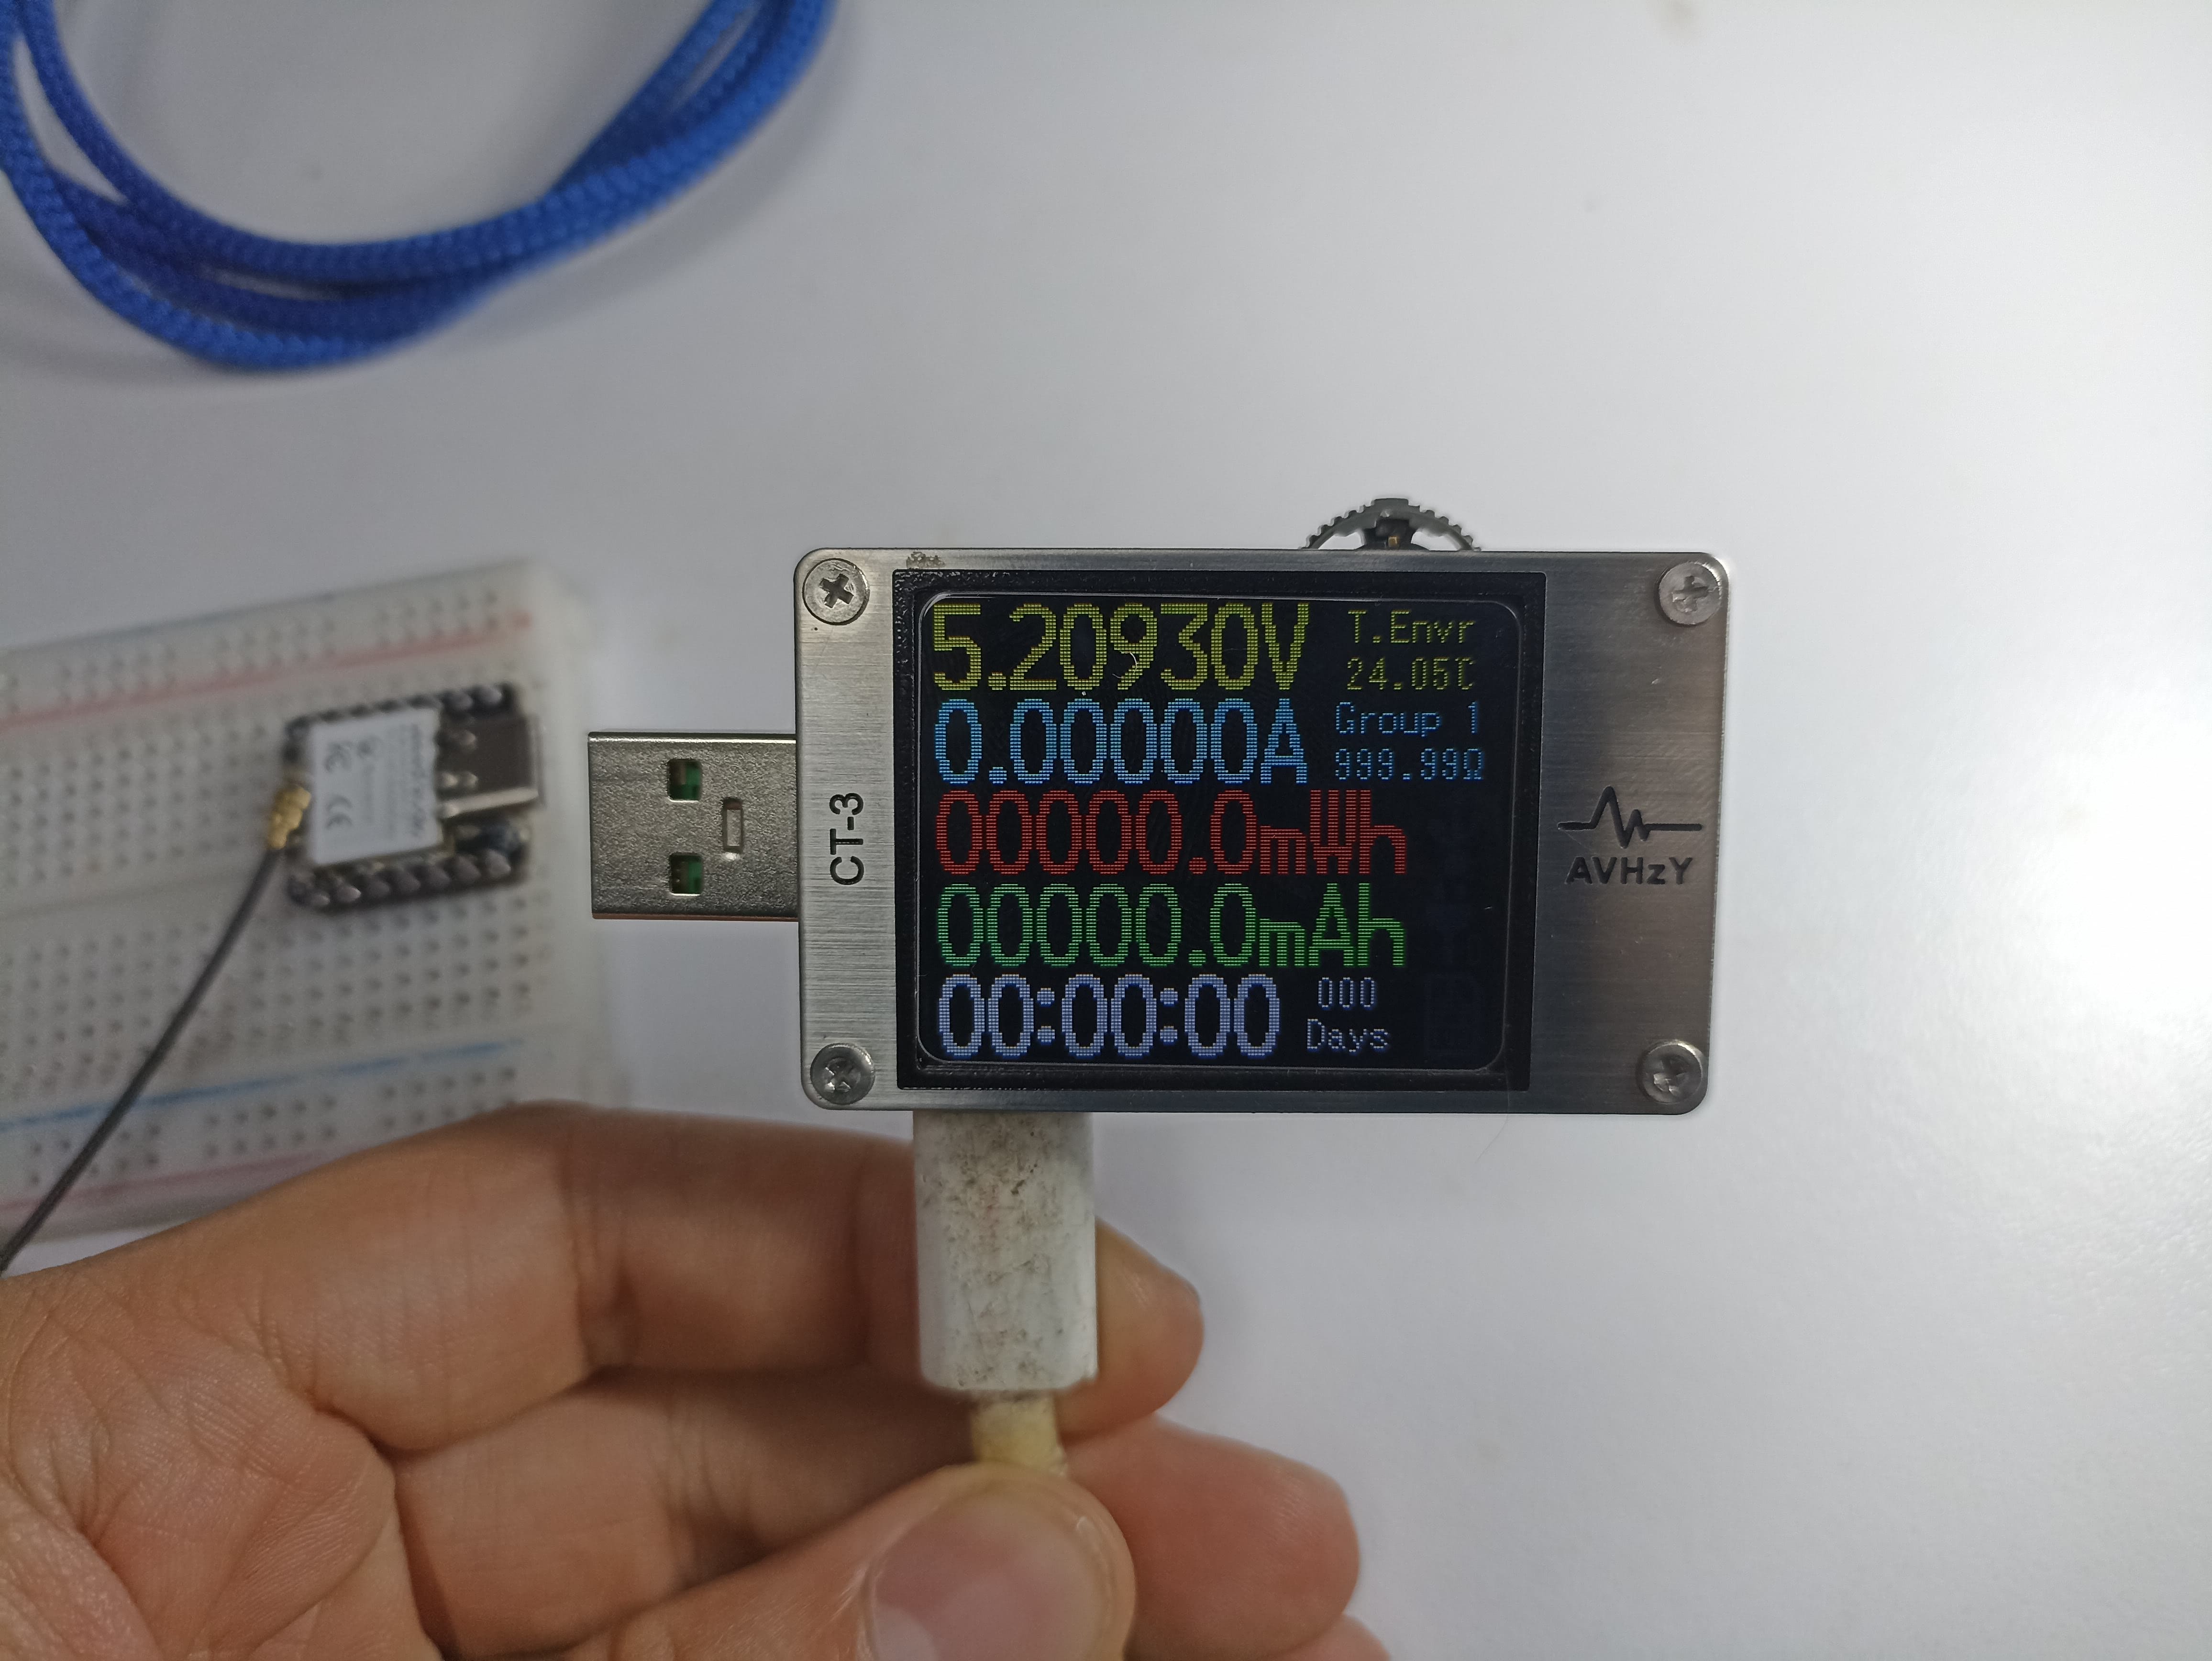
I, Jhonatan Cortés, chose a USB power meter for this week’s assignment, specifically the AVHzY CT-3 model.
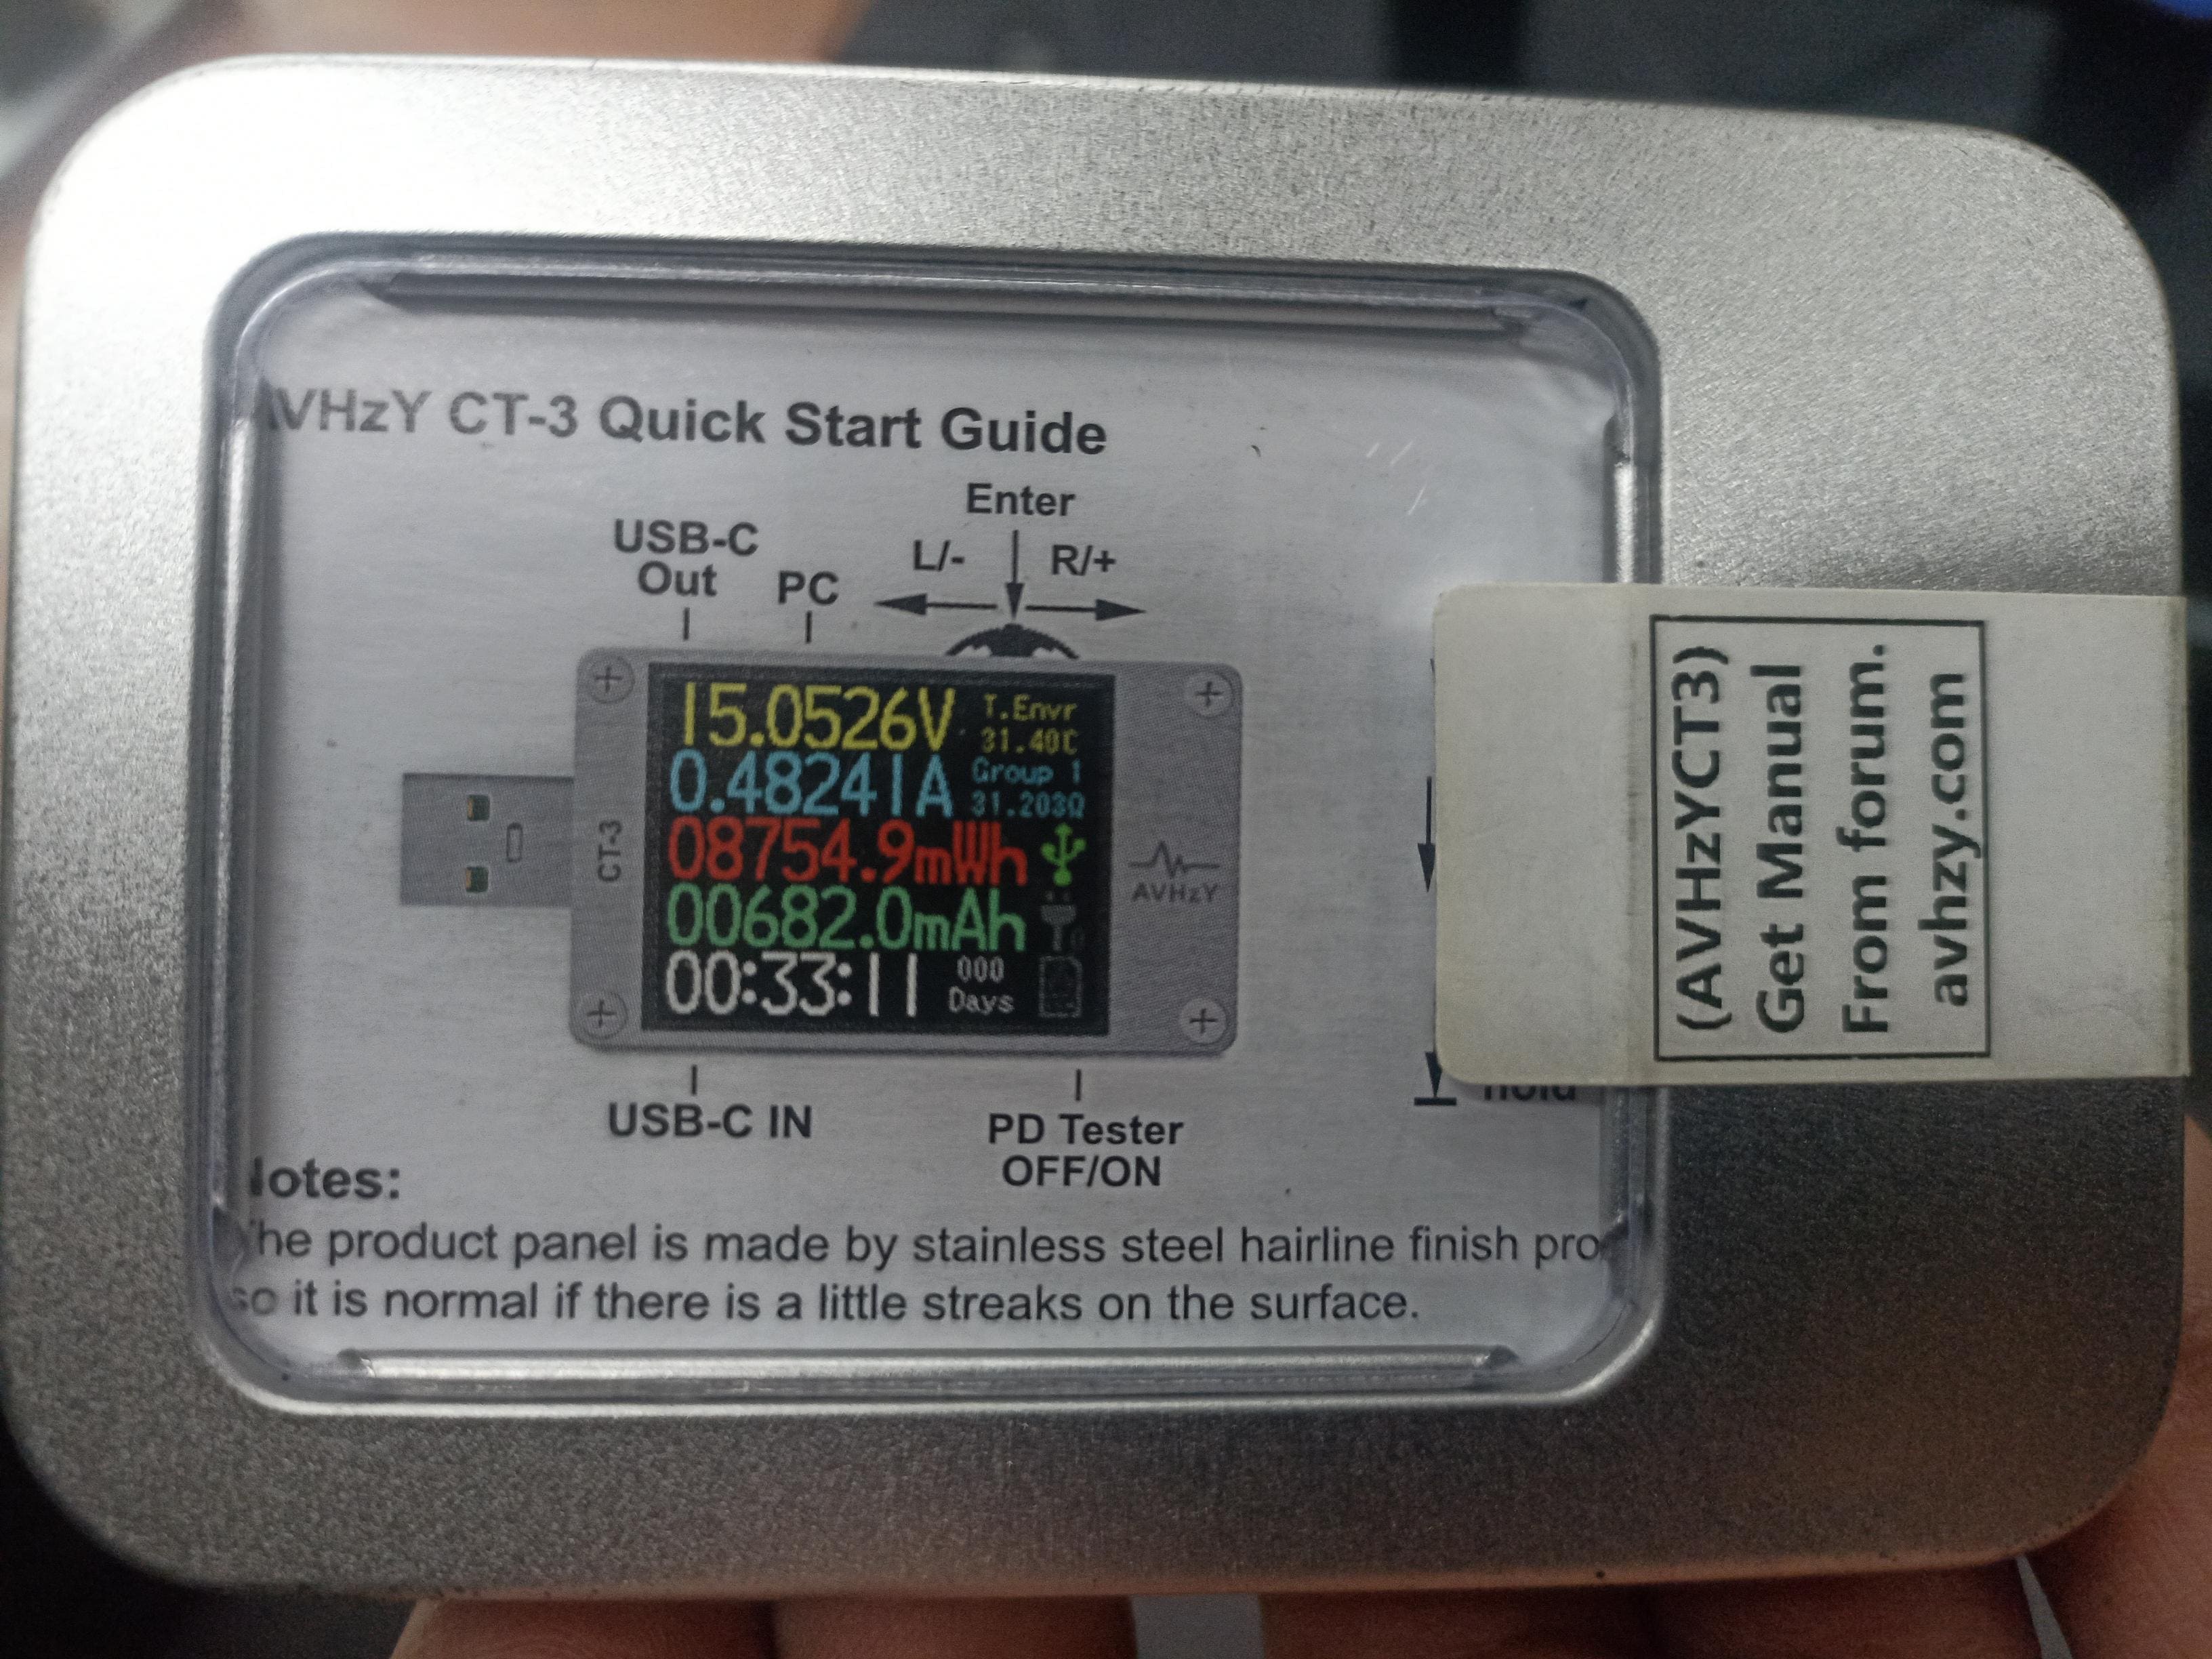
USB Power Meter – AVHzY CT-3
USB 3.1 Tester | Digital Multimeter | Voltage and Current Meter |
Protocol Trigger | Integrated Lua Interpreter | Supports PD 2.0/3.0, QC 2.0/3.0/4.0, PPS
This digital meter allows analyzing voltage, current, and power in USB ports. It is compatible with fast-charging standards such as Power Delivery (PD), Quick Charge (QC), and Programmable Power Supply (PPS).
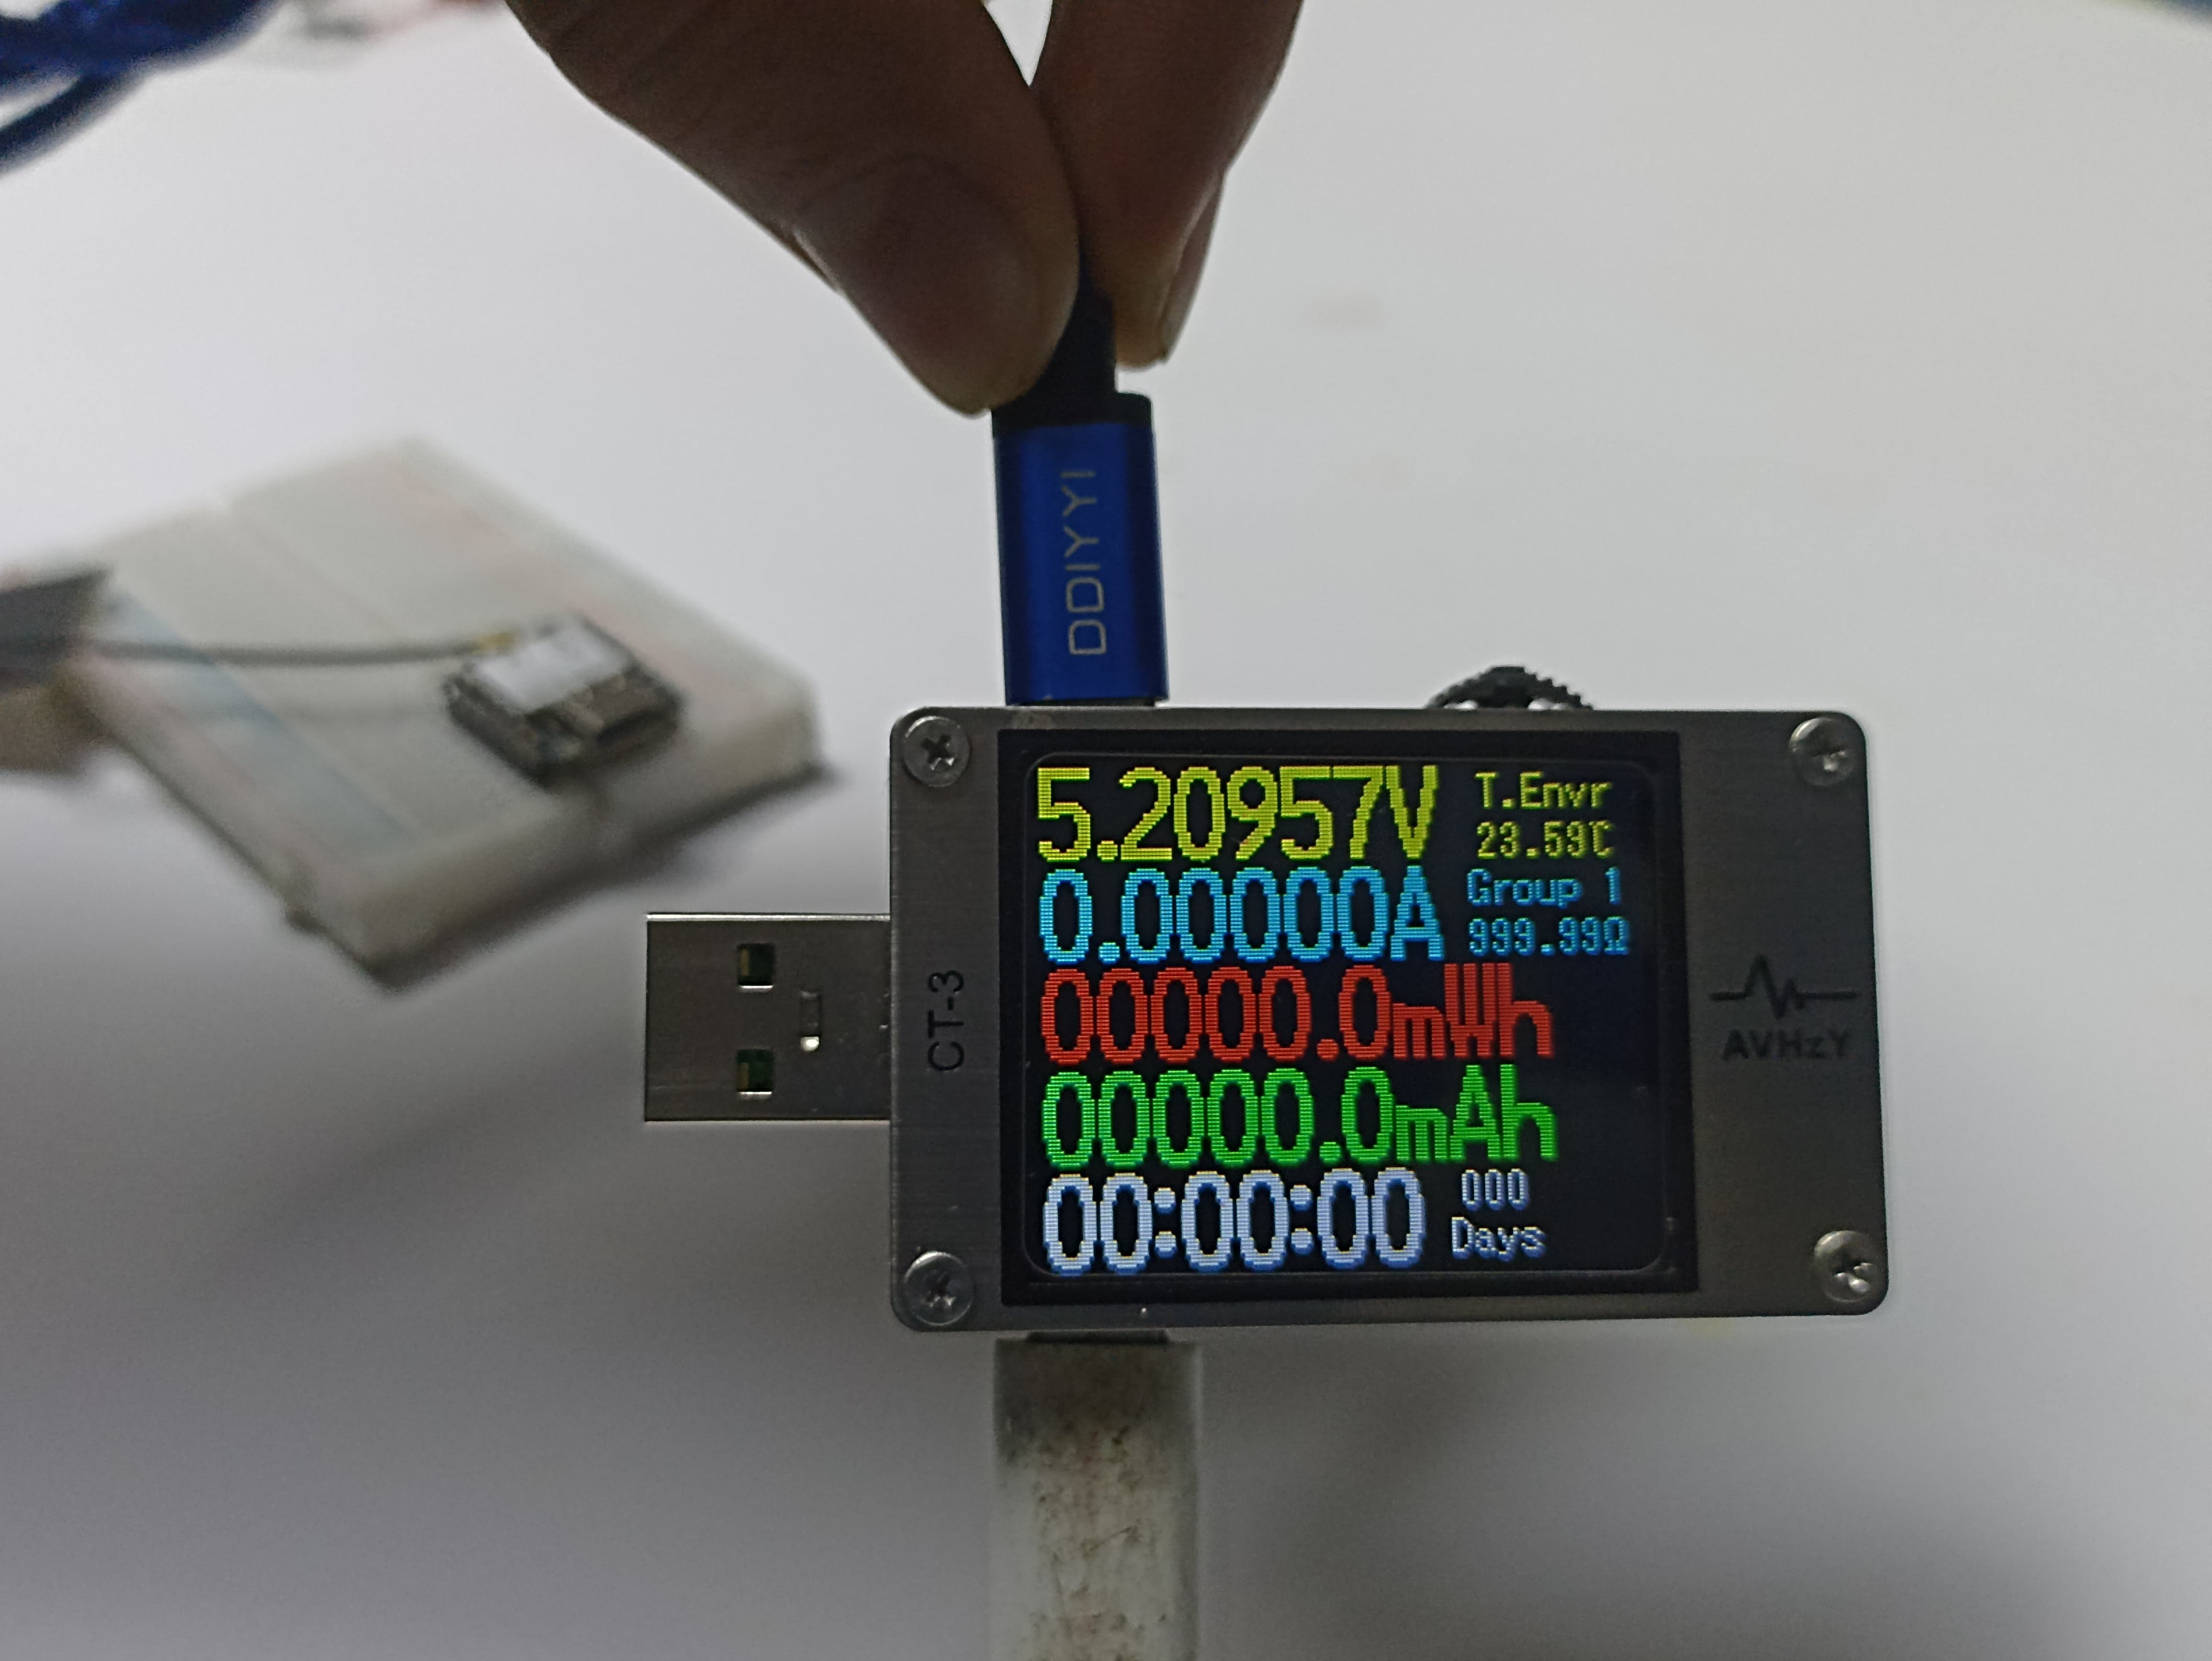
I initially connected it to a mobile charger and reset the readings to zero. The only data shown afterward was the current voltage input, which in this case was 5.2V.
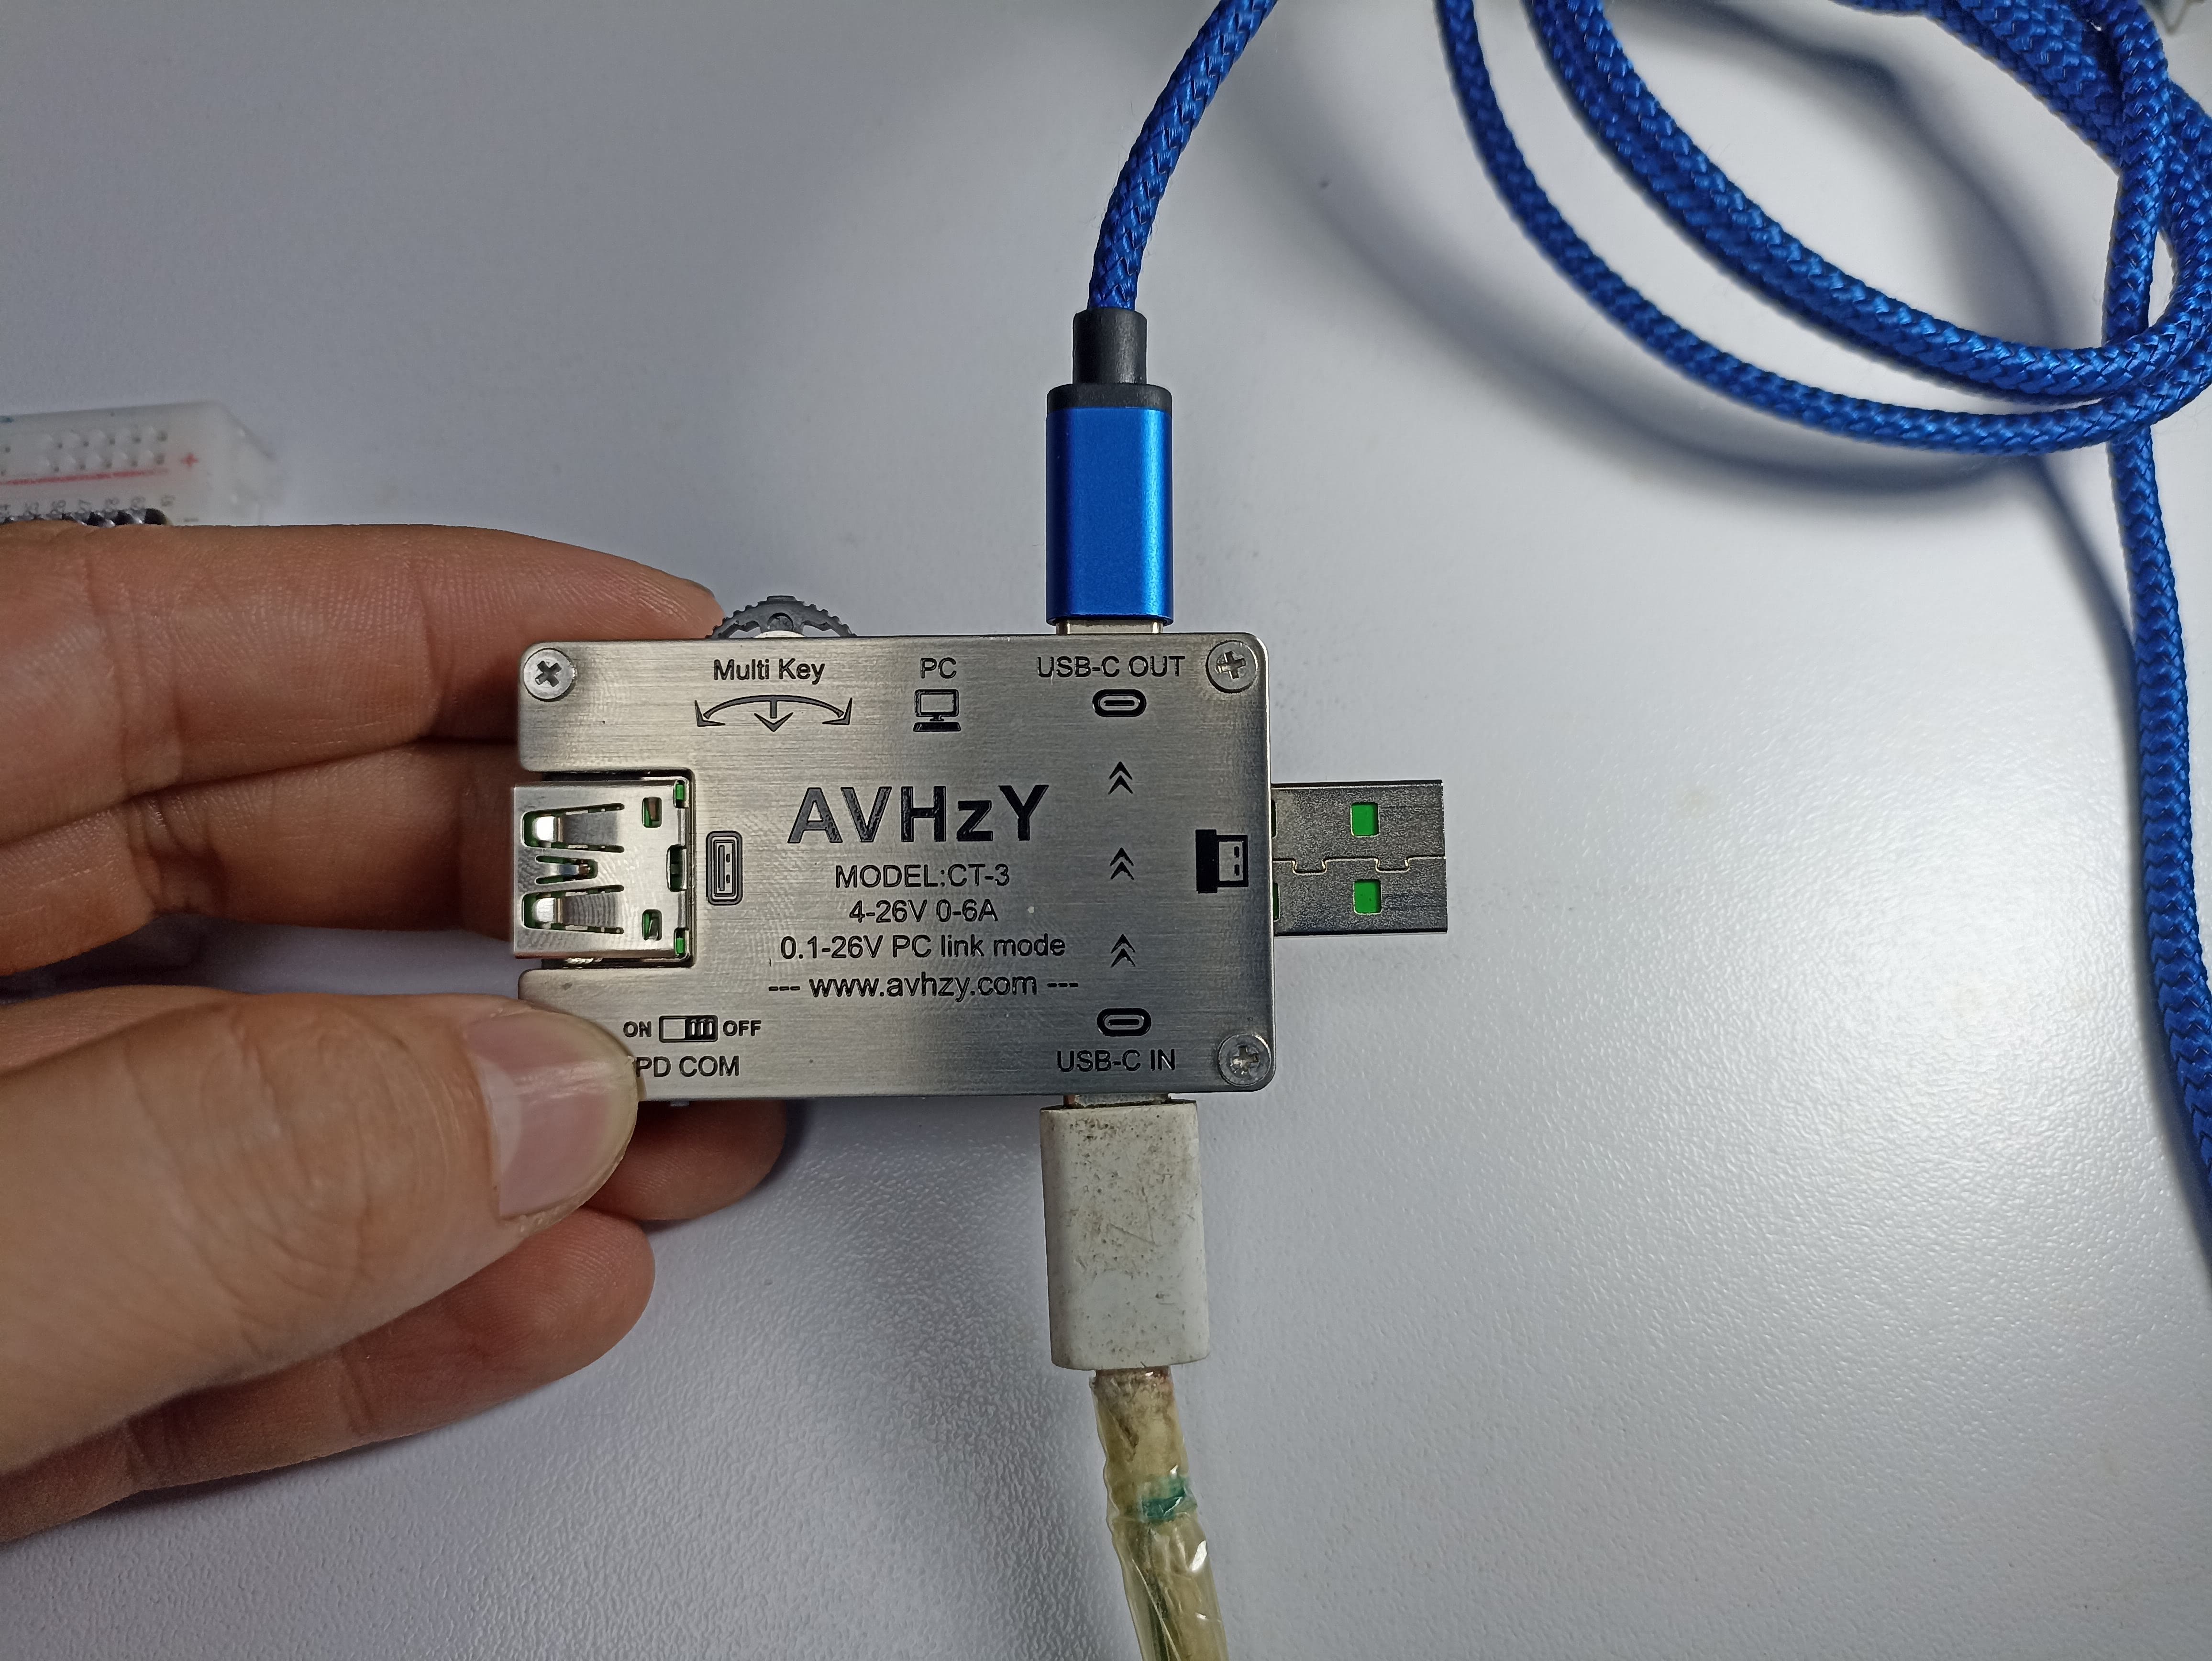
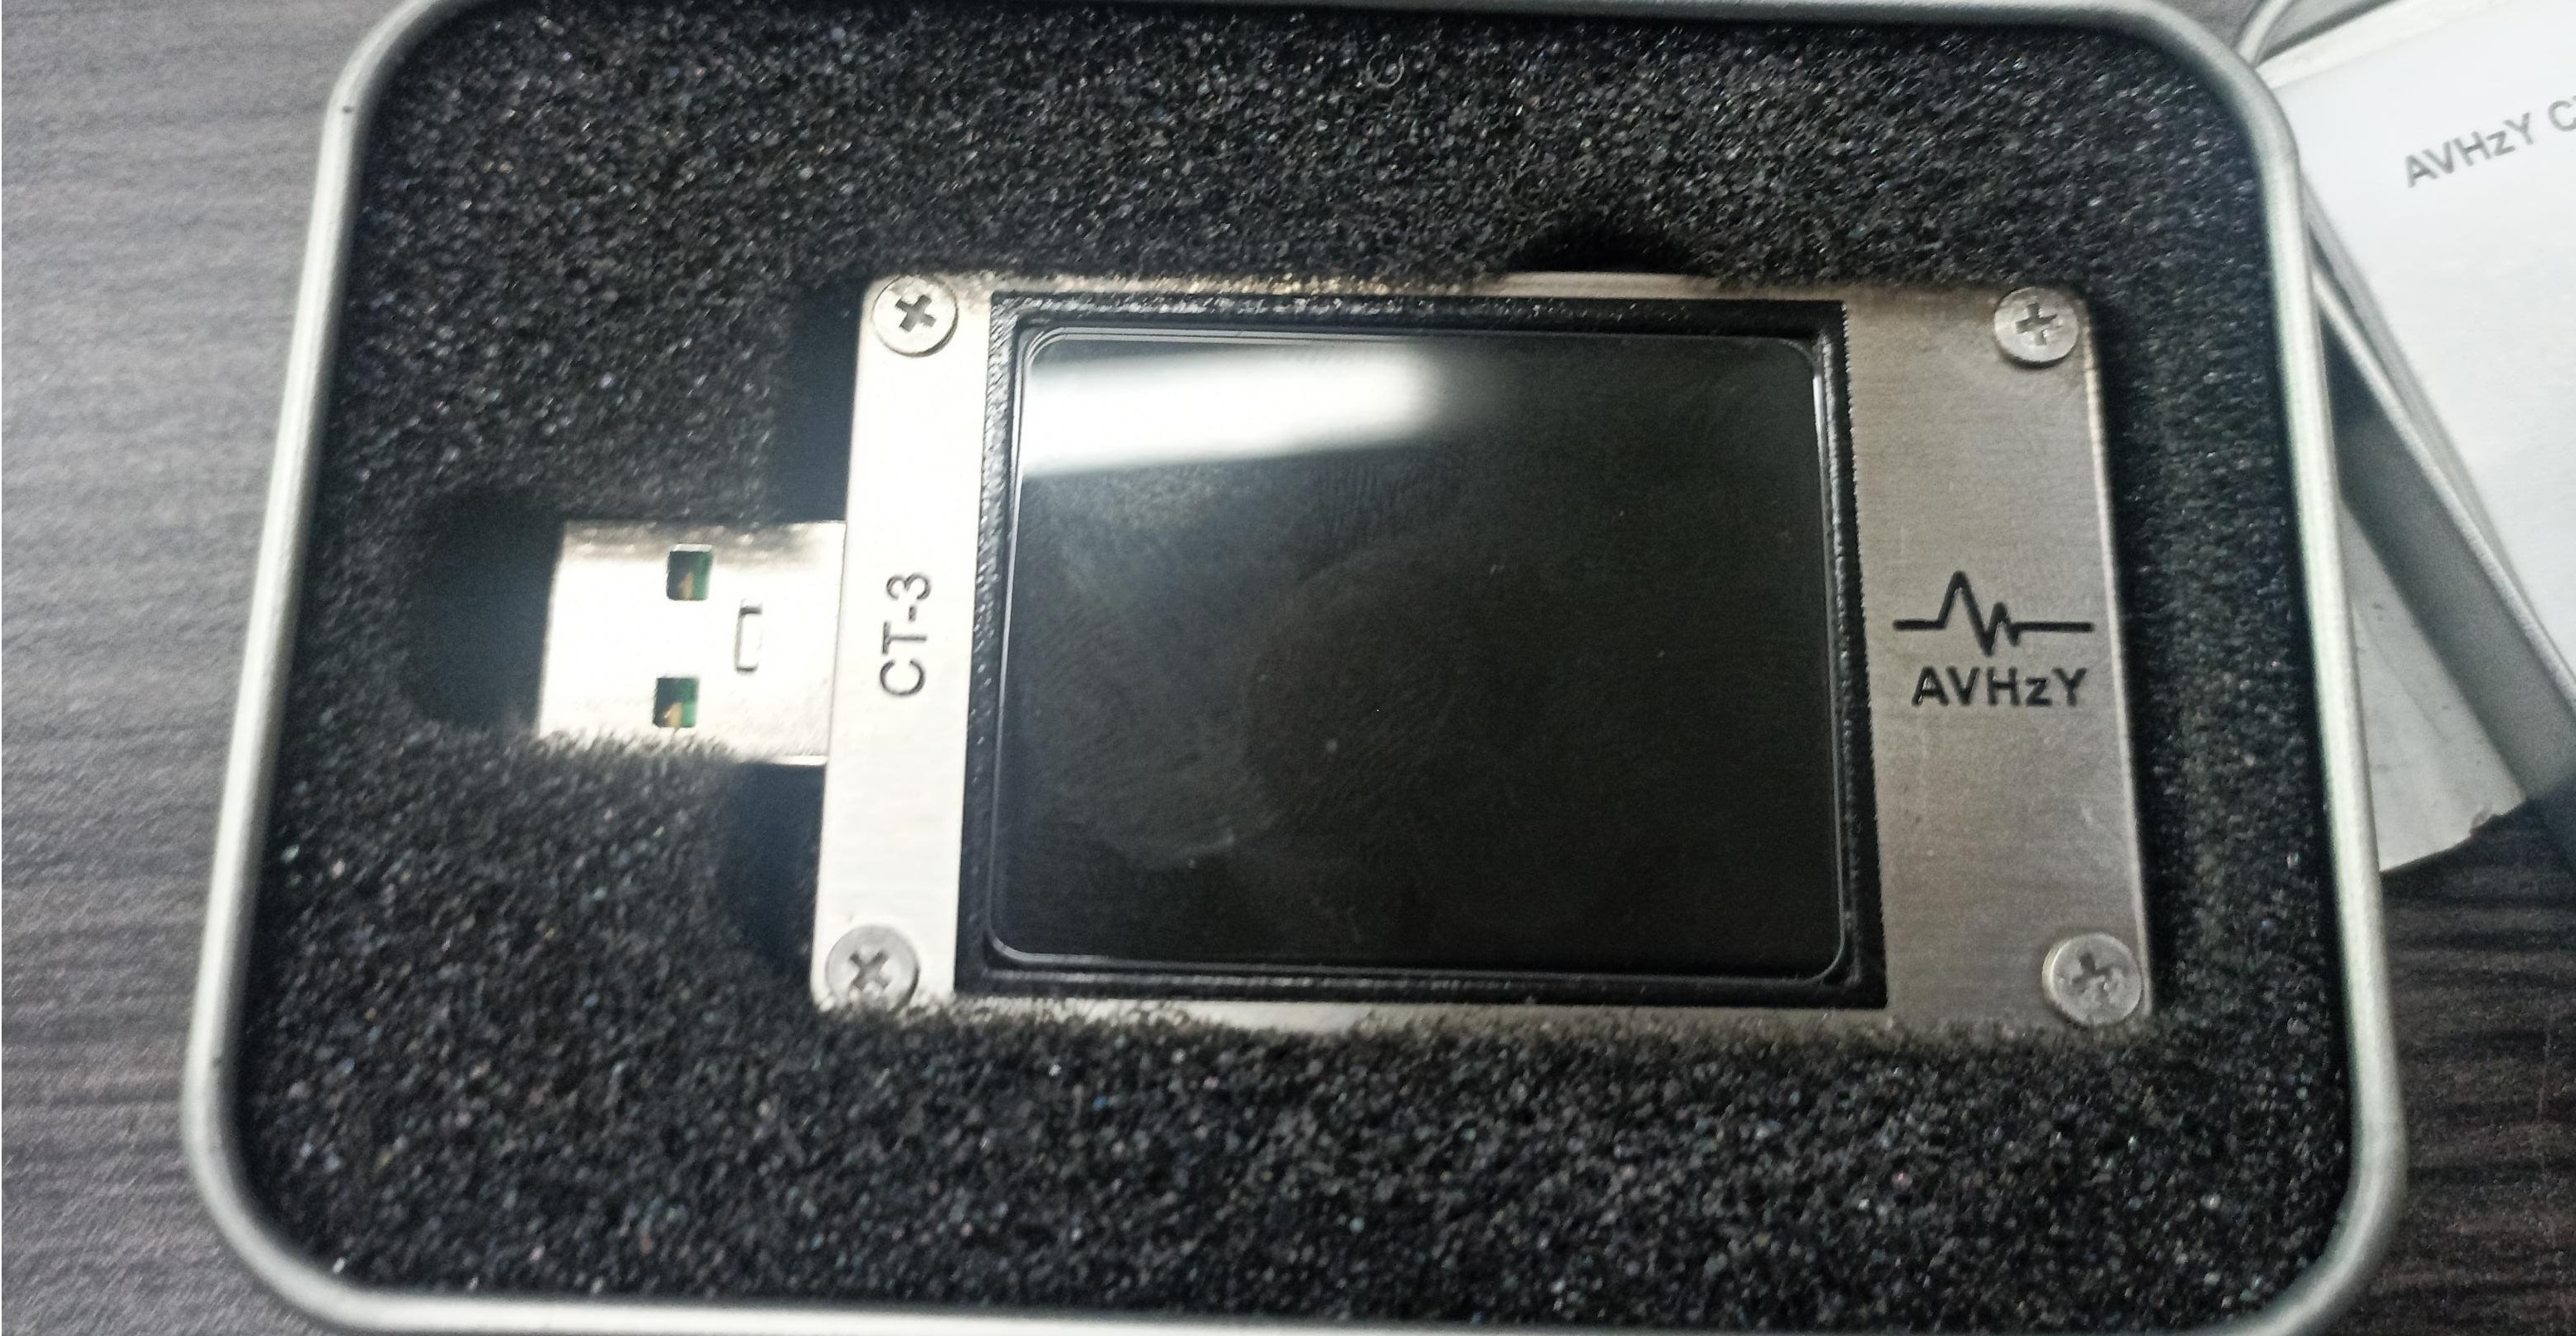
On the back, you can observe how current flows through the device. I used a USB-C to USB-C connection and added another cable on the output side.
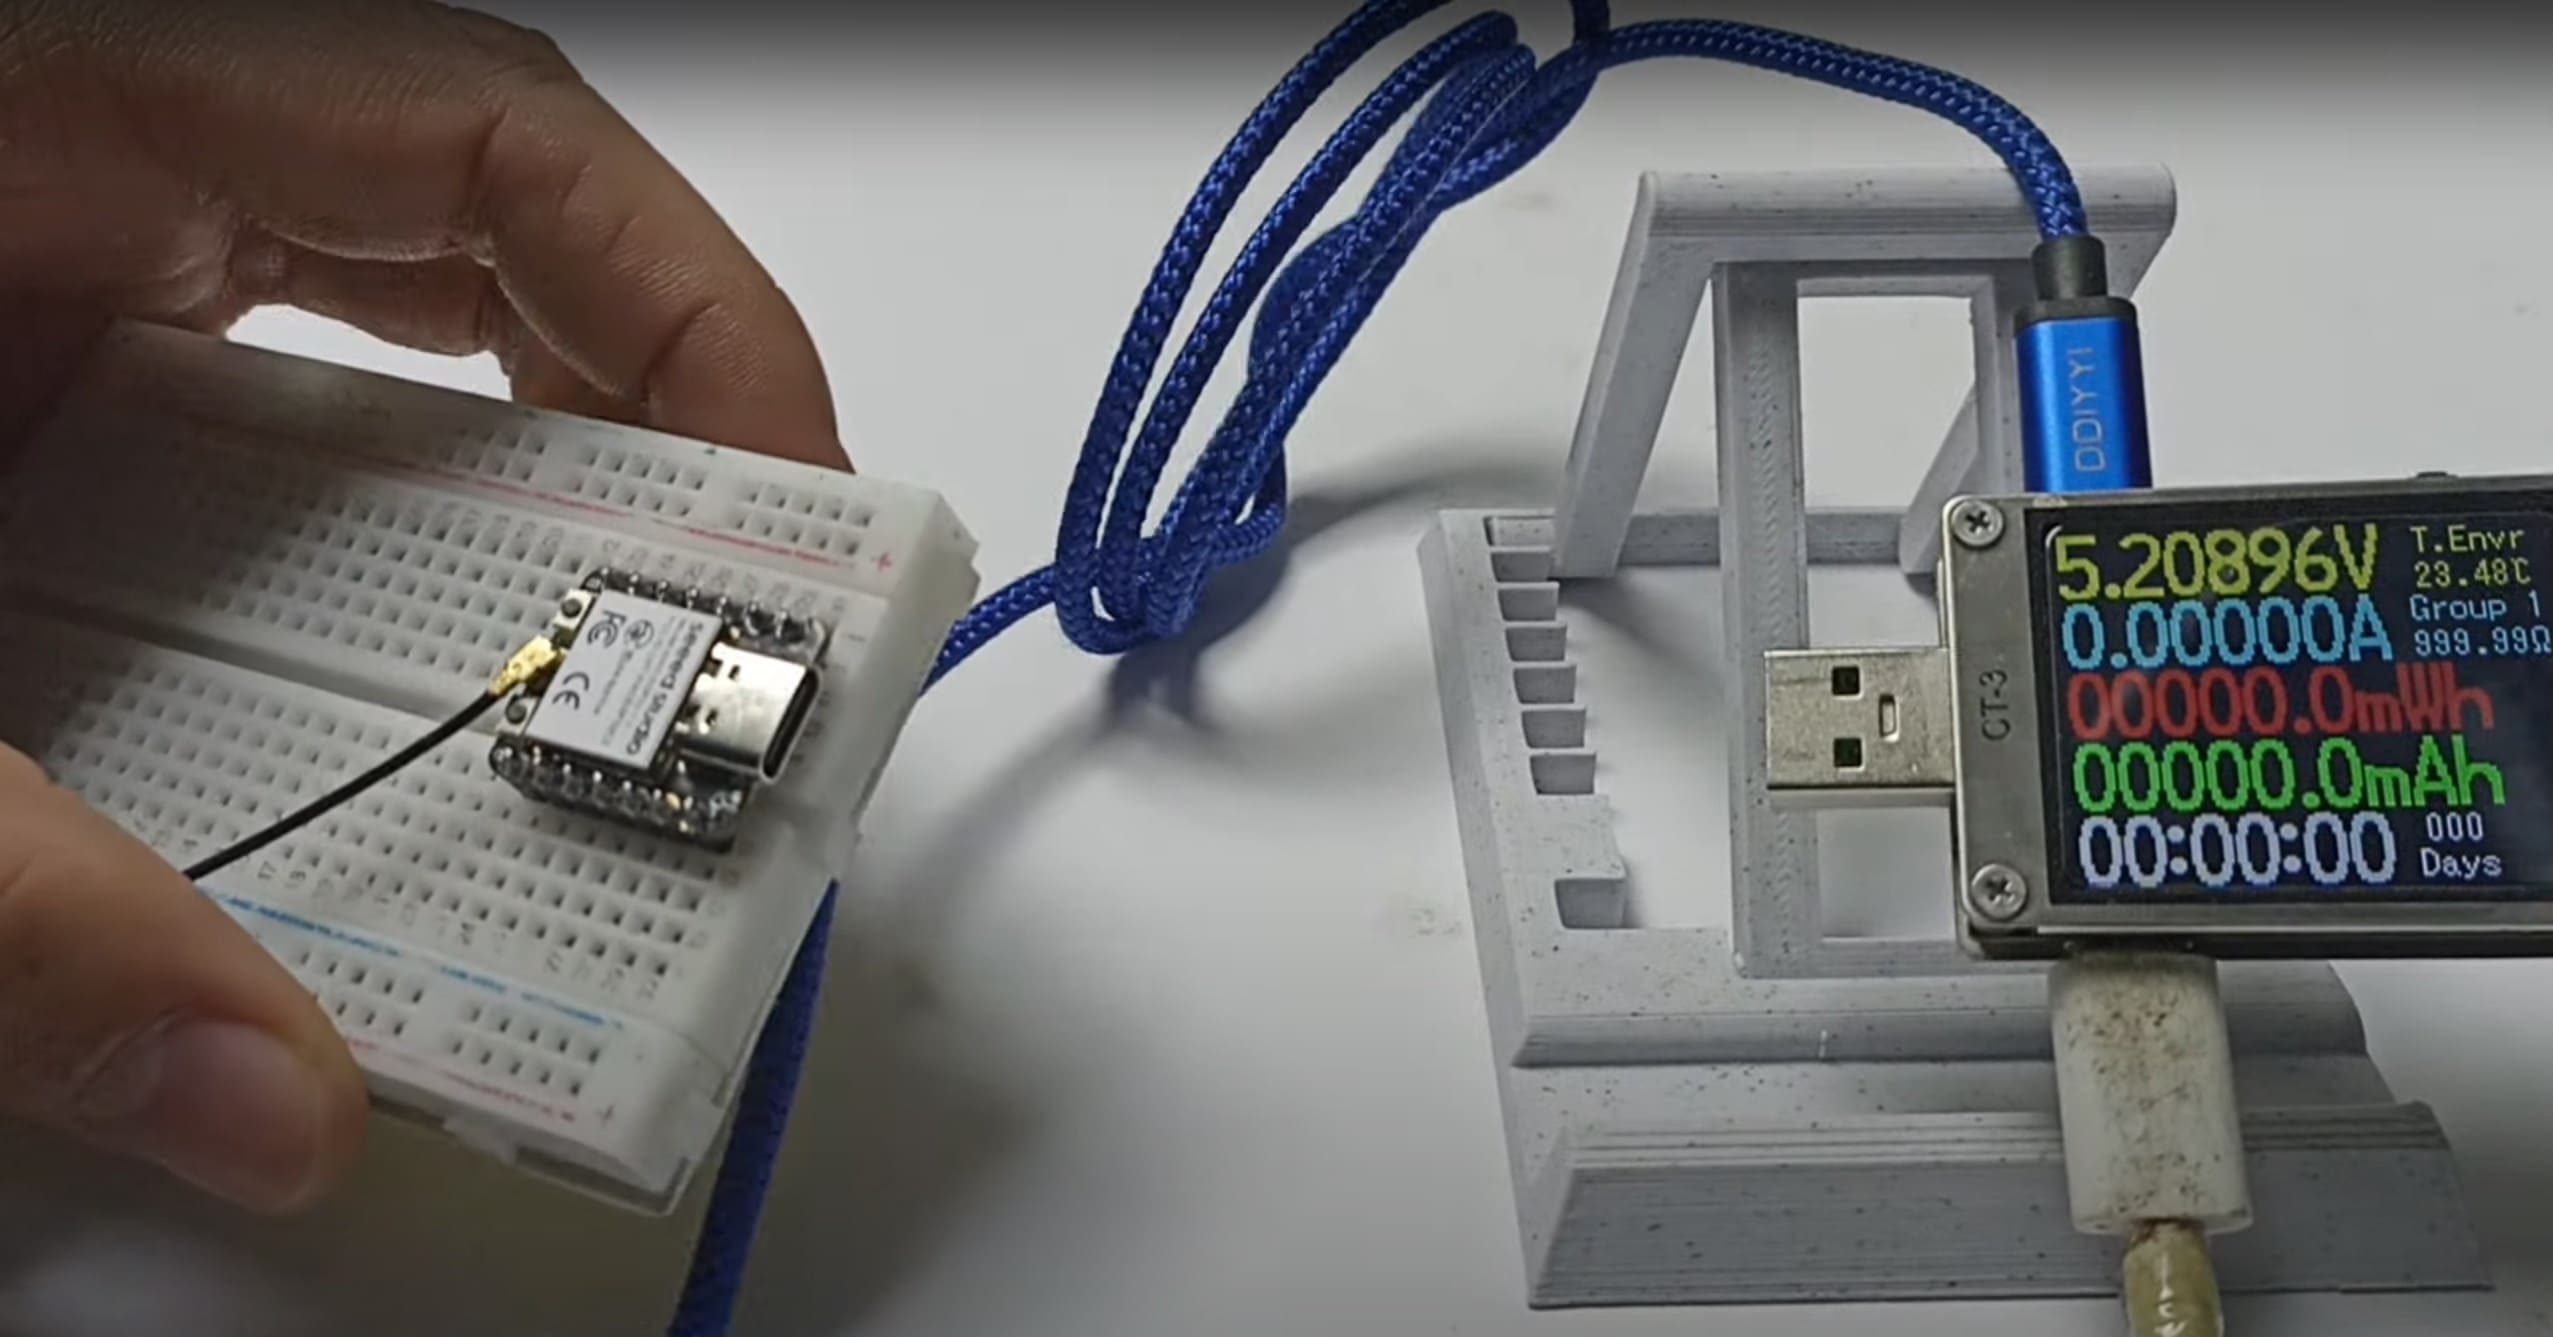
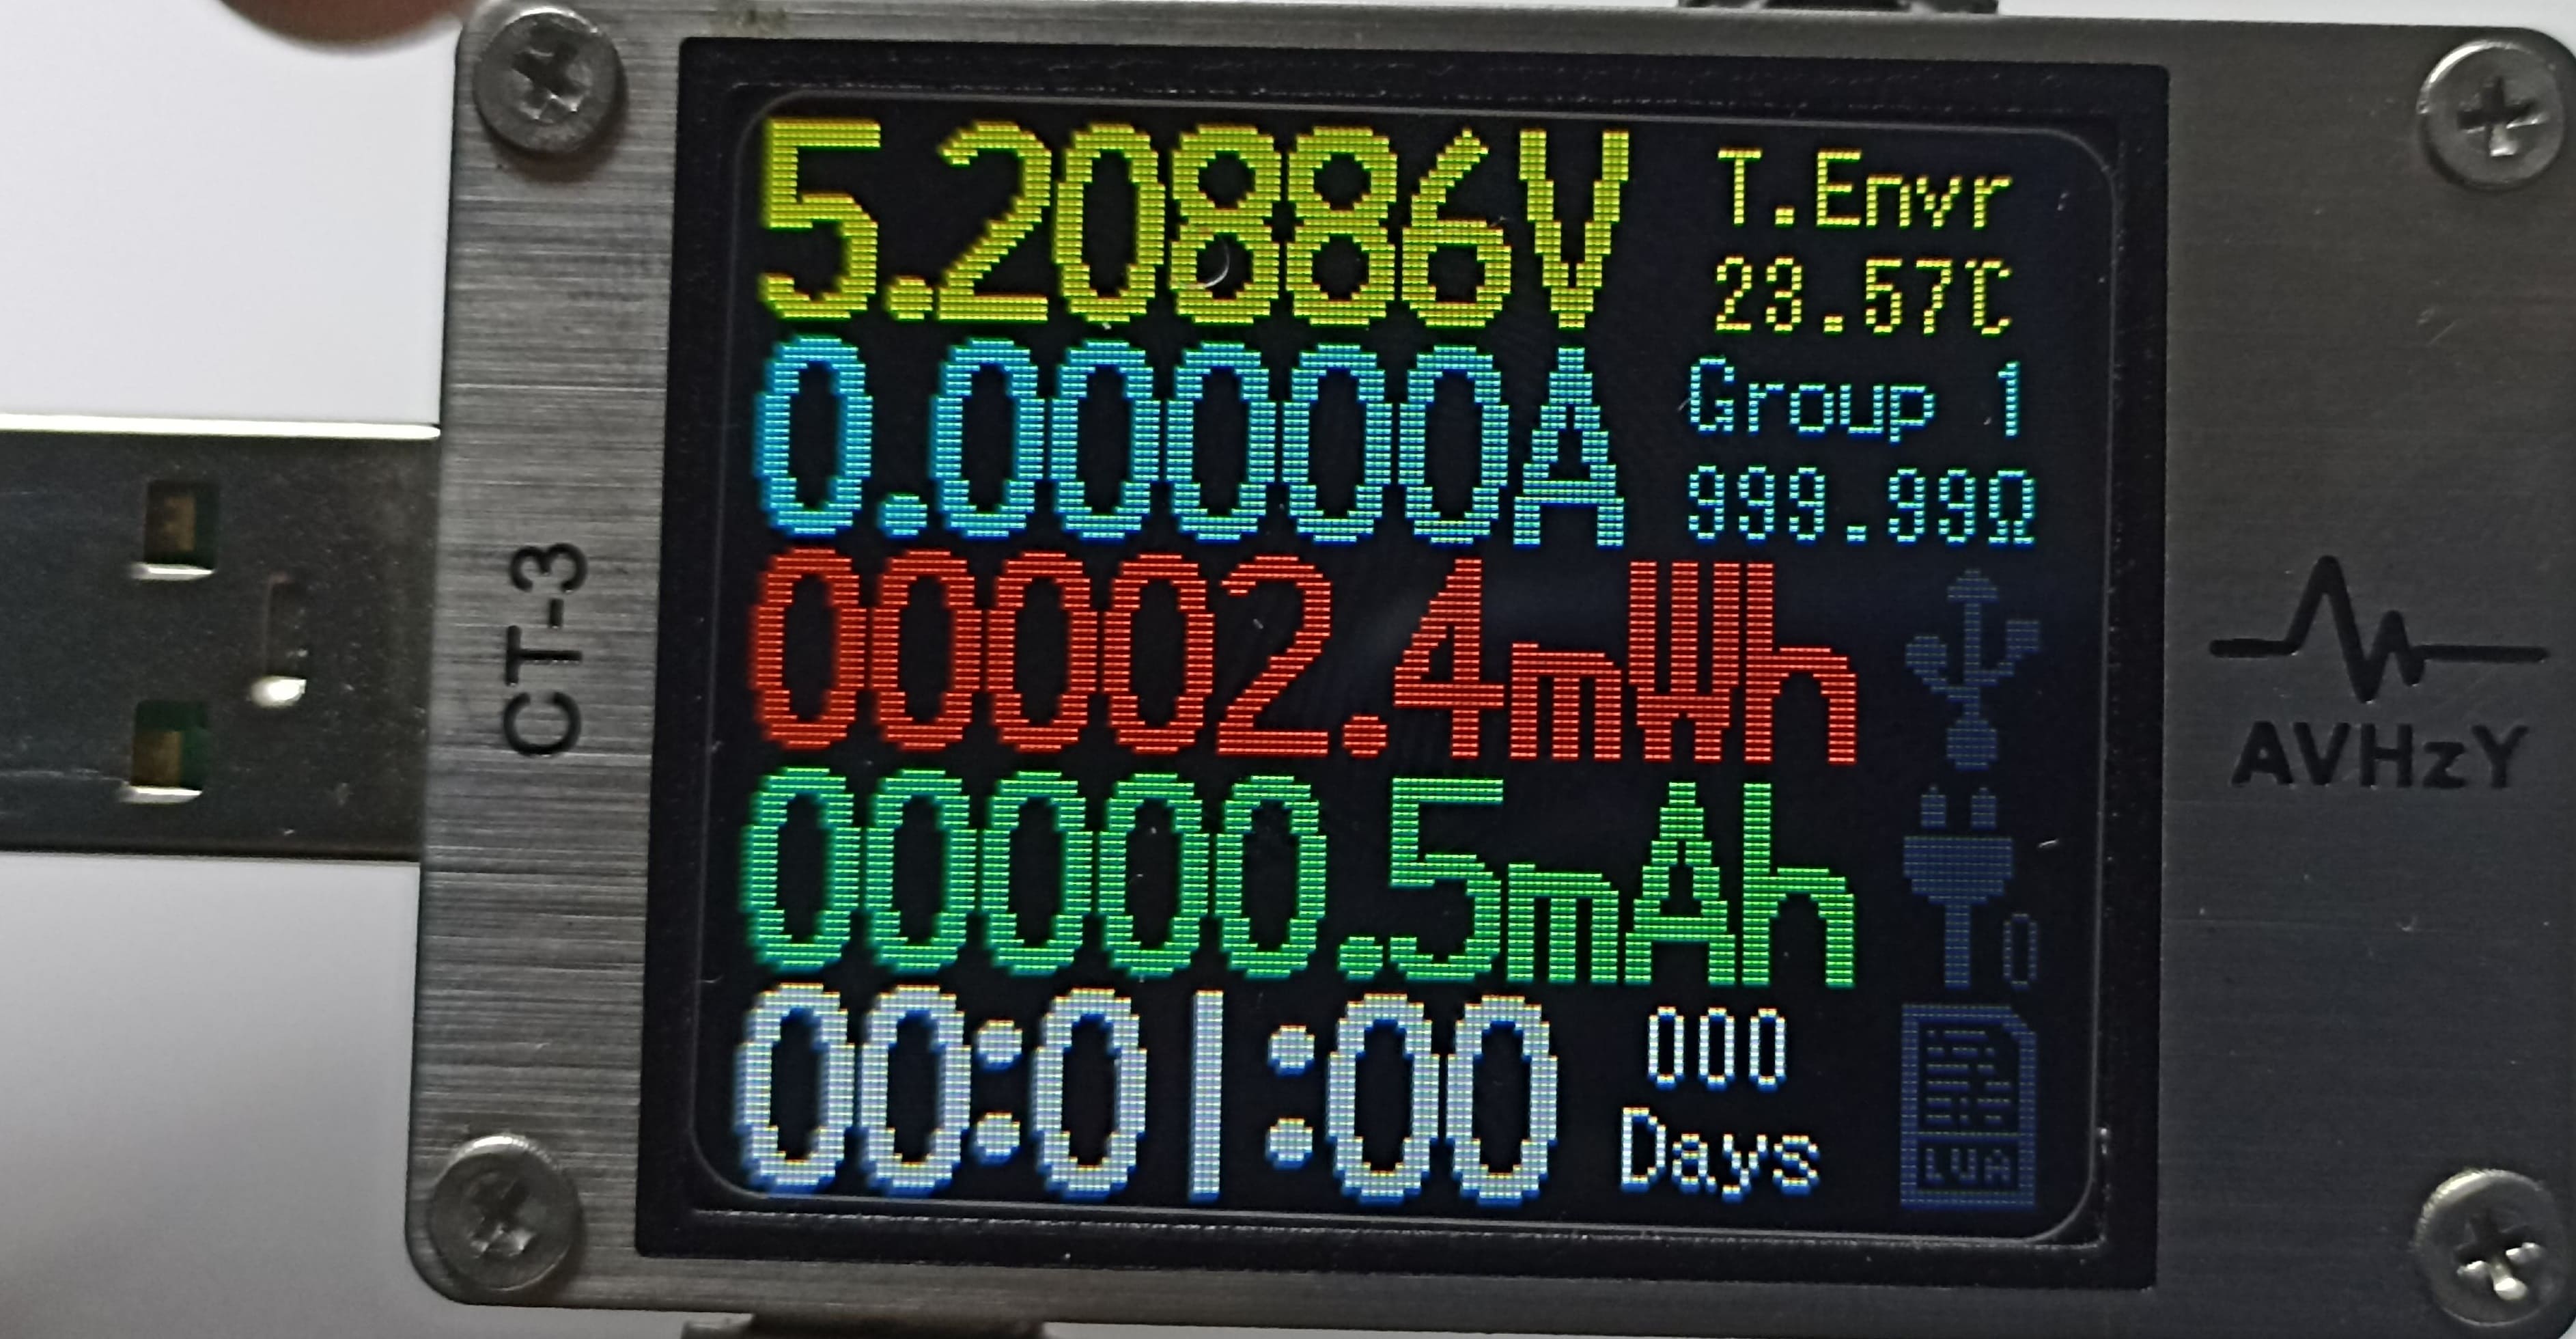
For the first test, I used my Xiao ESP-C3 board to measure its idle power consumption, connecting through its USB-C input port.
This device allows long-term measurements, accumulating total usage and elapsed time. After one minute, it had consumed only 00002.4 mAh.
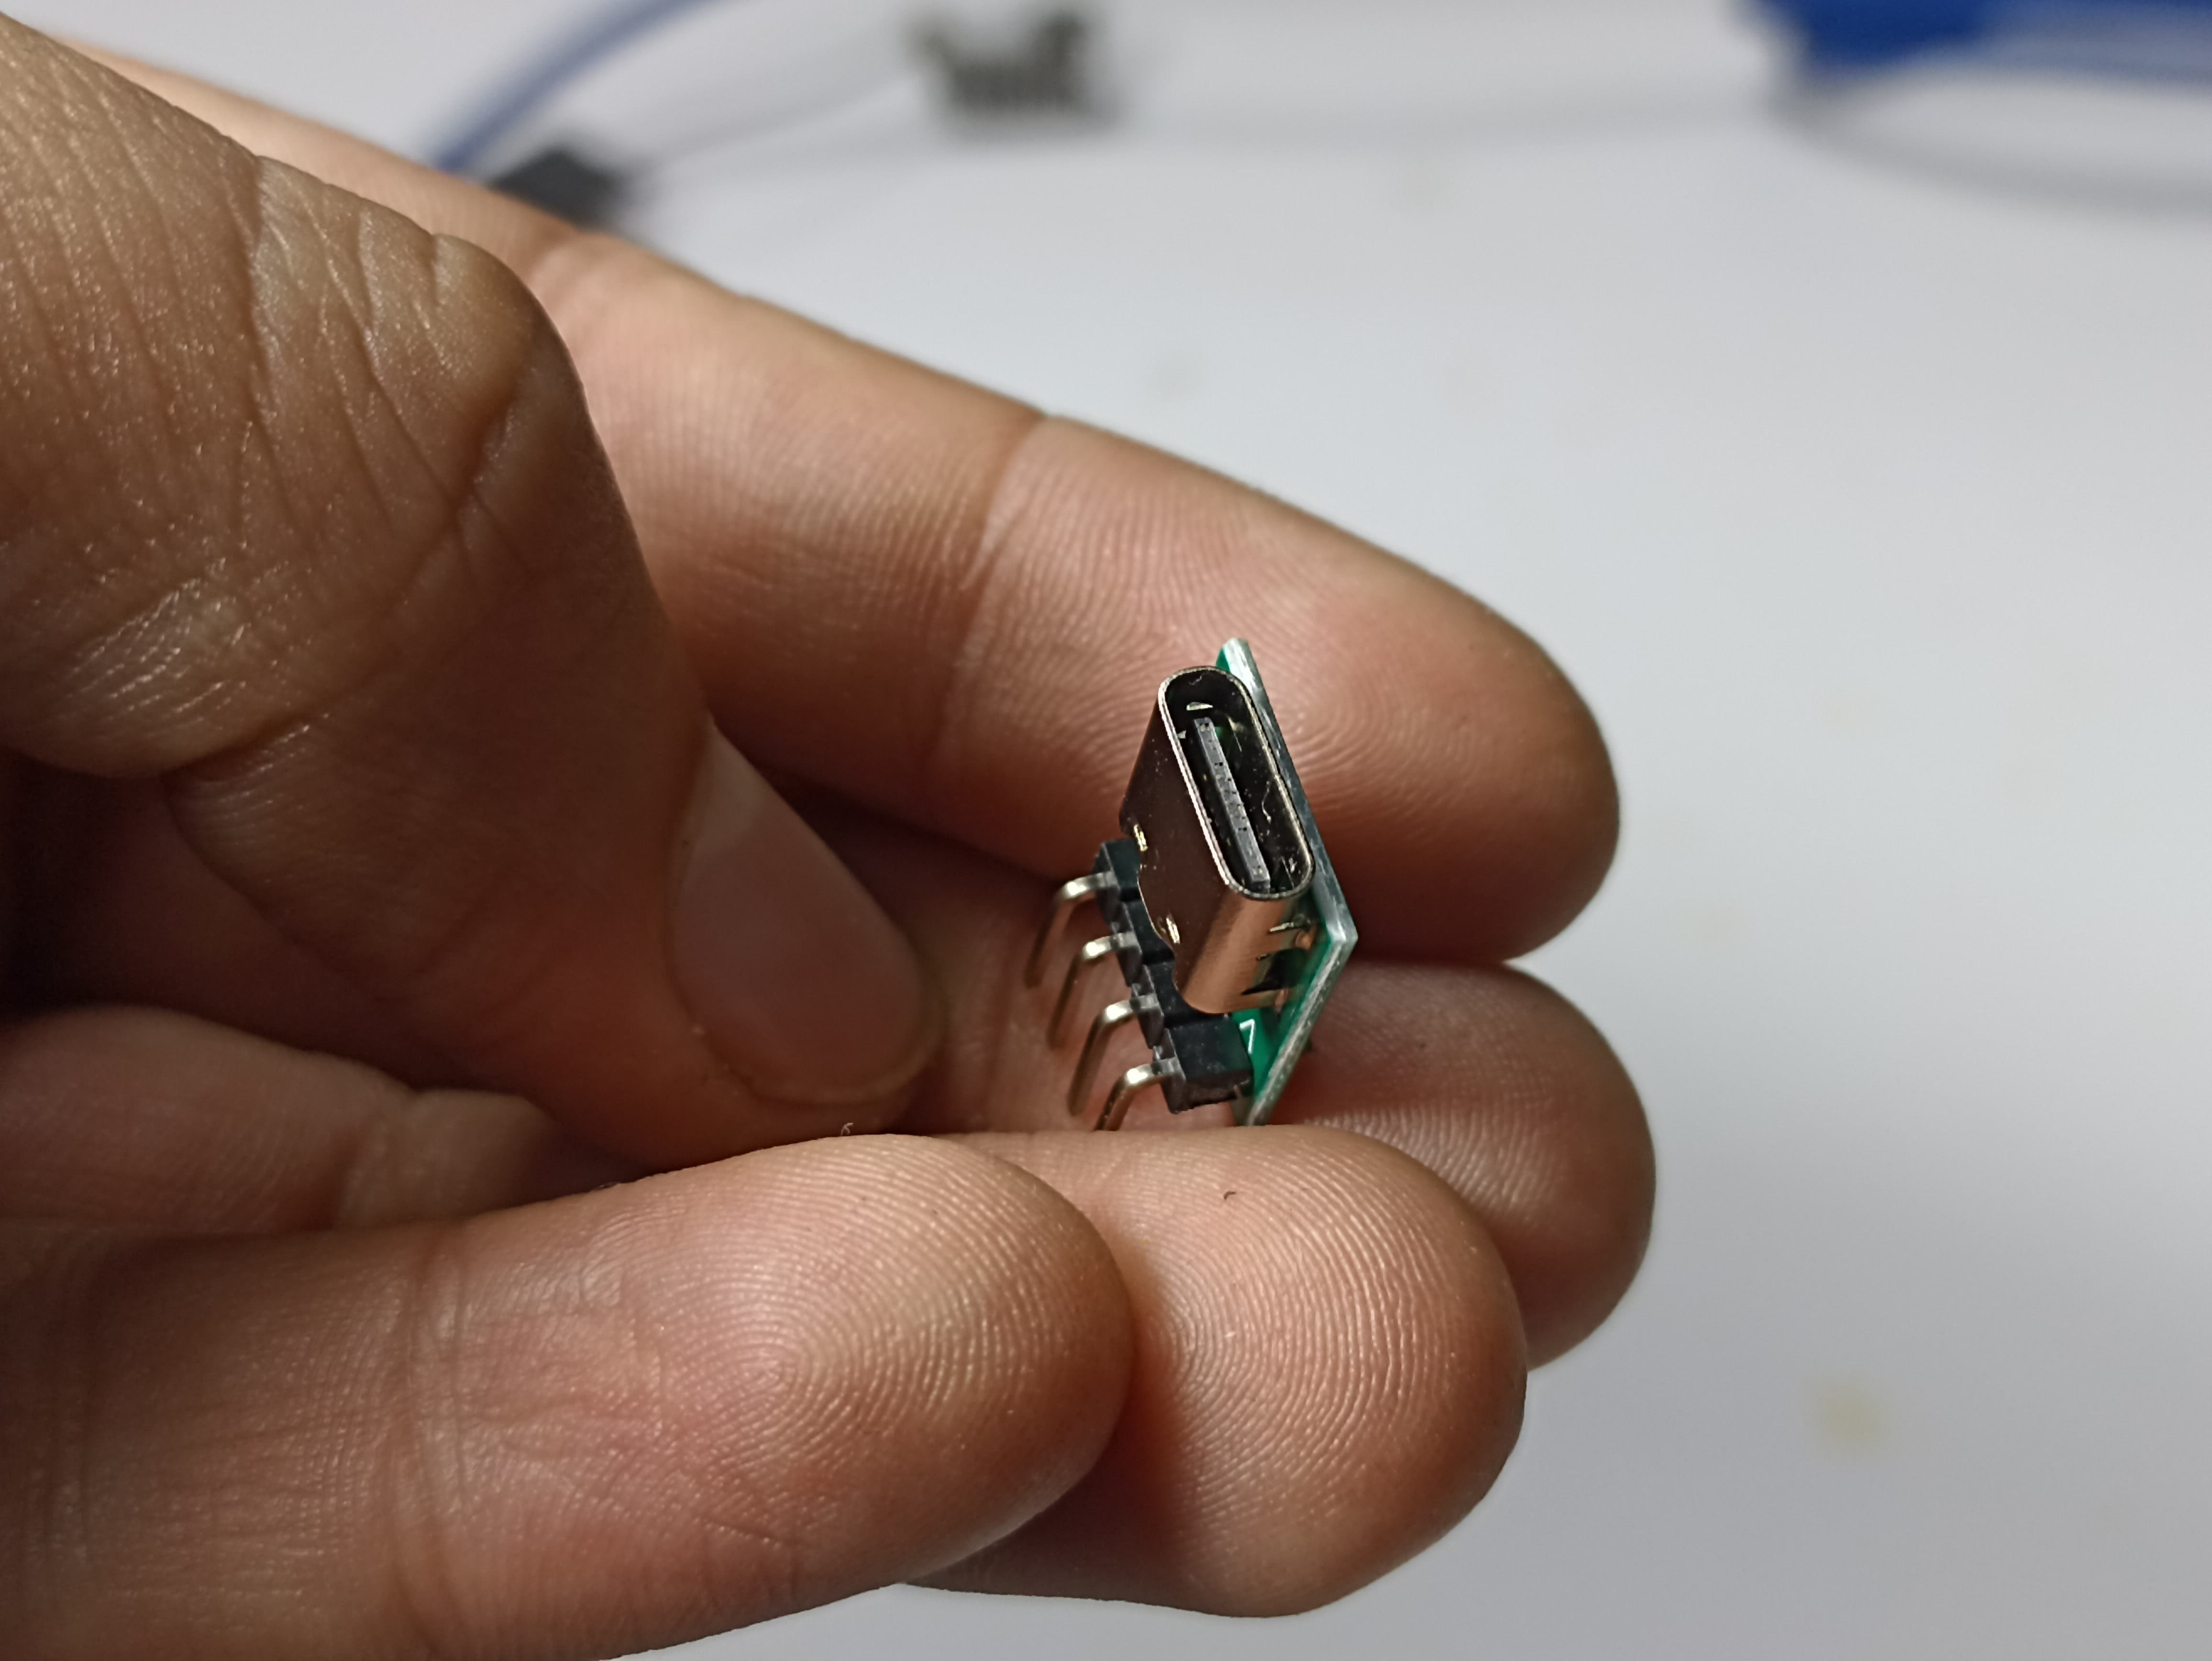
To measure individual components, I used a USB port with pin headers, allowing connection to a breadboard for future tests.
I conducted two tests with output components. I began with a motor mounted on a chassis I designed a year ago. I quickly connected one wire to the USB negative and the other to the positive output.
Initially, the current draw without friction was around 0.02625A. When applying friction or braking the motor, it spiked to 0.14–0.15A, showing that more force equals more consumption.
I repeated the process with all four motors. Initial consumption was around 0.16–0.17A, but when placed on a surface and generating friction, it peaked at 0.2A.
Before measuring, it’s important to clarify what each quantity means:
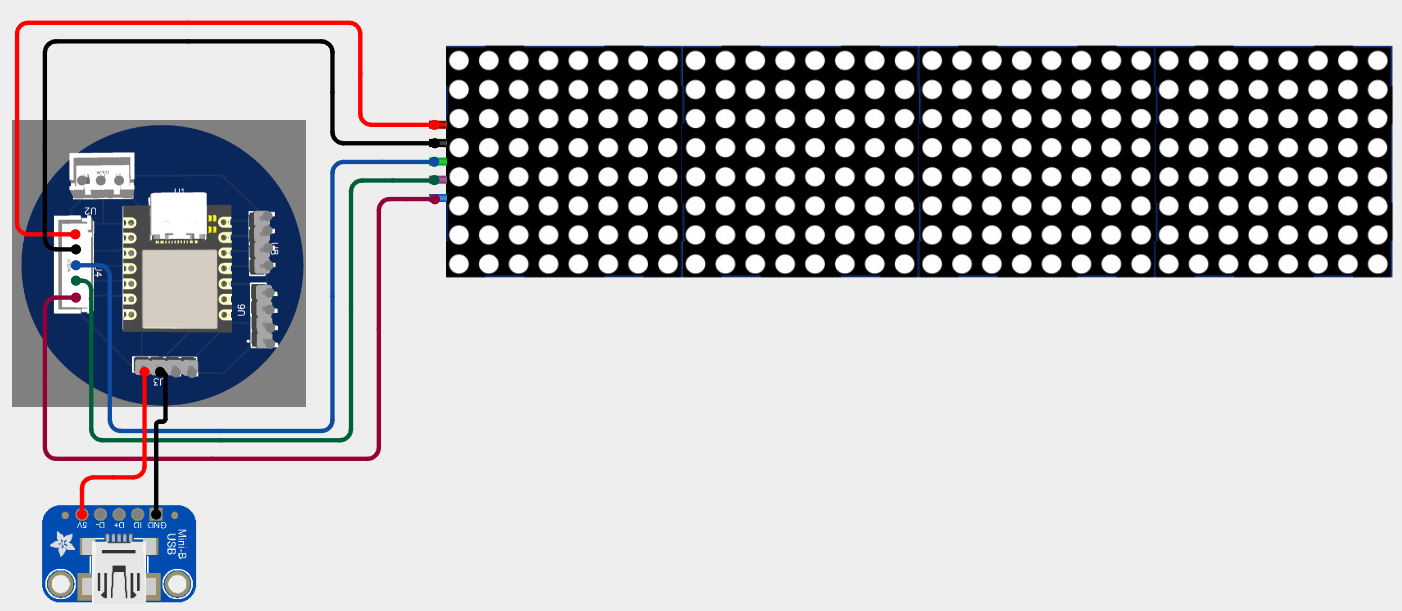
So, by measuring the voltage supplied to the LED matrix and the current it draws, we can directly calculate the power it consumes. This helps us understand if our power supply is suitable and also gives us insight into the energy efficiency of our project.
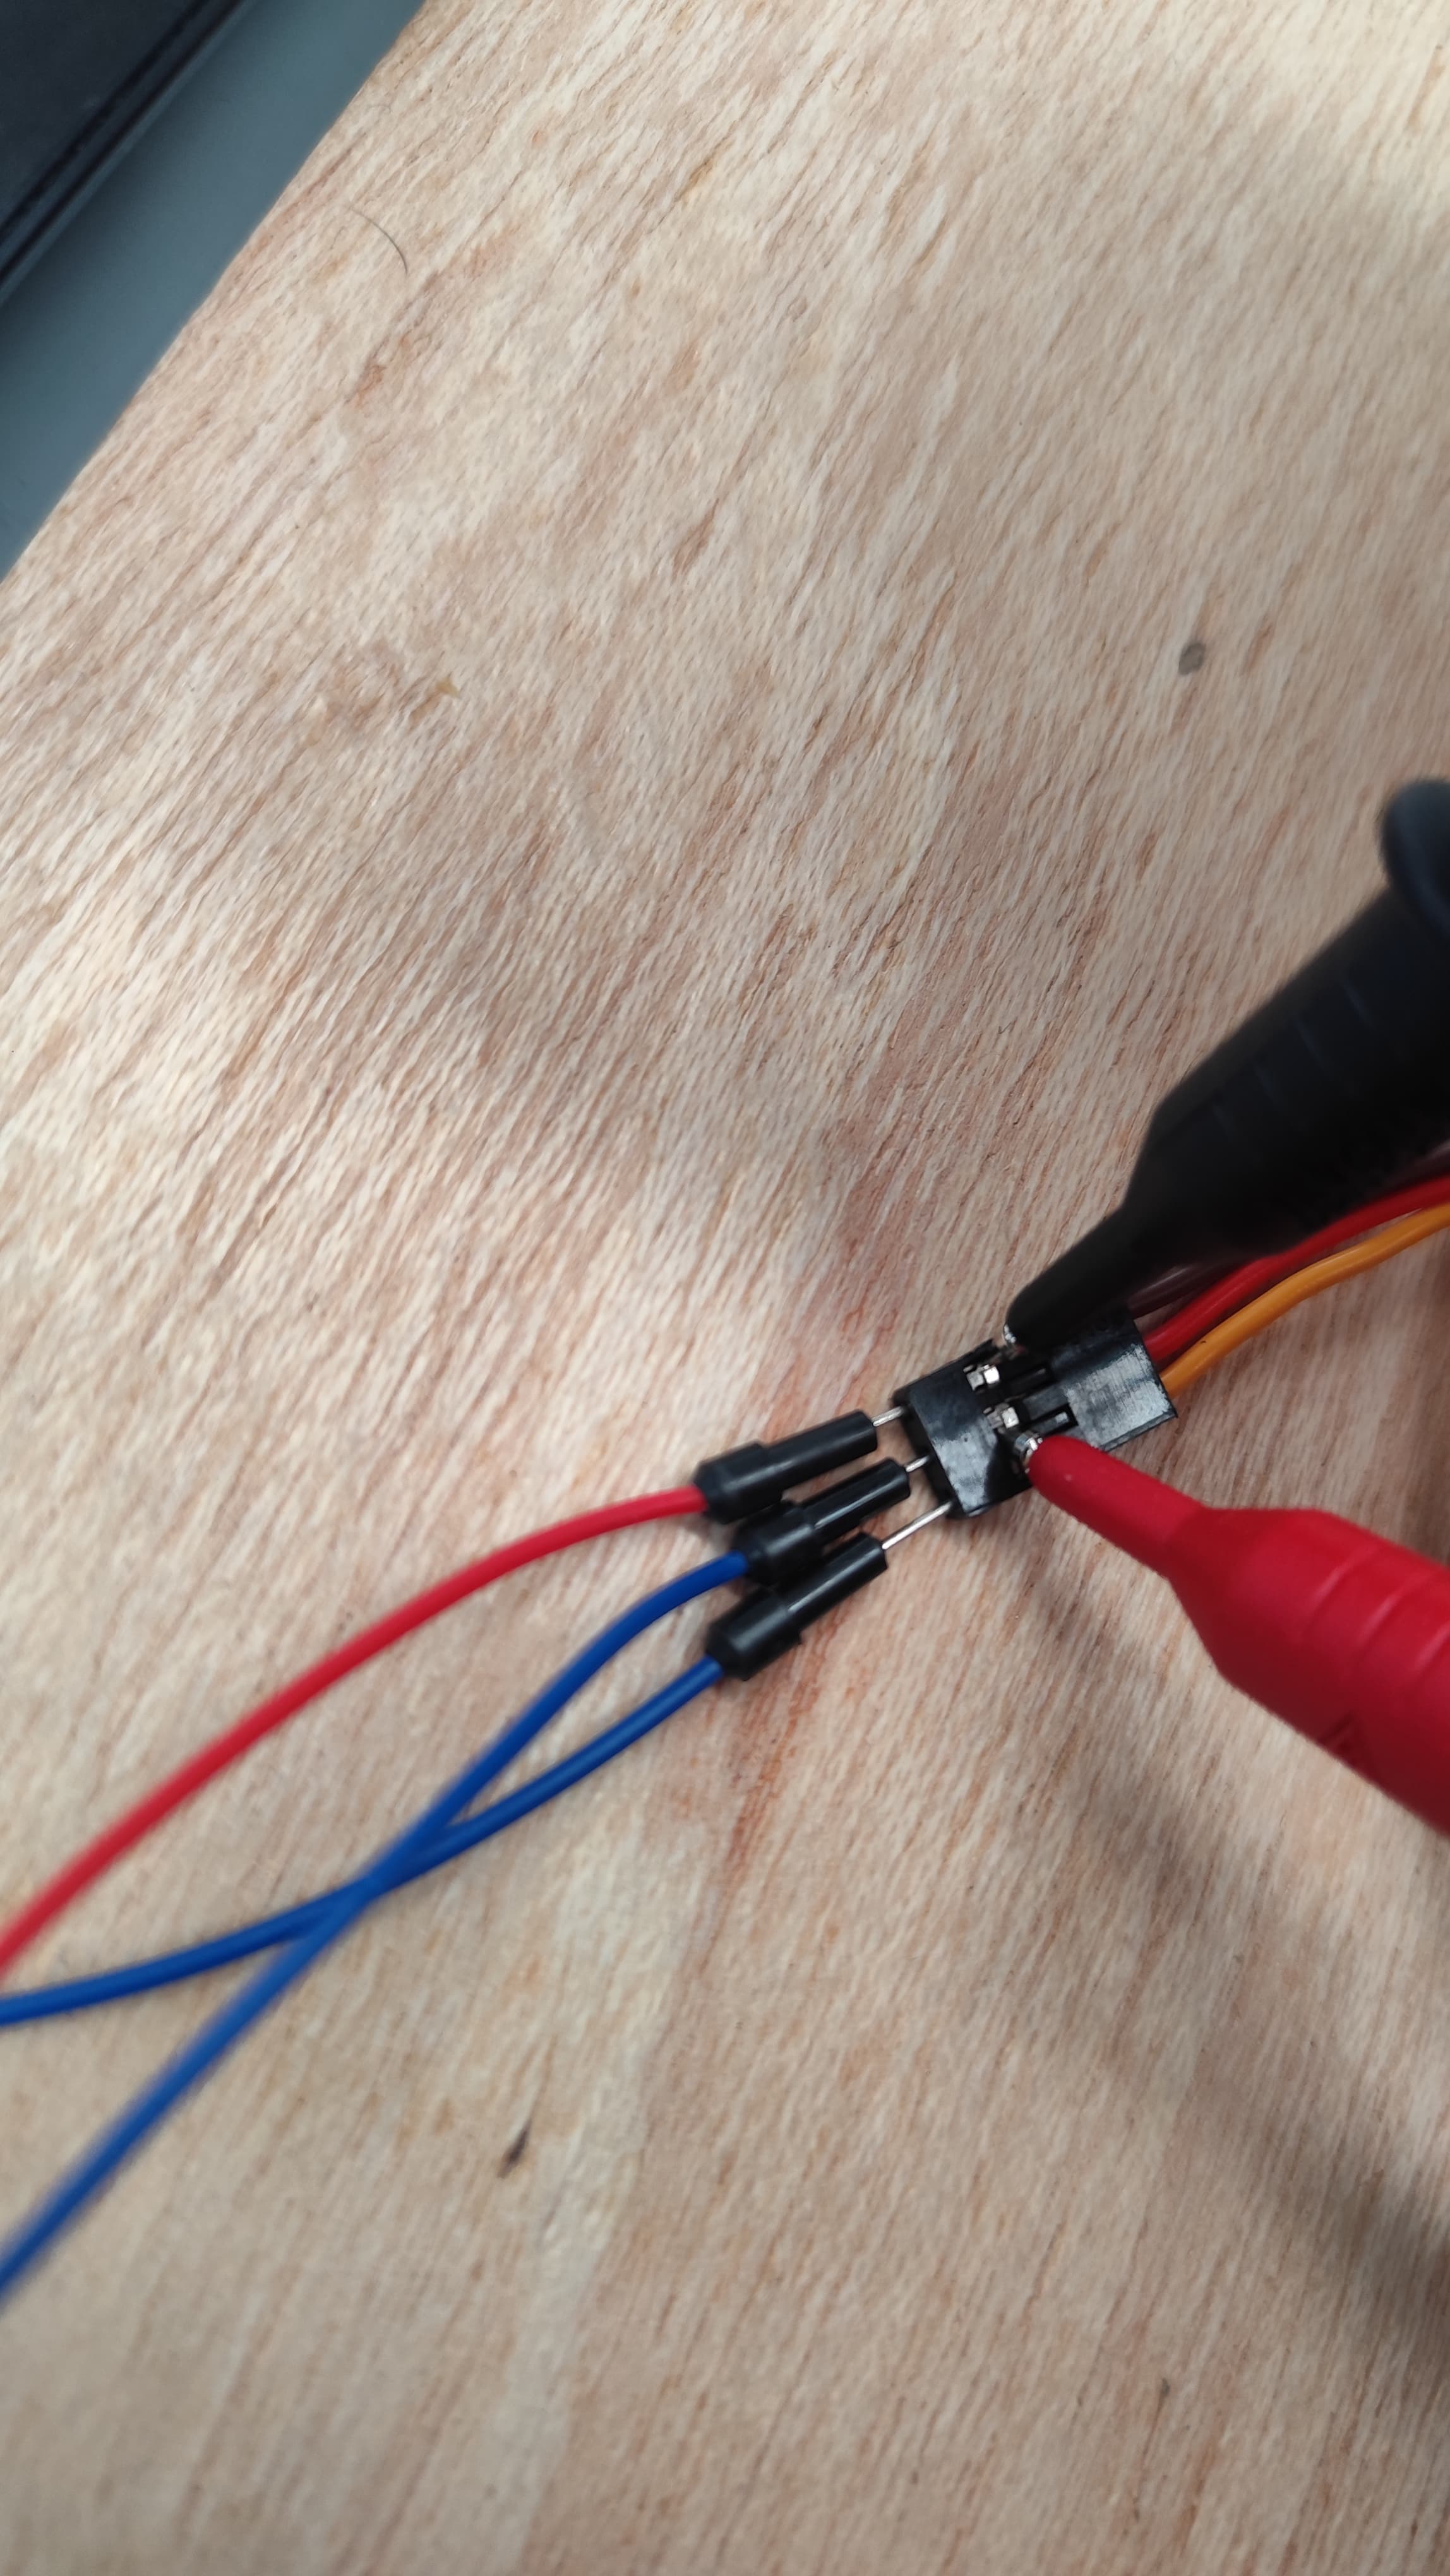
To measure the power consumption of both the board and the LED matrix, it’s necessary to interrupt their power supply. I used a USB Type-C to pin adapter, connecting the 5V and GND lines from the board through the adapter. This setup allowed me to “open” the power circuit and insert the multimeter for current measurement. By doing so, I could accurately monitor the total current drawn by the entire system during operation.
Power measurement setup using a USB Type-C to pin adapter to interrupt the supply.
With the board powered and the circuit ready, I used a digital multimeter in voltage mode to measure the supply voltage delivered to the system. The multimeter probes were placed across the 5V and GND lines to get an accurate reading of the actual voltage the board and LED matrix were receiving during normal operation.
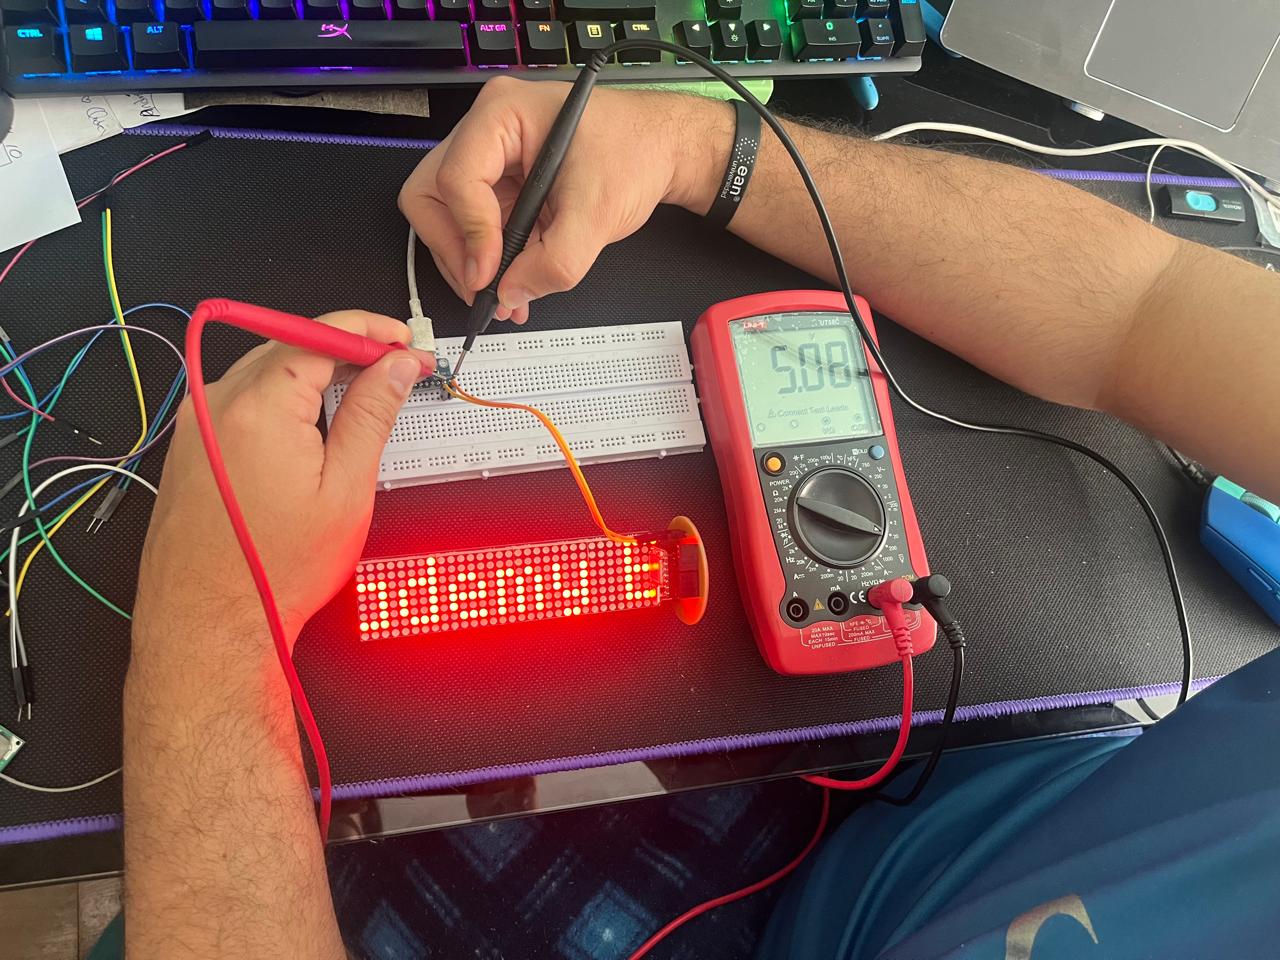
Digital multimeter measuring the supply voltage across the board and LED matrix.
The following video shows the step-by-step process of measuring the supply voltage with a digital multimeter. You can see how the probes are placed across the 5V and GND lines to obtain an accurate reading.
Video demonstration of voltage measurement using a digital multimeter.
The following video demonstrates how I measured the current consumed by the system. It's important to note that, since the LED matrix displays changing messages, the number of illuminated LEDs varies, which causes the current draw to fluctuate. For this reason, I observed and recorded a typical operating range rather than a single value. During my tests, the current consumption ranged from 66 mA up to 172 mA, depending on the pattern displayed.
Video showing the process of current measurement and illustrating how it changes with different LED patterns.
Using the measured supply voltage of 5.08 V and the observed current range between 66 mA and 172 mA, I calculated the minimum, maximum, and average power consumption of the board and LED matrix using the formula P = V × I:
Conclusion:
The LED matrix and board combination is highly efficient, with average power usage well below 1 watt
even when displaying dynamic messages. This confirms that the setup is suitable for battery-powered
or low-energy applications.
In this task, we focused on measuring how much electrical power is consumed by an output device—specifically a DC motor—during different stages of operation.
To analyze power usage, it is important to understand the key electrical parameters involved:
The equation used to determine power consumption is:
Power = Voltage × Current
To perform these measurements, a digital multimeter will be used. This tool allows for precise monitoring of the electrical parameters involved, such as the voltage (V) across the output device and the current (A) flowing through the circuit. By capturing these values in real time during different operating conditions of the output device, the device can be used to measure the voltage.
For this exercise, we will use a 6V TT-type DC geared motor, commonly used in basic robotics projects. This motor features a plastic gearbox that increases torque and reduces output speed. During the experiment, the motor's current consumption will be measured under different operating conditions: no load and with load. To do this, a multimeter connected in series with the power supply will be used to record the consumption in milliamps (mA).

On the left, the motor is shown without a load connected, ideal for measuring minimum current consumption. On the right, the motor with a wheel attached, used to measure current consumption with a load.
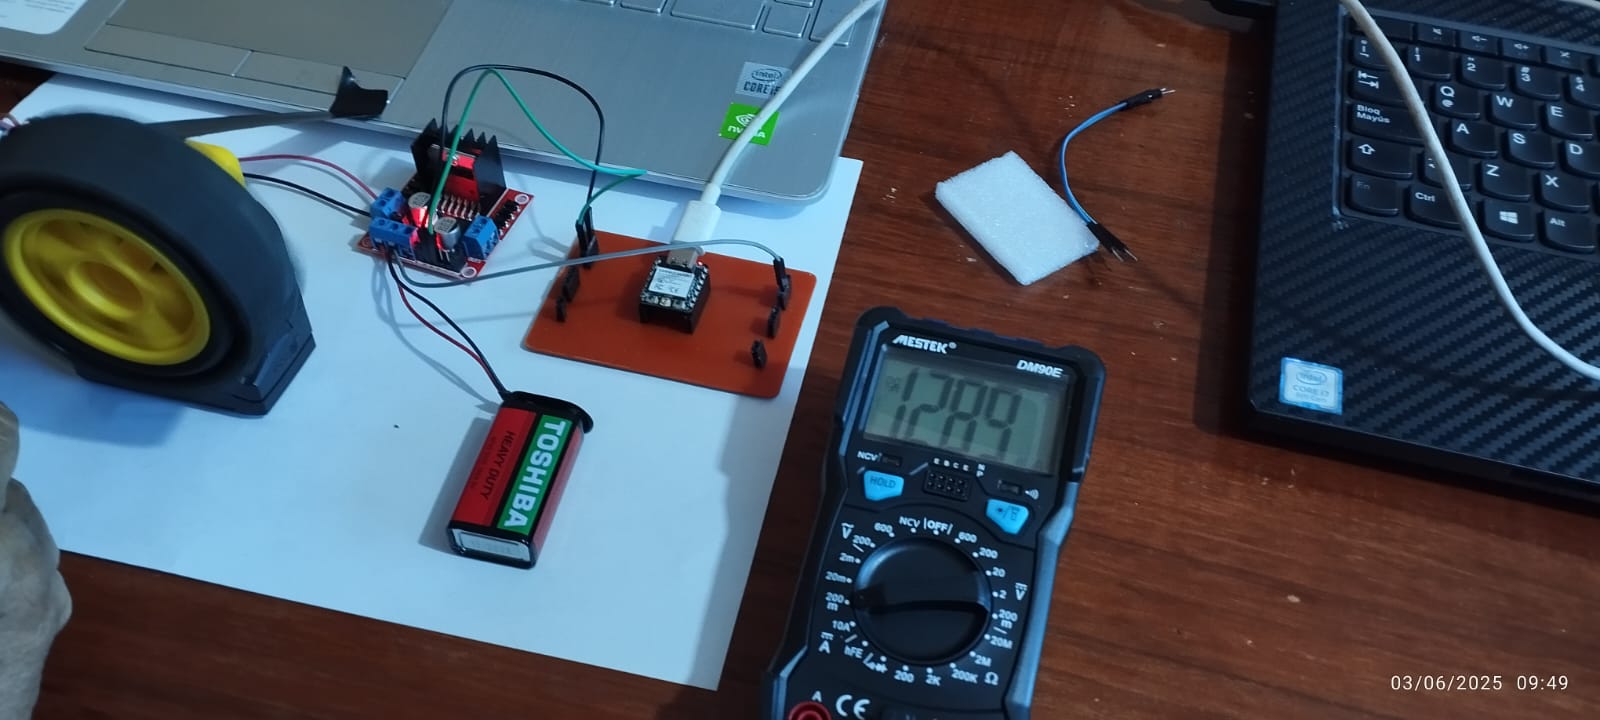
The current of the 6V TT DC geared motor was measured with a coupled wheel (mechanical load condition). The motor was powered by a 6V DC source, and the multimeter was connected in series to record the current consumption.
Current measured with load: 128 mA. This value is within the expected range for this type of motor, indicating normal operation under moderate load.
The video shows the current consumption of a 6V DC motor under load (one wheel attached) measured using a series multimeter. The motor, powered by a driver and a 9V battery, draws 128 mA under load.
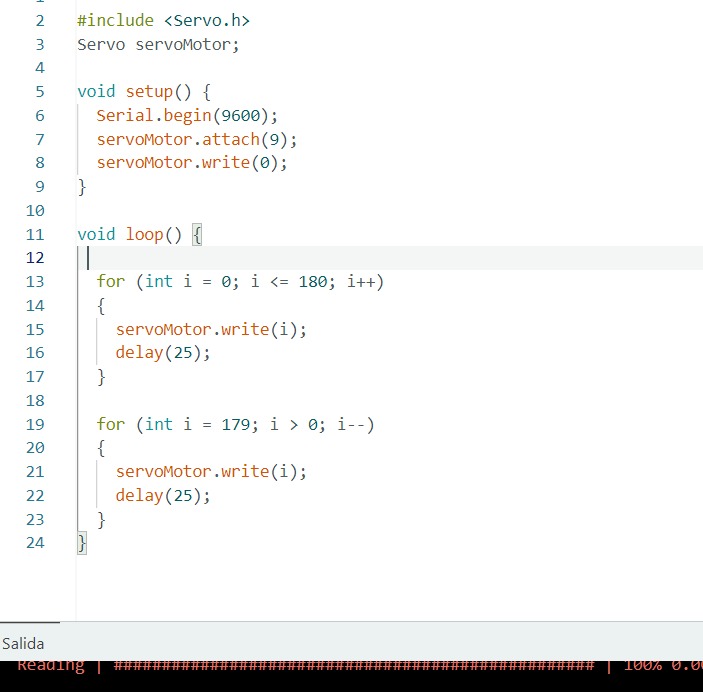
For this assignment, we selected a servo motor model MZ996. This type of servo is commonly used in electronic projects due to its metal gears, which offer better resistance and durability during mechanical movements.
The servo motor has three wires:
The servo is controlled using a PWM signal and operates at 5V DC.

A basic program was uploaded to the development board to rotate the servo motor periodically.
To measure the power consumption:
A digital multimeter was used to capture the voltage and current values during the operation of the servo.
Since the servo was not under load (not moving any external weight), the current consumption remained low and stable.
The measurement of power consumption showed that: