Week 14: Interface & Application Programming
Table of Contents
This week introduced user interfaces. The task was to write a graphical output or input for an a device we made earlier. I did not plan to use any GUI for my final project, so I used the week to try out some things. I set up an example visualization to display the output of a sensor I made using Tkinter. Additionally, I learned Pure Data and connected it with Blender via OSC using the plugin NodeOSC.
This Week’s Tasks
- Group assignment:
- Compare as many tool options as possible.
- Document your work on the group work page and reflect on your individual page what you learned.
- Individual assignment
- Write an application for the embedded board that you made that interfaces a user with an input and/or output device(s).
Selected Tools for Interfacing
For the group assignment we agreed that each one does some research about the tools they are mostly interested in. The work of us all is assembled on the group page.
Interfacing Python Scripts
A common use case for a graphical interface is if one quickly wants to deploy a prototype to show to other people. If this prototype includes python code in some form, it can be possible to use GUI libraries for python. Tkinter can be used to define shapes, buttons, etc. on a canvas and animate those however needed. Streamlit can be used easily define simple user interfaces that run (also locally) as a web server. It is nice for prototypes one wants to demonstrate to people. If a CLI is what one needs, Typer is good to use. It is convenient to use, because it generates a CLI based on given functions and their arguments. Very less code is necessary for defining a CLI with this tool.
(Node-Based) Tools for Interactive Installations
When it comes to create interactive installations, it might be practical to have node-based frameworks that take some signal (video, image, sound) and transform it based on camera, microphone or other sensor inputs. Closely related is software for video artwork. Famous for professional use are Resolume as well as TouchDesigner. However, there also are open-source alternatives. Pure Data is low-level and to be used for signal processing tasks, for example sound synthesis. It also can be used to interact with the environment via OSC, UART, etc. Using the plugin Gem enables working with graphical media. Ossia Score, primarily a video sequencer can be used for node-based interactive image and video processing as well. All named frameworks can be connected with MIDI controller devices for a more convenient use. For projection mapping, I found the tool Splash. Blender can be used as well. In this video tutorial it is explained how to use the plugin fspy for that purpose.
Visualizing Sensor Values With Tkinter
This week, I visualized the output values of the magnetometer which I used in week 9. There was an example for that given in the lecture including code to flash onto the on-board ATTiny412 as well as a python script for visualization. The given arduino sketch basically reads the sensor values and puts them out via serial port. The python script running on a PC reads the values coming from the serial port and visualizes them by drawing shapes on a Tkinter canvas.
I then adjusted the given script. First, I removed the parts of the code regarding the specific way of visualization ending up with the following skeleton.
 1#!/usr/bin/env python3
 2from tkinter import *
 3import serial,sys
 4
 5window = 600 # window size
 6xf = yf = zf = 0 # filtered values
 7eps = 0.1 # filter fraction
 8
 9# idle routine
10def idle(parent,canvas):
11   global xf,yf,zf
12   byte2 = 0
13   byte3 = 0
14   byte4 = 0
15   ser.flush()
16   while 1:
17
18      # find framing
19      byte1 = byte2
20      byte2 = byte3
21      byte3 = byte4
22      byte4 = ord(ser.read())
23      if ((byte1 == 1) & (byte2 == 2) & (byte3 == 3) & (byte4 == 4)):
24         break
25
26   # read data
27   v0 = ord(ser.read())
28   v1 = ord(ser.read())
29   v2 = ord(ser.read())
30   v3 = ord(ser.read())
31   v4 = ord(ser.read())
32   v5 = ord(ser.read())
33   x = (v0 << 4)+((v4 & 0xF0) >> 4)
34   y = (v1 << 4)+(v4 & 0x0F)
35   z = (v2 << 4)+(v5 & 0x0F)
36   if (x > 2047):
37      x = x-4096
38   if (y > 2047):
39      y = y-4096
40   if (z > 2047):
41      z = z-4096
42   xf = (1-eps)*xf+eps*x
43   yf = (1-eps)*yf+eps*y
44   zf = (1-eps)*zf+eps*z
45
46   # update canvas (set dimensions of rectangle)
47   #canvas.coords...
48   canvas.update()
49
50   # call idle
51   parent.after_idle(idle,parent,canvas)
52
53#  check command line arguments
54if (len(sys.argv) != 2):
55   print("command line: hello.TLE493D.t412.py serial_port")
56   sys.exit()
57port = sys.argv[1]
58
59# open serial port
60ser = serial.Serial(port,115200)
61ser.setDTR()
62
63# set up GUI
64root = Tk()
65root.title('hello.TLE493D.t412.py (q to exit)')
66root.bind('q','exit')
67canvas = Canvas(root,width=window,height=window,background='white')
68
69# ..initialize shapes
70#canvas.create_...
71canvas.pack()
72
73# start idle loop
74root.after(100,idle,root,canvas)
75root.mainloop()
Explaining the above code, the idle function is set up to be executed to be run periodically in line 74. It reads the data received via serial port, maps it to be within the range of [-2048, 2047]. Lines 42 to 44 calculate a moving average to reduce noise in the received signal. Afterwards, object coordinates are updated.
To this code I added the desired visualization elements. First, I created a rectangle on a black background. The tag is used to refer to the object when updating it later on.
canvas.create_rectangle((0, 0, 100, 100), fill="white", tags="rect")

window_width=600
window_height=200
rect_min_width=10
canvas.create_rectangle((0, 0, rect_min_width, window_height), fill="blue", tags="rect")

For readability I added a margin to between the white bar and the windows border.
margin = 10
rect_min_width = 10
rect_max_width = window_width - 2*margin
rect_height = window_height - 2*margin
canvas.create_rectangle((margin, margin, margin + rect_min_width, margin + rect_height), fill="white", tags="rect")

The dimension of the rectangle I changed to be updated based on the field strength in Z-direction.
1canvas.coords("rect", (margin,
2                        margin,
3                        margin + rect_min_width + abs(zf/zf_max)*(rect_max_width - rect_min_width),
4                        margin + rect_height))
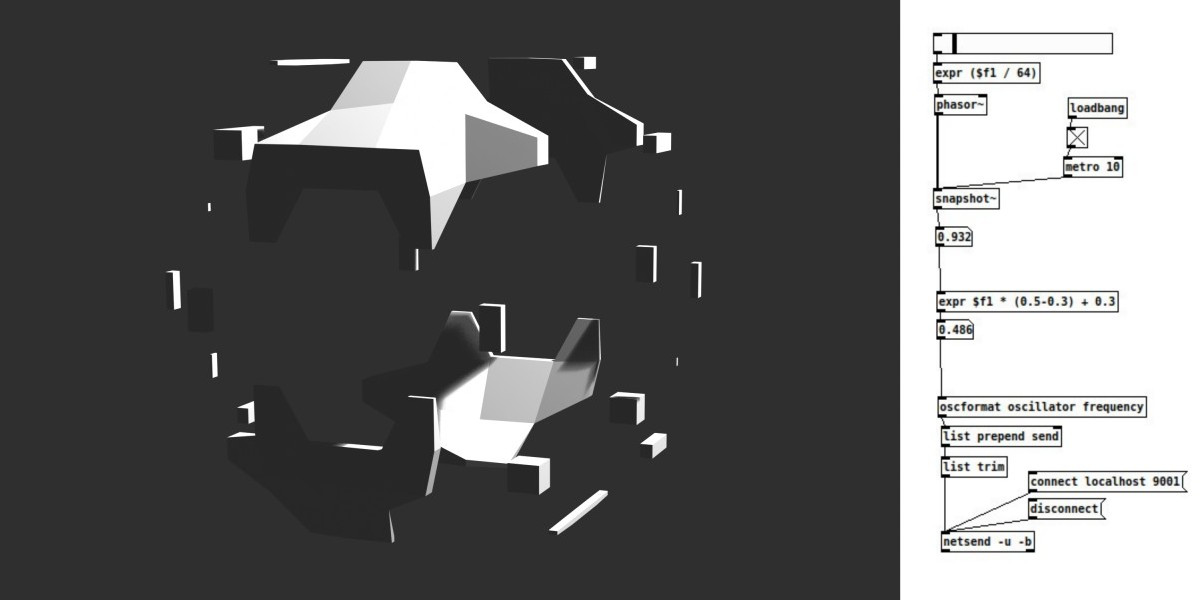
Blender, OSC & Pure Data
Another thing I looked into this week was controlling parameters in Blender from the network (in this case via the OSC protocol). This way, one could do animations influenced by sensors. That could then be used for interactive and/or audio-reactive 3D art. To make blender be able to receive and send OSC messages, I used the plugin NodeOSC. There is a tutorial video linked in the project’s readme file. Another tutorial I referred to for sending and receiving OSC messages from/to Pure Data. The Pure Data documentation helped as well. Alternative to this approach one could use game engines. Game engines for blender are Armory3D and UPBGE.
For a mesh to play around, I created an ico sphere and added some holes to it.


Reflections
What I still have not understood
- How to read serial data using Pure Data. Somehow, the suggested solutions I found could not be re-produced on my operating system.
What I Learned
- Working with NodeOSC and Pure Data.
What Went Well
- I was able to check off some other work and continued on my final project.
Digitial Files
- Python interface
- magnetometer_attiny.ino code (taken from the Fab Academy website) for the ATTiny412 at the magnetometer board to send sensor values via UART.
- skeleton.py
- visual_bar.py
- Blender and OSC
Use of Language Models
During writing this report, I did not use any language models.