06 Electronics Design
Group Assignment
The weekly group assignment can be accessed here.
Test Platform
For testing purposes, we used an Arduino Nano with the "Fade" example code from Arduino. This generates a PWM signal on pin 9, cycling in five steps from 0% to 100%. The signal should oscillate between < 0.8V and > 3V, with VCC being approximately +5V.
/*
  Fade

  This example shows how to fade an LED on pin 9 using the analogWrite()
  function.

  The analogWrite() function uses PWM, so if you want to change the pin you're
  using, be sure to use another PWM capable pin. On most Arduino, the PWM pins
  are identified with a "~" sign, like ~3, ~5, ~6, ~9, ~10 and ~11.

  This example code is in the public domain.

  https://www.arduino.cc/en/Tutorial/BuiltInExamples/Fade
*/

int led = 9;         // the PWM pin the LED is attached to
int brightness = 0;  // how bright the LED is
int fadeAmount = 5;  // how many points to fade the LED by

// the setup routine runs once when you press reset:
void setup() {
  // declare pin 9 to be an output:
  pinMode(led, OUTPUT);
}

// the loop routine runs over and over again forever:
void loop() {
  // set the brightness of pin 9:
  analogWrite(led, brightness);

  // change the brightness for next time through the loop:
  brightness = brightness + fadeAmount;

  // reverse the direction of the fading at the ends of the fade:
  if (brightness <= 0 || brightness >= 255) {
    fadeAmount = -fadeAmount;
  }
  // wait for 30 milliseconds to see the dimming effect
  delay(30);
}
Measuring 3V3 and +5V Pins
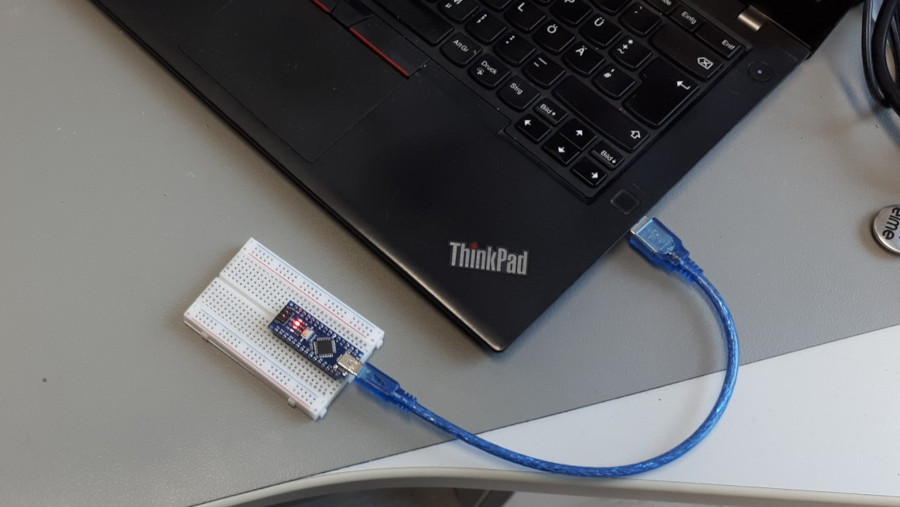
For the first measurement, we used a Fluke 117 multimeter, and for the second, a Rigol DM3068 multimeter, measuring between the GND pin and 3V3, +5V, and VIN. The Arduino was connected via a 30 cm USB 2.0 Type A to USB Mini cable to a laptop. The following readings were recorded:
| Pin | Fluke 117 | Rigol DM3068 |
|---|---|---|
| 3V3 | 3,29V | 3,291V |
| +5V | 4,73V | 4,731V |
| VIN | 4,31V | 4,263V |
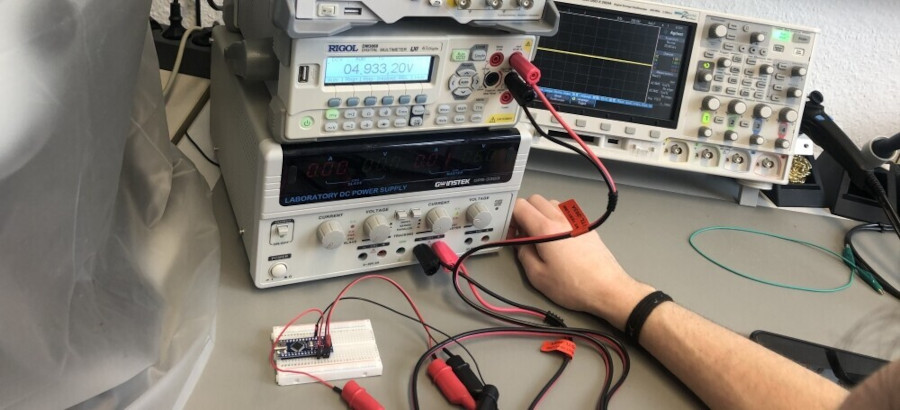
We powered the Arduino via USB from a laptop, leading to some fluctuations in power delivery. The laptop was running on battery power, and additional voltage drops occurred due to the cable and connection resistances. The probe wires used should have an impedance of 50 Ohms. If powered via the VIN pin from a stable power source, such as a regulated power supply, the results would be closer to 3.3V and +5V. In this case, the LM1117IMPX-5.0 regulator would provide +5V, and the FT232RL would derive 3,3V from the +5V rail, requiring an input voltage between 7-15V, according to the Arduino datasheet.

Power Consumption of the Arduino
For this measurement, we switched to a GW Instek GPS-3303 power supply. The Arduino was powered using cables with insulated banana plugs on one end and crocodile clamps on the other, connected to jumper wires leading to the breadboard and then to the Arduino. The contact resistance between the crocodile clamps and the jumper cables, along with the breadboard connections, had the most significant impact, in addition to the impedance of the jumper cables themselves.
For convenience, we used the same setup to connect the Rigol DM3068 multimeter. In standard practice, both voltage (U) and current (I) are measured to obtain a complete picture of power consumption. However, based on past measurements, we know the power supplies are highly accurate. According to the datasheet, the error is < 0.01% + 3 mV, meaning less than 5 V * 10^-4 + 0.03 V = 0.0305 V. Therefore, we decided not to measure the voltage separately. The setup ensures a correct current measurement. Our goal was to determine the total power consumption of the Arduino Nano board, not just the ATmega328P microcontroller.
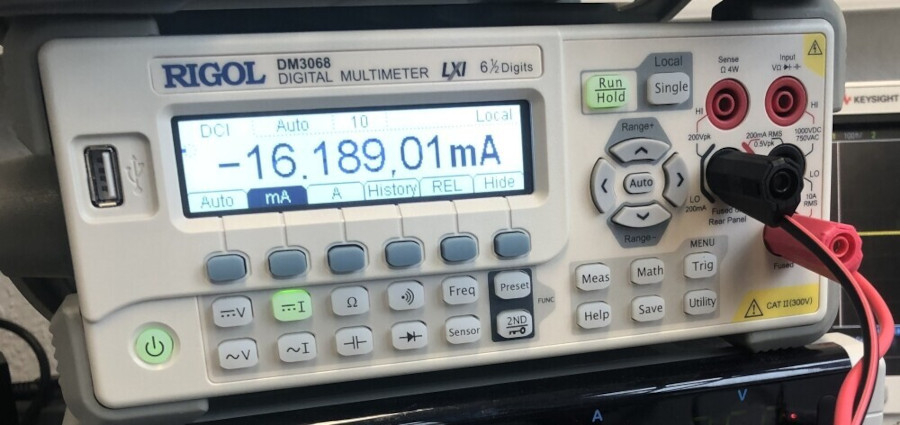
We measured -16,1890 mA. The accuracy of the multimeter is impressive, as confirmed by the datasheet.The negative value resulted from reversing the measurement leads. For power consumption calculations, we simply use the absolute value:
5 V * | -16.189 * 10^-3 A | = 80.945 * 10^-3 W.
A similar measurement could be performed while powering the setup from a laptop, but it would be more complicated unless a USB cable is cut in half. This is because a multimeter in current measurement mode must be placed in series, and the input voltage from the laptop would also need to be measured. At this point, one could debate whether it is better to measure voltage or current precisely, or if simply using a power meter would be the more practical approach.
Brown-Out Point
The brown-out point refers to the voltage level at which the microcontroller shuts down due to undervoltage. For an externally powered Arduino Nano via the VIN pin, this test determines the minimum required voltage for the LM1117IMPX-5.0 regulator. The datasheet suggests that this point should be slightly below 7V. We confirmed microcontroller functionality using an oscilloscope.
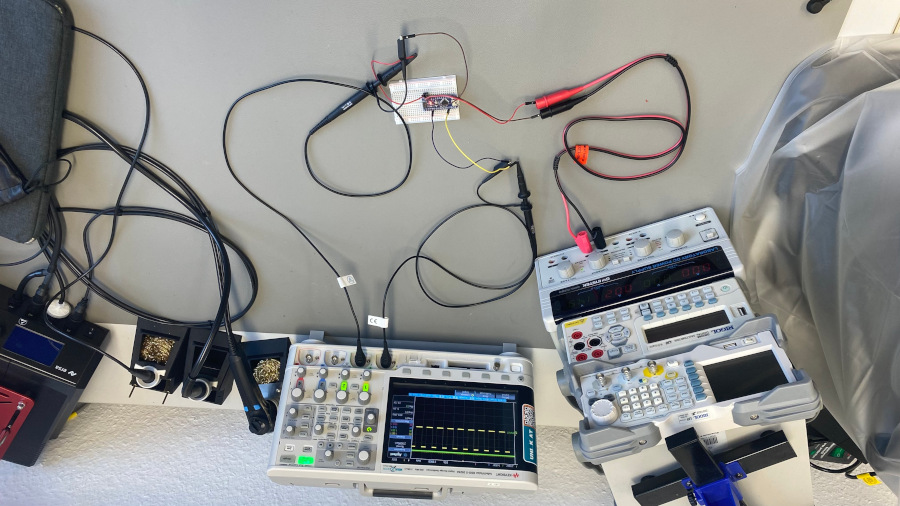
To better visualize, we labeled the green signal as "INPUT" (measuring the Arduino supply voltage) and the yellow signal as "SIGNAL" (measuring pin 9 output).
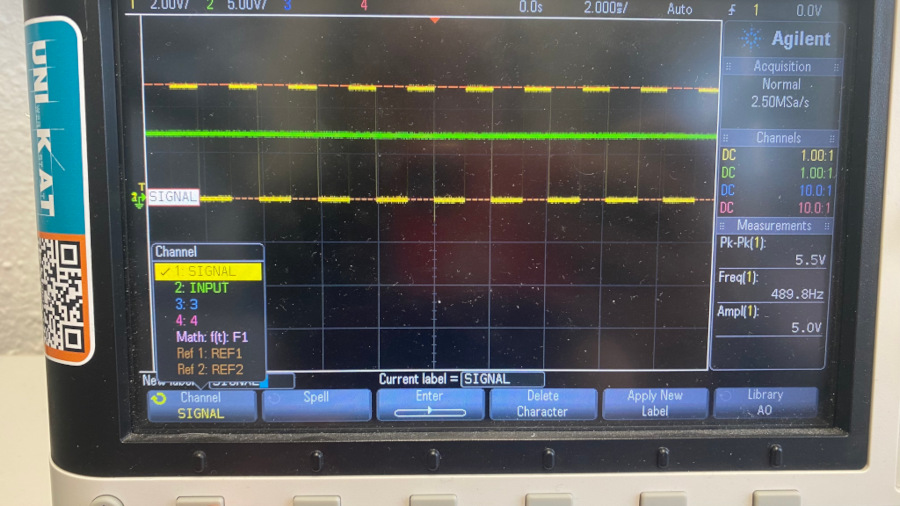
The video below illustrates the Arduino Nano’s behavior, showing how its PWM output signal changes with decreasing supply voltage.
The PWM amplitude remained between 4,9V and 5,1V above 6V supply voltage. Below 4,4V, the microcontroller shut down entirely, identifying the brown-out point at 4,4V.
Logic Analyzer
Will be there soon.
General Work Advice
Power Supply
Before disconnecting any components, always gradually reduce voltage and current. When using a power supply, the LED indicator will be green in Constant Voltage (CV) mode and red in Constant Current (CC) mode. If it switches to CC mode unexpectedly, check for issues like short circuits.
Multimeter
Turn off battery-powered multimeters after use to prevent rapid battery depletion. Low-cost multimeters may provide inaccurate readings. High-quality multimeters indicate low battery levels. Avoid changing the measurement range mid-series, as impedance differences may lead to inconsistent results.
Choosing an ECAD Program
In high school, I began using Eagle as my first ECAD program. It was a powerful tool that was relatively user-friendly and intuitive to use. At university, I had the opportunity to work with different software, starting with Altium Designer. While Altium was a much more powerful and complex tool, I only used it briefly before switching to Target 3001 v20, which felt much easier to use for me. Shortly after transitioning to Target 3001, I switched again to EasyEDA Std, primarily due to its integration of the LCSC parts library. This feature allowed me to search for components available for assembly at JLCPCB, significantly streamlining the workflow since we ordered most of our PCBs from there.
In 2022, I also explored KiCad, which performed very well. I found its usability quite similar to EasyEDA, but I preferred EasyEDA’s LCSC integration, so I continued using it and eventually upgraded to the Pro version.
For simulation, I used an older version of PSpice, but mostly relied on LTSpice due to its free availability.
For this project, I will start with EasyEDA Pro. If time permits, I will explore another program or workflow. One tool that caught my interest is pcb.py, particularly to see how well it handles polygons and not just traces. While this aspect is not critical for FabAcademy, it was important in my past work involving voltage converters.