LATE FA UNAM
Research stay at LATE Faculty of Architecture UNAM
Between May 26 and June 29, 2026, I have the opportunity to undertake a research stay at the Laboratory for Architecture + Design and Experimental Technology (LATE) at the Faculty of Architecture of the National Autonomous University of Mexico (UNAM), under the supervision of Dr. Ronan Bolaños. I would like to express my sincere gratitude for the opportunity to learn, collaborate, and contribute to the activities of this experimental laboratory.
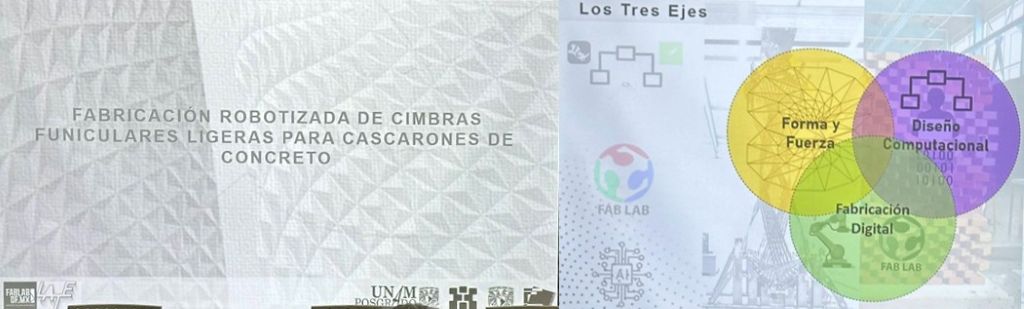
My first week at LATE has been intense, as I familiarized myself with the tasks and research activities ahead. One of the highlights was the opportunity to attend the defense of a master’s thesis entitled “Robotic Fabrication of Lightweight Funicular Formwork for Concrete Shells”, successfully defended by (Mtro.) Manuel Alejandro Alvarado de la Concha.
The examination committee was composed of distinguished academics and researchers, including Mtro. Francisco Reyna Gómez, Dr. Juan Gerardo Oliva Salinas, Dr. Ronan Bolaños Linares, and Mtro. Rodrigo Shiordia López.
Attending the defense provided valuable insight into the innovative research being carried out at the Faculty of Architecture and offered an excellent introduction to the academic environment, research culture, and collaborative spirit that characterize both the Faculty and LATE.
Real-Time Visualization of Structural Forces.
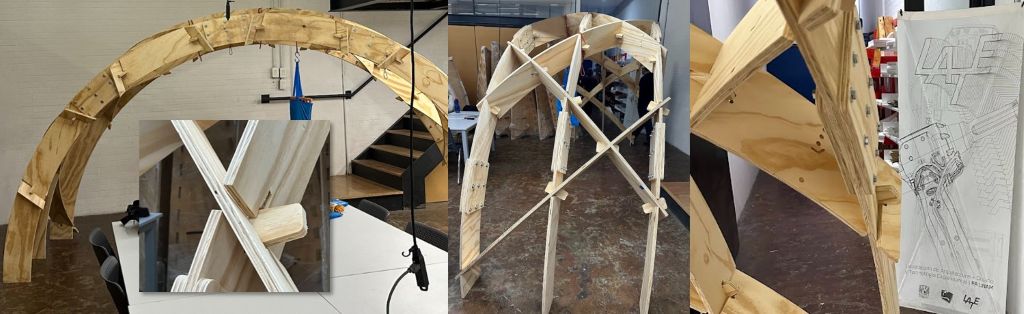
Before my arrival, Ronan and his team had been working on the design, fabrication, and assembly of a double-curved timber structure. This structure will serve as the physical platform for the installation of sensors that will enable the real-time visualization of loads and the resulting structural forces acting on the system.
My Fab Academy final project, The Bending Bench, will serve as the starting point for this research and will inspire a second, more comprehensive and visually expressive version of the system. This time, the representation of structural forces will be displayed through a web interface, eliminating the need to build a new LED panel.
The initial concept is as follows. Load cells will be installed on the structural model and connected to XIAO ESP32 microcontrollers, which will transmit sensor data via Wi-Fi to Grasshopper. There, the structural analysis software Karamba3D will calculate and visualize, in real time, the internal force diagrams directly on the digital model of the structure, including bending moments, shear forces, axial forces, as well as the deformed shape of the structure.
The difference compared to The Bending Bench is not only technical but also conceptual. In this case, the physical model and the digital model coexist and remain continuously synchronized, transforming the system into an interactive structural digital twin. This platform can serve both as a teaching tool and as a framework for applied research.
Step-by-Step Workflow
1. Load Cells
Selection, installation, wiring, and calibration.
1.1. Digital hanging scale
In my final project, I used platform-type load cells. For this project, I started from a digital hanging scale (Lumbor37 model) with a maximum load capacity of 150 kg.
The scale includes an LCD display and is powered by two 1.5 V AA batteries.
The goal was to “hack” the scale by connecting a custom PCB equipped with a XIAO ESP32C6 microcontroller and an HX711 load cell amplifier.
This setup allows the system to capture the small resistance variations produced by the strain gauges attached to the metal sensing element shown in the image below.
The metal element contains two holes used to attach the suspension hook and the applied load. As the load changes, the strain gauges deform slightly, producing an electrical signal that can be amplified, measured, and transmitted for further processing.
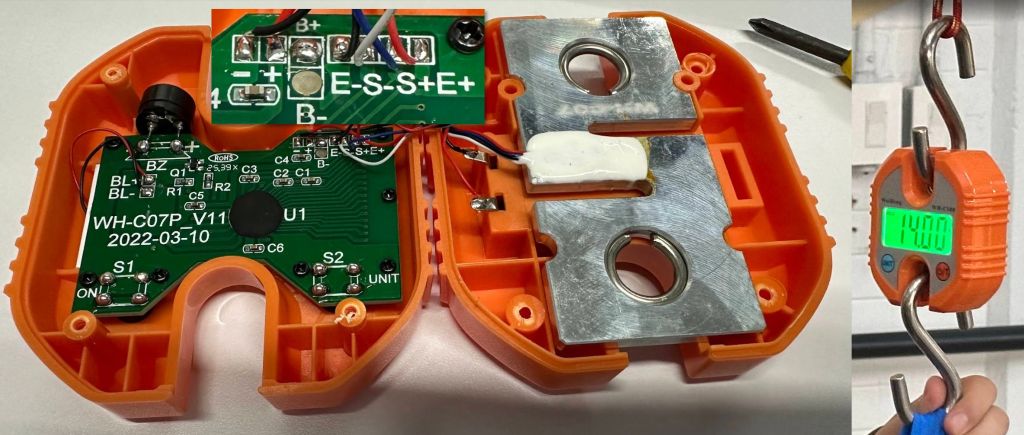
This scale features two push buttons: one for power on and tare, and another for changing the measurement units.
As shown in the image, the scale’s electronic board has four connections identified from left to right as: E-, S-, E+, and S+.
The connections labeled E-/+ are used to power the load cell, while the S-/S+ connections transmit the differential signal generated when the strain gauges deform under load.
If the Weiheng WH-C100 load cell signal appears to freeze, disable the Auto Hold function. Turn on the scale and hold the UNIT button for a few seconds until L-O is displayed. This disables automatic weight locking and allows continuous real-time readings.
Although the scale electronics could have been completely replaced, I decided to keep them because the LCD display is clear and easy to use. However, the goal was to extend the system so that the measured load could be shared with structural analysis software and used to evaluate the behavior of a structural system.
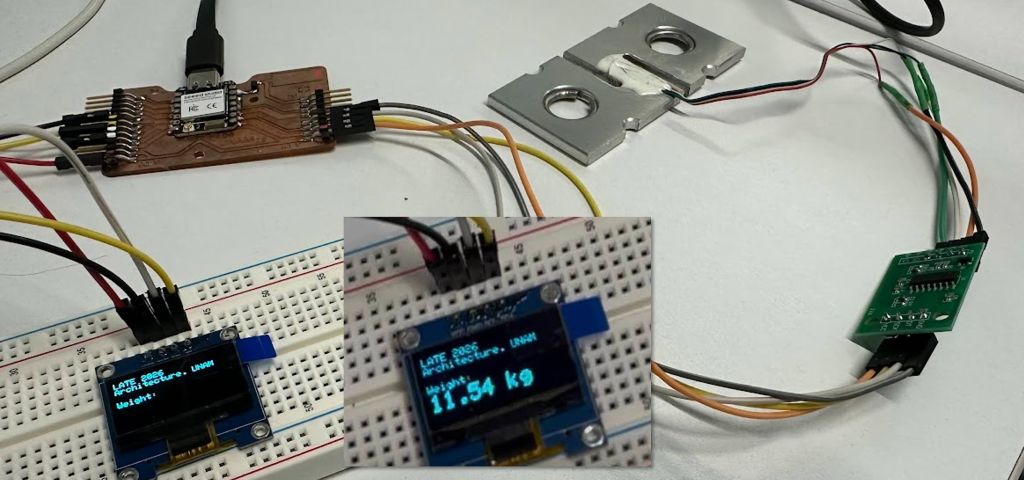
As a first step, I developed a prototype using a multifunction PCB. With the help of a breadboard, I connected the load cell output to an HX711 amplifier and then connected the amplifier to pins 7 and 8 of a XIAO ESP32C6.
At the same time, I connected an OLED display through the I²C interface to visualize the measured values. This made it possible to compare readings easily without relying on the Arduino IDE Serial Monitor.
A similar solution had already been developed during the Input Devices and Output Devices assignments in Fab Academy. For this project, I was able to improve several aspects of the system. The code was optimized to achieve more stable readings, a more accurate tare and calibration process, and the ability to define a target IP address for transmitting the load data collected by the hanging scale system.
Note
Load Cell Connections
The load cell must be powered only by the Scale Electronics through the E+ and E- connections.
The load cell must never be excited by both systems simultaneously.
E+→ HX711 not connectedE+→ Scale Electronics connectedE-→ HX711 not connectedE-→ Scale Electronics connected\
The differential signal lines (S+ and S-) can be shared between the HX711 and the Scale Electronics, allowing both systems to read the load cell gauges simultaneously.
S+→ HX711A+and Scale ElectronicsS+S-→ HX711A-and Scale ElectronicsS-\
All devices must share a common ground (GND) to ensure a stable reference voltage and reliable signal measurements.
GND→ Common ground shared by the HX711, XIAO ESP32C6, OLED display, and any other connected electronics
To power the scale, the microcontroller, and any input/output sensors connected to the system, an external LiPo battery can be connected to the dedicated power inputs included in the PCB design. Alternatively, the system can be powered through the XIAO USB-C connector. In this case, it is essential to use a power bank with a low-current mode, otherwise the power bank may automatically shut down after a few seconds because it does not detect a sufficient power draw from the electronics.
With the load cell prototype working and locally validated through the OLED display, the next step was to transmit sensor data wirelessly to Grasshopper in order to perform real-time structural analysis using Karamba3D.
2. Data Streaming
Real-time data transmission over a local network using UDP/HTML and XIAO ESP32 microcontrollers.
2.1. UDP Communication ESP32 - Grasshopper
The communication strategy evolved through several iterations, each revealing design decisions that needed to be made explicitly. In this section I document the process, describing the problems encountered in the spirit of Fab Academy. It has been an intense few days involving a demanding trial-and-error process that has finally led to a robust solution.
Starting Point: Fixed IP and Blocking Loop
The first version of the sketch transmitted data via UDP to a hardcoded IP address. It worked correctly under controlled conditions but presented several structural issues:
get_units(5)was called directly insideloop()without any timing control, blocking the processor for approximately 500 ms per cycle and preventing the HTTP server from responding smoothly.- The low-pass filter used
α = 0.9, resulting in a time constant of approximately 4.5 seconds, far too slow for dynamic load measurements. - The remote IP address was hardcoded, requiring the sketch to be recompiled almost every day because the laboratory network assigns dynamic IP addresses that change every 24 hours.
- Negative values produced by sensor noise were being transmitted to Grasshopper when they should instead be filtered and replaced with zero.
Dynamic IP Addresses on the Laboratory Network
The LATE WiFi network uses DHCP and changes assigned IP addresses every 24 hours. With Claude’s assistance, I evaluated three possible strategies:
Option A:
ipghSerial Command
Manual IP configuration through the serial monitor, stored in non-volatile memory usingPreferences. Simple and dependency-free, but it requires a USB connection between the computer and the XIAO.Option B: mDNS
The ESP32 publishes a fixed hostname (sensor1.local) on the network. Fully automatic, but potentially unreliable on university networks where multicast traffic may be filtered.Option C: UDP Broadcast
The ESP32 transmits to255.255.255.255, allowing every device on the subnet to receive the data without needing to know any specific IP address. Robust, autonomous, and compatible with multiple simultaneous receivers.
Selected solution: UDP Broadcast as the primary communication mode, with the ipgh command retained as an emergency fallback. This combination proved to be the most suitable for an educational laboratory environment where multiple computers may connect simultaneously to the sensor data and ESP32 nodes operate autonomously without USB connections.
Sensor Node Autonomy: No Permanent USB Connection
The ESP32 nodes are powered from a 5 V supply and operate autonomously without a permanent USB connection. This ruled out serial commands as the primary solution and further reinforced the broadcast approach.
Implemented solutions:
- Yellow LED on
LED BUILT_IN:
two operating states: a short blink every 2 seconds (WiFi connected + transmitting) and a fast blink every 200 ms (no WiFi connection). This allows the node status to be verified visually without using the serial monitor. - OLED with
oledAvailableflag:
the system operates correctly even when no display is connected, making it suitable for minimal deployments. In principle, the displays from the WH-C100 scales will be used, but the system can also operate without them. millis()-based timers:
HX711 reading every 300 ms, UDP transmission every 200 ms, and OLED refresh every 500 ms. This ensures thatloop()never blocks.- Low-pass filter adjusted to
α = 0.6:
time constant of approximately 0.5 seconds, providing a much faster response to actual load changes.
Security: secrets.h File
To allow the source code to be shared publicly without exposing WiFi credentials, sensitive information was separated into a secrets.h file located in the same folder as the .ino file:
// secrets.h — DO NOT include in public repositories
#define WIFI_SSID "network_name"
#define WIFI_PASS "password"
// Inside the .ino file
#include "secrets.h"
WiFi.begin(WIFI_SSID, WIFI_PASS);This pattern is standard practice in open-source projects that handle credentials and allows the complete source code to be shared while preserving network privacy.
Final Sketch: Key Parameters
// CHANGE ON EACH ESP32
int sensorID = 1;           // Unique node ID (1 to 6)

// Timing
READ_INTERVAL    = 300ms   // HX711 reading
SEND_INTERVAL    = 200ms   // UDP broadcast transmission
DISPLAY_INTERVAL = 500ms   // OLED refresh

// UDP
broadcastIP = 255.255.255.255 : 8888   // always active
remoteIP    = stored in Preferences    // optional fallback
UDP message format: sensorID,kg → example: 1,45.20
Serial commands:
| Command | Function |
|---|---|
t | Resets the sensor reading to zero. In the future, the WH-C100 scale tare button may be connected to perform this action, although taring is already performed automatically at startup. |
s | Calibrate using a known weight |
ip | Show network information |
ipgh 192.168.x.x | Save a direct IP address as fallback |
ipgh clear | Remove the stored direct IP |
? | Show help |
Serial Output
08:46:38.127 -> Scale factor: -0.000080
08:46:38.127 -> No fallback IP saved (broadcast only).
08:46:38.127 -> Initializing HX711...
08:46:38.127 -> Waiting for HX711...
08:46:38.127 -> HX711 detected
08:46:38.127 -> Performing tare...
08:46:38.127 -> Tare complete.
08:46:38.127 -> ......................................1,19.99
08:46:38.326 -> UDP broadcast → 1,31.69
08:46:38.611 -> UDP broadcast → 1,38.70
08:46:38.923 -> UDP broadcast → 1,42.88
Grasshopper: UDP Data Reception
C# Script: Minimal Communication Layer
The design principle is straightforward:
the C# script should be a minimal communication layer; the Grasshopper canvas is the visible application.
This approach has a strong educational component. The script is reduced to three responsibilities only: opening the UDP socket, receiving the raw string, and closing the socket during reset. All processing takes place directly on the canvas using native components that students can see, interact with, and modify without needing to understand socket programming.
The script evolved through several debugging iterations:
Socket already in use error: When the script was reloaded in Rhino without being properly closed, port 8888 remained occupied by the previous instance: Reserved keyword
Only one usage of each socket address is normally permitted.
Solution:
a CloseSocket() method called both during reset and initialization, ensuring that any existing socket is always closed before opening a new one. This allows the script to be reloaded without restarting Rhino.status:
in the Rhino 8 ScriptEditor, status is a reserved keyword that caused compilation errors. I renamed the output parameter to message.
The script returns fixed-size lists (MAX_SENSORS = 6):
loads→{45.20, 12.50, 0, 0, 0, 0}latest reading from each sensor,0.0if inactive.active→{true, true, false, false, false, false}indicates which sensors are currently transmitting.message→ dynamic status string showing only active sensors:RX · S1=45.20 S2=12.50
Each ESP32 is programmed with a unique sensorID. The script automatically maps ID=N to loads[N-1]. Adding a new sensor only requires programming a new XIAO with the next available ID; no modifications to the script or canvas are necessary.
| ESP32 Node | sensorID in the .ino | GH List Position |
|---|---|---|
| Node 1 | sensorID = 1 | loads[0] |
| Node 2 | sensorID = 2 | loads[1] |
| Node 3 | sensorID = 3 | loads[2] |
| … | … | … |
| Node 6 | sensorID = 6 | loads[5] |
using System;
using System.Net;
using System.Net.Sockets;
using System.Text;
using System.Collections.Generic;

public class Script_Instance : GH_ScriptInstance
{
  // =====================================================
  // CONFIGURACIÓN
  // MAX_SENSORS define el límite superior de sensores.
  // Las listas de salida tienen siempre este tamaño.
  // Sensores inactivos aparecen como 0.0
  // IDs válidos: 1 a MAX_SENSORS
  // =====================================================

  private const int MAX_SENSORS = 6;

  // =====================================================
  // VARIABLES PERSISTENTES
  // =====================================================

  private static UdpClient udp;
  private static bool    initialized = false;
  private static string  lastMessage = "Esperando...";
  private static float[] lastLoads   = new float[MAX_SENSORS];
  private static bool[]  sensorSeen  = new bool[MAX_SENSORS];

  // =====================================================
  // RUNSCRIPT
  // Inputs:  reset  (bool)
  //          enable (bool)
  // Outputs: ids     (list of int)    → {1,2,3,4,5,6}
  //          loads   (list of float)  → {45.20,12.50,0,0,0,0}
  //          active  (list of bool)   → {true,true,false,...}
  //          message (string)         → estado para debug
  // =====================================================

  private void RunScript(
		bool reset,
		bool enable,
		ref object ids,
		ref object loads,
		ref object active,
		ref object message)
  {
    // ===================================================
    // RESET
    // ===================================================

    if (reset)
    {
      CloseSocket();
      initialized = false;
      lastLoads   = new float[MAX_SENSORS];
      sensorSeen  = new bool[MAX_SENSORS];
      lastMessage = "Reset OK — activa Enable";

      ids     = BuildIdList();
      loads   = BuildLoadList();
      active  = BuildActiveList();
      message = lastMessage;
      return;
    }

    // ===================================================
    // INICIALIZAR SOCKET
    // Cierra cualquier socket previo antes de abrir uno nuevo.
    // Evita el error "Only one usage of each socket address"
    // al recargar el script sin salir de Rhino.
    // ===================================================

    if (!initialized)
    {
      // Cerrar socket previo si existe
      CloseSocket();

      try
      {
        udp = new UdpClient(8888);
        udp.Client.ReceiveTimeout = 10;
        initialized = true;
        lastMessage = "UDP OK · escuchando :8888";
      }
      catch (Exception ex)
      {
        lastMessage = "Init error: " + ex.Message;
        ids     = BuildIdList();
        loads   = BuildLoadList();
        active  = BuildActiveList();
        message = lastMessage;
        return;
      }
    }

    // ===================================================
    // PAUSADO
    // ===================================================

    if (!enable)
    {
      ids     = BuildIdList();
      loads   = BuildLoadList();
      active  = BuildActiveList();
      message = "Pausado";
      return;
    }

    // ===================================================
    // RECIBIR — quedarse con el paquete más reciente
    // ===================================================

    try
    {
      IPEndPoint ep     = new IPEndPoint(IPAddress.Any, 0);
      byte[]     latest = null;

      // Vaciar buffer — quedarse con el más reciente
      while (udp.Available > 0)
        latest = udp.Receive(ref ep);

      // Si buffer vacío intentar lectura corta bloqueante
      if (latest == null)
      {
        try   { latest = udp.Receive(ref ep); }
        catch (SocketException) {}
      }

      // Parsear si llegó algo
      if (latest != null)
      {
        string received = Encoding.UTF8.GetString(latest).Trim();

        // Formato esperado: "sensorID,kg"  →  "1,45.20"
        string[] parts = received.Split(',');

        if (parts.Length == 2)
        {
          int   parsedID;
          float parsedKg;

          bool okID = int.TryParse(
            parts[0].Trim(),
            out parsedID);

          bool okKg = float.TryParse(
            parts[1].Trim(),
            System.Globalization.NumberStyles.Float,
            System.Globalization.CultureInfo.InvariantCulture,
            out parsedKg);

          // Actualizar solo si el ID está en rango
          if (okID && okKg && parsedID >= 1 && parsedID <= MAX_SENSORS)
          {
            int idx = parsedID - 1;

            lastLoads[idx]  = parsedKg < 0 ? 0f : parsedKg;
            sensorSeen[idx] = true;

            // Resumen de sensores activos para message
            var summary = new System.Text.StringBuilder();
            summary.Append("RX · ");
            for (int i = 0; i < MAX_SENSORS; i++)
            {
              if (sensorSeen[i])
              {
                summary.AppendFormat(
                  "S{0}={1:F2} ",
                  i + 1,
                  lastLoads[i]);
              }
            }
            lastMessage = summary.ToString().TrimEnd();
          }
          else
          {
            lastMessage = "ID fuera de rango: " + received;
          }
        }
        else
        {
          lastMessage = "Formato inesperado: " + received;
        }
      }
    }
    catch (Exception ex)
    {
      lastMessage = "Error: " + ex.Message;
    }

    // ===================================================
    // OUTPUTS
    // ===================================================

    ids     = BuildIdList();
    loads   = BuildLoadList();
    active  = BuildActiveList();
    message = lastMessage;
  }

  // ===================================================
  // HELPERS
  // ===================================================

  private void CloseSocket()
  {
    if (udp != null)
    {
      try { udp.Close();   } catch {}
      try { udp.Dispose(); } catch {}
      udp = null;
    }
  }

  private List<int> BuildIdList()
  {
    var list = new List<int>();
    for (int i = 1; i <= MAX_SENSORS; i++)
      list.Add(i);
    return list;
  }

  private List<float> BuildLoadList()
  {
    var list = new List<float>();
    for (int i = 0; i < MAX_SENSORS; i++)
      list.Add(lastLoads[i]);
    return list;
  }

  private List<bool> BuildActiveList()
  {
    var list = new List<bool>();
    for (int i = 0; i < MAX_SENSORS; i++)
      list.Add(sensorSeen[i]);
    return list;
  }
}
Grasshopper Canvas
Each section of the canvas contains an implicit question that students can answer visually and interact with in real time:
| Area | Question | Component |
|---|---|---|
| Reception | What data is arriving? | Raw panel |
| Filtering | Is this a real load or noise? | Expression with threshold slider |
| Smoothing | How many samples should be averaged? | Data Recorder with n slider |
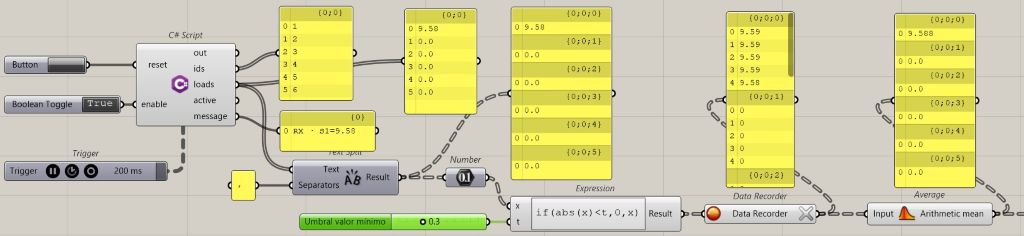
Adjustable parameters on the Grasshopper canvas:
| Slider | Function | Current Value |
|---|---|---|
| Expression Threshold | Filters noise near zero | 0.3 kg |
| Data Recorder n | Number of samples used for averaging | 3 |
| Trigger | Refresh interval | 200 ms |
Note
Note about Data Recorder and lists:
when feeding the Data Recorder with a list containing two sensors, three branches occasionally appeared in the data tree: two containing readings and one empty branch. If this occurs, simply click the X button located on the output of the Data Recorder component to reset the data structure.
The communication between the sensors connected to the XIAO ESP32C6 and the Grasshopper environment is working correctly. In the next section, I will document how the received data is processed, interpreted, and visualized in Karamba3D for real-time structural analysis.
Important
A problem that appeared after the weekend was that the system stopped receiving data even though nothing had been changed. After ruling out hardware issues and verifying that the ESP32 devices were still sending data correctly, the cause turned out to be that Windows had automatically changed the network profile from Private to Public, blocking incoming UDP traffic on port 8888.
The solution was to change the profile in Settings → Network & Internet → Wi-Fi → Network Properties.
I’m documenting it here so that I don’t waste time again searching for the cause of this issue.
3. Data Integration
Next, I define the Grasshopper workflow for receiving, processing, and visualizing the data collected by the sensors, enabling its real-time analysis within Karamba3D.
WIP 3.1. Structural analysis and visualization
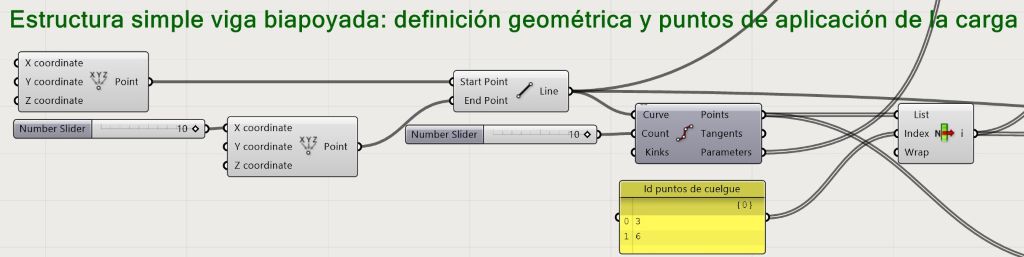
The first tests will be carried out using a simple structure: a simply supported beam. I prepared this definition in Grasshopper and will later be able to replace it with the timber framework designed by Ronan and his team.
The idea is to create a standard definition capable of visualizing both the deformed shape of the structure and its characteristic internal force diagrams under the action of loads applied at predefined locations.
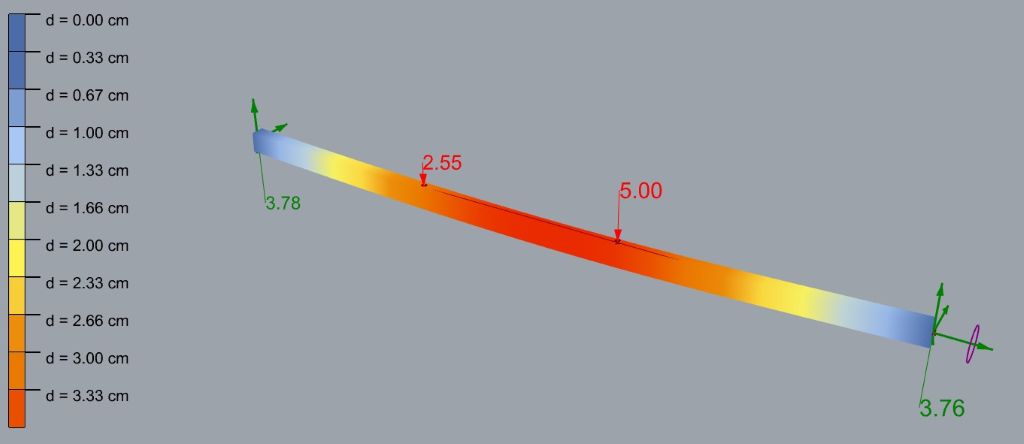
The goal is to develop a scalable system that can later be used to visualize a more complex spatial structure. For the moment, I will work with only two point loads applied at nodes 3 and 6, resulting from the discretization of the beam into 10 segments.
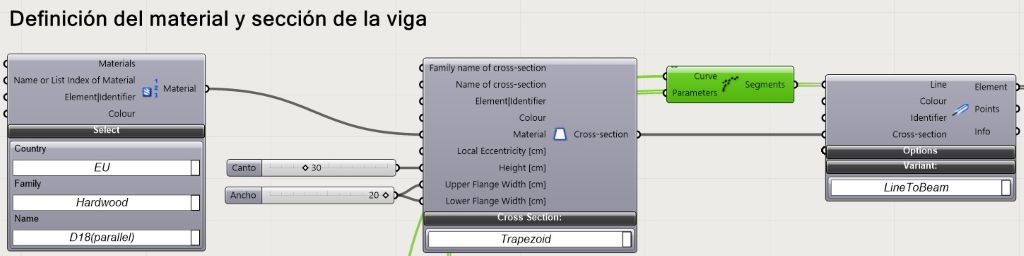
I will use Karamba3D, a well-known structural analysis software. The first step is to define the material properties and the cross-sectional dimensions of the structural element.
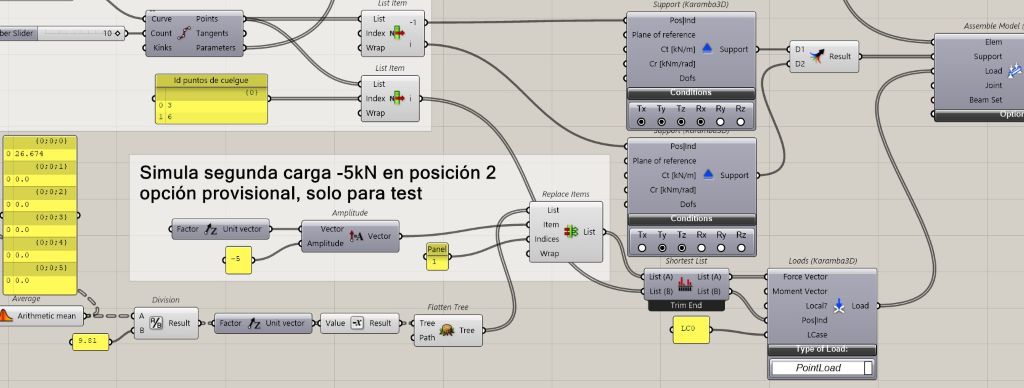
Once the material has been defined, I must establish the boundary conditions at the ends of the beam, as well as the locations where the loads will be applied and their nominal values.
For the initial tests, I will use only two loads. Later, the system can be extended to accommodate as many load application points as required.
With this information, I can proceed to assemble the structural model.
At this stage, my strategy is twofold. First, I want to visualize the deformation of the structure together with a graphical legend showing the displacement values in centimeters. This representation will allow users to intuitively understand how the structure responds to the applied loads.
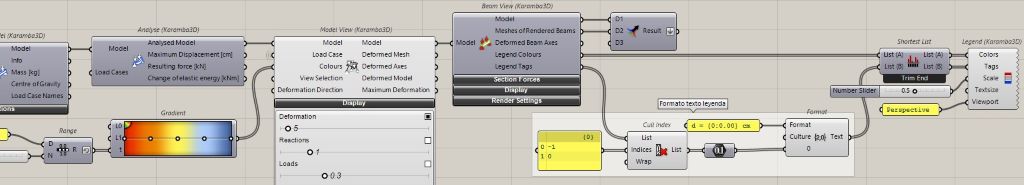
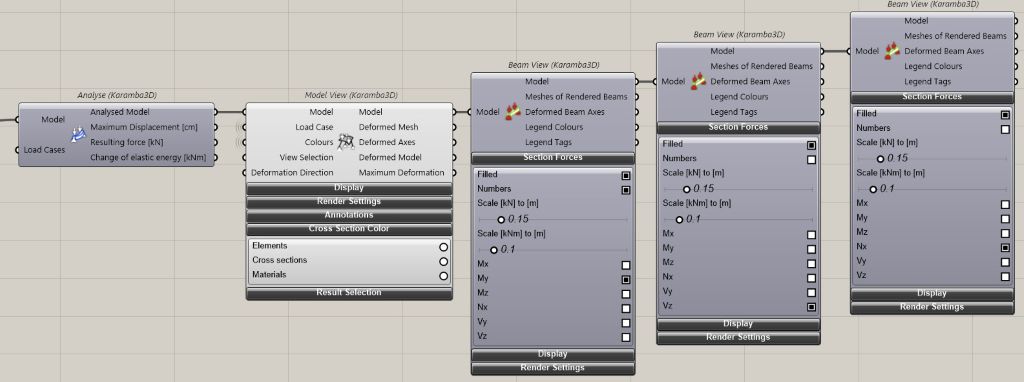
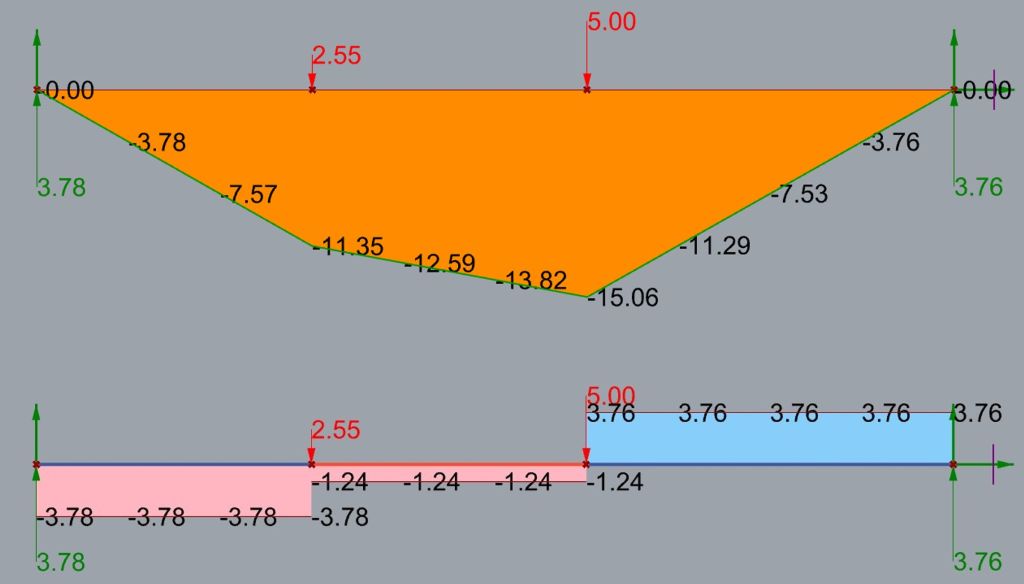
 Second, I want to visualize the characteristic internal force diagrams: bending moments, shear forces, and axial forces, independently of the structural deformation.
In other words, these diagrams will be displayed on the undeformed geometry of the structure.
 The purpose of separating these two representations is educational. By distinguishing between the deformed shape and the internal force diagrams, I hope to make it easier for students in the early years of a technical degree program to understand the relationship between external loads, structural behavior, and the resulting internal forces.
21.06.2026
WIP- Web Dashboard:
Development of a web-based interface for the real-time visualization of structural behavior and analysis results. Lorem ipsum dolor sit amet consectetur adipiscing elit porttitor aptent phasellus tristique, platea etiam est ullamcorper dui at volutpat nulla orci in vestibulum elementum, libero suscipit class vehicula taciti risus et non congue magnis.