Week 15
Interface and application programming

Week assignment
- Individual assignment:
- write an application that interfaces a user with an input &/or output device that you made ✔
- Group assignment:
- compare as many tool options as possible ✔
Group assignment
In the group assignment, we experimented with various tools to establish interactions between input and output devices and a graphical interface, either within a programming environment or through a web-based interface. We explored the possibilities of Scratch, Firefly, and MatLab. In the latter case, I delved into the possibility of displaying the information received from the sensors on the ThingSpeak platform.
Link to week 15 group assignment
Individual assignment
A completely new topic for me at the beginning of the week. On Wednesday, May 30, Neil introduced us to the virtually endless possibilities and options available to design applications that can interoperate with the input and output devices we explored in previous weeks. After the class, Luis recommended watching an introductory Processing tutorial by Marta Verde, recorded for FabAcademy students at FabLab León in previous editions.
Processing has many applications, its interface is similar to the Arduino IDE, and it is very well documented with countless available examples. Marta explains in her video that Processing predates Arduino, and that many of Arduino’s early ideas were inherited from Processing.
Processing
Processing is an open-source programming language based on Java, focused on the development of interactive visual applications. I will use it to write a program capable of interacting with both input and output devices. In my case, I will use load cells as input devices, and the acquired data will be graphically displayed on screen in real time. As I progress, I will incrementally add features depending on my learning curve. I will use Luis’s work this week as a reference, and I will also study the work of former FabAcademy students to learn from their experience with the language.
To interact with my input devices using Processing, and as Marta suggests in her video, I need an Arduino IDE sketch that outputs information through the serial monitor. I will reuse some of the programs I developed during Week 9 and Week 10.
First steps
First, I need to upload a program that sends data over the serial port. I will use the PCB I designed in Week 8 and upload the following code:
#define LED_BUILTIN D7

void setup() {
  Serial.begin(9600);
  pinMode(LED_BUILTIN, OUTPUT);
}

void loop() {
  Serial.println("Week 15 FabAcademy 2025"); // send message over the serial port
  digitalWrite(LED_BUILTIN, HIGH);  // LED ON
  delay(500);                      // Wait 0.5 second
  digitalWrite(LED_BUILTIN, LOW);   // LED OFF
  delay(500);                      // Wait 0.5 second
}
Since the Processing interface is very similar to the Arduino IDE, I found it intuitive and familiar. The first step is to import the Serial library via the Sketch menu.

The code is structured into three sections: first we import the libraries, then we declare the variables. As in Arduino, we have a setup function that runs only once, and instead of loop, we use a draw function that continuously executes.
I started by preparing a sketch to display the list of available serial ports, allowing me to select the one to which my MCU is connected.

pde code list serial ports
String lastValue = ""; // to compare with new data

void setup() {
  println("=== Week 15 - FabAcademy 2025 ===");
  println("Available Serial Ports:");
  printArray(Serial.list()); // show once

  delay(500);
  String portName = Serial.list()[4]; // Adjust if needed
  myPort = new Serial(this, portName, 9600);
  frameRate(2);
}

void draw() {
  if (myPort.available() > 0) {
    value = myPort.readStringUntil('\n');
    if (value != null && !value.equals(lastValue)) {
      println(value.trim()); // only print if value changed
      lastValue = value;
    }
  }
  // Do NOT print "No Data", to avoid flooding the console
}
Load cell monitor
The next step will be to visualize the real-time readings from a load cell. I will use the program I prepared in previous weeks, where I acquired the readings from load cells connected to the PCB. Specifically, I will use the PCB I manufactured for Week 10, along with this code, which displays the weight on an OLED screen, includes automatic taring, and stores the scale calibration in the MCU using the Preferences library.
The Arduino IDE serial monitor outputs the following string: Weight: actualWeight kg. I have adjusted the format and line break so that the value is correctly displayed on both the OLED screen and the Processing application window.

pde code basic weight
import processing.serial.*;

Serial myPort;           // Serial port object
String inputString = ""; // Line received from the serial port
float weight = 0.0;      // Current weight value

void setup() {
  size(400, 400);
  println(Serial.list()); // Show available serial ports
  String portName = Serial.list()[4]; // Adjust the index if necessary
  myPort = new Serial(this, portName, 115200);
  myPort.bufferUntil('\n'); // Read until newline character
}

void draw() {
  background(255);
  fill(0);
  textAlign(CENTER, CENTER);
  textSize(32);
  text("Weight", width / 2, height / 2 - 40);
  textSize(48);
  text(nf(weight, 1, 2) + " kg", width / 2, height / 2 + 20);
}

// This function is triggered each time a complete line is received from the serial port
void serialEvent(Serial myPort) {
  inputString = myPort.readStringUntil('\n');

  if (inputString != null) {
    inputString = inputString.trim();

    // Check if the line starts with "Weight: " and ends with " kg"
    if (inputString.startsWith("Weight: ") && inputString.endsWith(" kg")) {
      String val = inputString.substring(8, inputString.length() - 3); // Extract the numeric part
      try {
        weight = float(val); // Convert the string to a float
      } catch (Exception e) {
        println("Error parsing weight: " + val);
      }
    }
  }
}
Flower dial scale
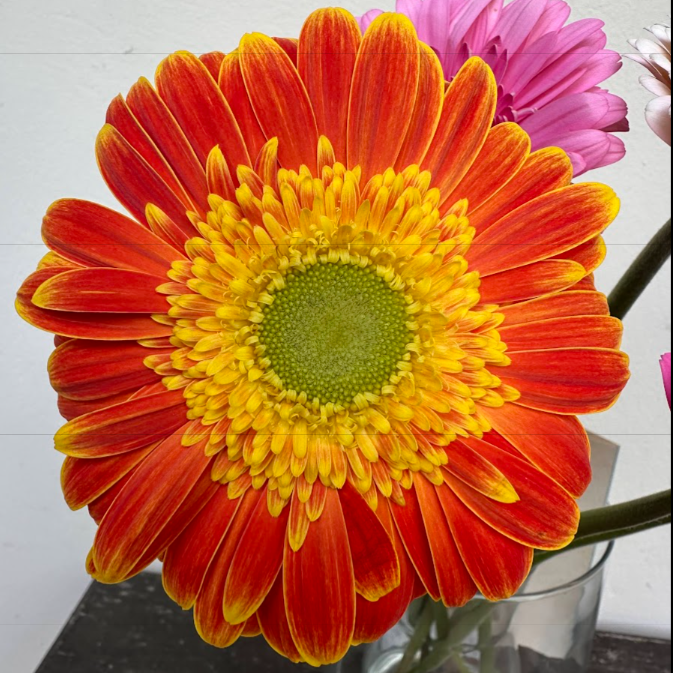
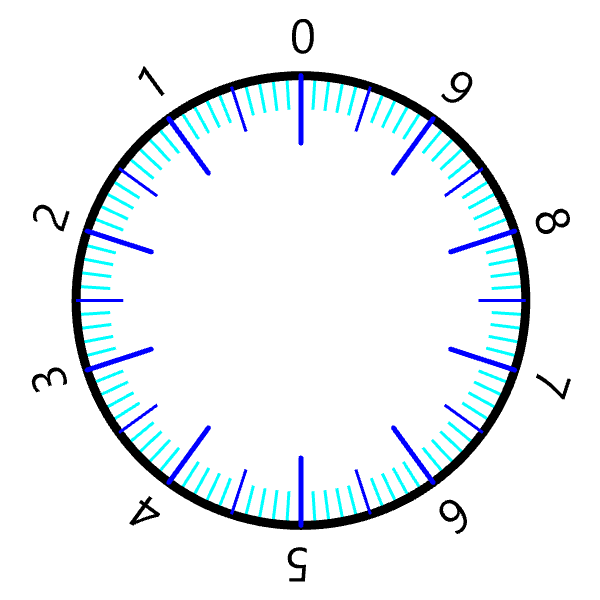
This visualization works but is too simple; to create a more visually engaging effect, I designed a parametric dial in Rhinoceros and Grasshopper using the Human plugin. The number of subdivisions on the dial and the minimum and maximum weight values can be easily adjusted. It is also very straightforward to change the size, color, and thickness of the different elements that make up the dial visualization.

In Spain, Mother’s Day is celebrated on the first Sunday of May, and it is traditional to give flowers as a gift. My wife prepared a bouquet to give to her mother, and when I saw it, I thought it would be a great idea to use it as the background for my scale visualization.

This would allow me to explore interactions within the visualization. To do this, I scaled one of the photos I took of the flowers and added a slider to control the transparency of the background image. The effect is achieved by adjusting the alpha channel value of a rectangle placed above the background photo and beneath the arrow and the weight dial.
Above, I placed the image of the dial and a box showing the numerical value from the load cell reading.
I prepared the Processing code with a slider that adjusts the transparency value. Pressing the R key resets the transparency to its initial value of 50%.
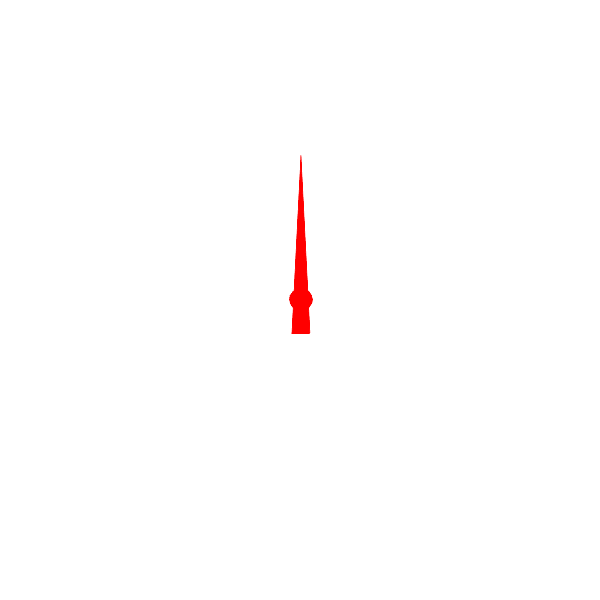
The dial rotates clockwise to display the reading from the serial monitor at the point indicated by the red arrow, which always remains vertical. This way, I can interact with the balance visualization using both the mouse and the keyboard.
I recorded a short video where the intended functionality can be clearly seen.
pde code flower dial scale
import processing.serial.*;

Serial myPort;
String inputString = "";
float weight = 0.0;
float displayedWeight = 0.0;

PImage balanza;
PImage flecha;
PImage flower;

// Opacity slider variables
float opacityValue = 127;  // Initial value at 50%
float sliderX, sliderY, sliderW = 200, sliderH = 20;
boolean dragging = false;

void setup() {
  size(600, 600);

  // Load images
  balanza = loadImage("balanza.png");
  flecha = loadImage("flecha.png");
  flower = loadImage("flower.png");

  // Resize images if needed
  balanza.resize(400, 400);
  flecha.resize(400, 400);

  // Set up slider position
  sliderX = width / 2 - sliderW / 2;
  sliderY = height - 50;

  // Set up serial port
  println(Serial.list());
  String portName = Serial.list()[4];  // Adjust index based on your system
  myPort = new Serial(this, portName, 115200);
  myPort.bufferUntil('\n');
}

void draw() {
  background(255);

  // Draw background image scaled and centered
  imageMode(CENTER);
  float scaleFactor = 1.3;
  float fw = flower.width * scaleFactor;
  float fh = flower.height * scaleFactor;
  image(flower, width / 2, height / 2, fw, fh);

  // Overlay translucent white layer for softening
  fill(255, opacityValue);
  noStroke();
  rectMode(CORNER);
  rect(0, 0, width, height);

  // Smooth weight transition
  displayedWeight += (weight - displayedWeight) * 0.1;

  // --- DRAWING CENTERED GRAPHIC (BALANCE + TEXT) ---
  pushMatrix();
  translate(width / 2, height / 2);

  float angle = map(constrain(displayedWeight, 0, 10), 0, 10, 0, TWO_PI);

  // Draw rotating balance image
  pushMatrix();
  rotate(angle);
  imageMode(CENTER);
  image(balanza, 0, 0);
  popMatrix();

  // Draw fixed arrow
  imageMode(CENTER);
  image(flecha, 0, 0);

  // Draw weight value in white box above center
  String textLabel = nf(displayedWeight, 1, 2) + " kg";
  textSize(48);
  textAlign(CENTER, CENTER);
  float textWidthPadding = 20;
  float textHeightPadding = 10;
  float tw = textWidth(textLabel) + textWidthPadding;
  float th = textAscent() + textDescent() + textHeightPadding;

  fill(255, opacityValue); // background box
  rectMode(CENTER);
  rect(0, -40, tw, th, 10);

  fill(0, 50); // shadow behind text
  text(textLabel, 2, -38);
  fill(0);
  text(textLabel, 0, -40);

  popMatrix();  // Restore original coordinate system

  // --- DRAW OPACITY SLIDER ---
  drawOpacitySlider();
}

// Function to draw the opacity slider
void drawOpacitySlider() {
  // Slider background
  fill(200);
  rectMode(CORNER);
  rect(sliderX, sliderY, sliderW, sliderH, 10);

  // Slider handle
  float handleX = map(opacityValue, 0, 255, sliderX, sliderX + sliderW);
  fill(100);
  ellipse(handleX, sliderY + sliderH / 2, 16, 16);

  // Opacity value label
  fill(0);
  textAlign(CENTER, CENTER);
  textSize(12);
  text("Opacity: " + int(map(opacityValue, 0, 255, 0, 100)) + "%", width / 2, sliderY - 10);
}

// Mouse interaction for slider
void mousePressed() {
  if (mouseX > sliderX && mouseX < sliderX + sliderW &&
      mouseY > sliderY && mouseY < sliderY + sliderH) {
    dragging = true;
  }
}

void mouseReleased() {
  dragging = false;
}

void mouseDragged() {
  if (dragging) {
    opacityValue = map(constrain(mouseX, sliderX, sliderX + sliderW), sliderX, sliderX + sliderW, 0, 255);
  }
}

// Press 'r' to reset opacity to 50%
void keyPressed() {
  if (key == 'r' || key == 'R') {
    opacityValue = 127;
  }
}

// Serial data handling
void serialEvent(Serial myPort) {
  inputString = myPort.readStringUntil('\n');

  if (inputString != null) {
    inputString = inputString.trim();

    if (inputString.startsWith("Weight: ") && inputString.endsWith(" kg")) {
      String val = inputString.substring(8, inputString.length() - 3);
      try {
        weight = float(val);
      } catch (Exception e) {
        println("Error parsing weight: " + val);
      }
    }
  }
}
HTML, CSS and JavaScript
As I’ve mentioned several times, Vera’s repository is one of my favorites. In this same topic of FabAcademy 2024, Vera prepared a script to enable mouse interaction on her web page. I thought it was a brilliant idea and considered it would be a great exercise to replicate the functionality of her code on a web page.
I created a shortcode to embed all the HTML code and JavaScript routines within the page, allowing real-time response to slider movements. Since I’m no longer reading weight values from the serial monitor, I included a second slider to simulate the weight applied on the scale.
The simulation layout has a fixed width of 600 px. The background image fills the entire area without distortion, thanks to (object-fit: cover). A white overlay layer is positioned above the background image and controlled via the #whiteoverlay element. The rotary dial is scaled to 70% of the total width and rotates dynamically based on the simulated weight value from the slider. The red arrow remains static (non-rotating), and I added a floating box with a semi-transparent background to display the weight value.
Image elements are arranged using z-index layering to achieve the desired visual stacking.
The weight slider simulates values between 0 and 10 kg with a step of 0.01 kg. When moved, it updates the on-screen reading, the label below the slider, and the dial rotation proportionally from 0° to 360°. The opacity slider varies from 0% to 100%, where 0% means the image is fully visible and 100% completely hides it.
Thanks to a series of consultations in ChatGPT, I was able to solve a functionality issue: the interface worked and displayed correctly in the theme’s light mode, but in dark mode, the slider labels were invisible due to matching the background color. In the end, I used JavaScript with addEventListener('input', ...) to respond in real time to slider changes and applied CSS transformations transform: rotate(...) to rotate the dial while dynamically updating the text and opacity values.
Warning
Some of the errors stemmed from the cache not being properly updated in HUGO.
To ensure it was refreshed, I canceled the server with Ctrl+C and ranhugo --cleanDestinationDir and then restart hugo server
Simulate a weight value to test dial rotation and weight display.
Adjust background transparency to control flower visibility behind the dial.
ThingSpeak
Weather Station with ESP8266 and ThingSpeak Integration
At home, I have been running a weather station for some time that sends data to ThingSpeak. The system is based on an ESP8266-12E MCU connected to the following components:
- DHT11: Temperature and Relative Humidity Sensor
- BMP180: Barometric Pressure Sensor
- BH1750FVI: Light Intensity Sensor
- OLED Display
WiFi connectivity must also be configured by providing the network SSID and password, so the MCU can query the forecast and send sensor data to ThingSpeak. This configuration is handled within the Arduino IDE code. In addition to transmitting data openly to ThingSpeak Channels, the OLED screen displays the current time and date, the present weather conditions, and a three-day forecast retrieved from OpenWeatherMap.
 To enable weather forecast functionality, an OpenWeatherMap account is required to obtain an API key for service connectivity. A ThingSpeak account is also necessary to retrieve and display sensor data from the respective channels using an API key.
Initially, four public channels have been activated. The display format is fully customizable, and each channel can be configured as public or private from the channel settings.

ThingSpeak is a MATLAB-based platform, which makes it possible to design visualizations that handle sensor readings connected to the system.
In this example, the temperatures from three different days are compared. The visualization uses data retrieved from a public channel. The code has been adjusted to display the temperature values in degrees Celsius.
ThingSpeak MATLAB
Compare temperature data from three different days
% Read temperature data from a ThingSpeak channel for three separate days
% and visualize the data in a single plot using the PLOT function.

% Channel 12397 contains data from the MathWorks Weather Station, located
% in Natick, Massachusetts. The data is collected once every minute.
% Field 4 contains temperature data.

% Channel ID to read data from
readChannelID = 2913078;
% Temperature Field ID
myFieldID = 4;
% One day date range
oneDay = [datetime('yesterday') datetime('today')];

% Channel Read API Key
% If your channel is private, then enter the read API key between the '' below:
readAPIKey = '';

% Read Temperature Data (in Fahrenheit)
temperatureDay1_F = thingSpeakRead(readChannelID,'Fields',myFieldID, ...
                                  'dateRange', oneDay, 'ReadKey',readAPIKey);
temperatureDay2_F = thingSpeakRead(readChannelID,'Fields',myFieldID, ...
                                  'dateRange',oneDay-days(1),'ReadKey',readAPIKey);
temperatureDay3_F = thingSpeakRead(readChannelID,'Fields',myFieldID, ...
                                  'dateRange', oneDay-days(2),'ReadKey',readAPIKey);

% Convert Fahrenheit to Celsius
temperatureDay1 = (temperatureDay1_F - 32) * 5/9;
temperatureDay2 = (temperatureDay2_F - 32) * 5/9;
temperatureDay3 = (temperatureDay3_F - 32) * 5/9;

% Create array of durations
myTimes1 = minutes(1:length(temperatureDay1));
myTimes2 = minutes(1:length(temperatureDay2));
myTimes3 = minutes(1:length(temperatureDay3));

% Visualize the data
plot(myTimes1,temperatureDay1, myTimes2,temperatureDay2, myTimes3, temperatureDay3);
legend({'Day 1','Day 2','Day 3'});
xlabel('Minutes');
ylabel('Temperature °C');
title('3-Day Temperature Comparison in Celsius');
Final Thoughts
A truly engaging week, I’ve really enjoyed working with Processing and exploring its capabilities for graphically representing data received from sensors. I also had the opportunity to deepen my understanding of JavaScript and its potential for simulating interactive tools, which will undoubtedly be very useful in my future teaching and research activities.
There are still many tools left to explore, but this week has been an excellent starting point for what promises to be a highly rewarding journey.
Files week 15
Sketch Load Cell Basic Processing. zip
Flower dial scale Processing .zip
Graphic scale Grasshopper
ShortCode Simulator Html .zip