week 15 Interface and Application Programming
- individual assignment: write an application that interfaces a user with an input &/or output device that you made
- group assignment: compare as many tool options as possible
Group Assignment
we divided the work to study and compare different software tools related to programming and interaction between the digital and physical world. Each member focused on a specific set of tools and then we shared our findings with the group.
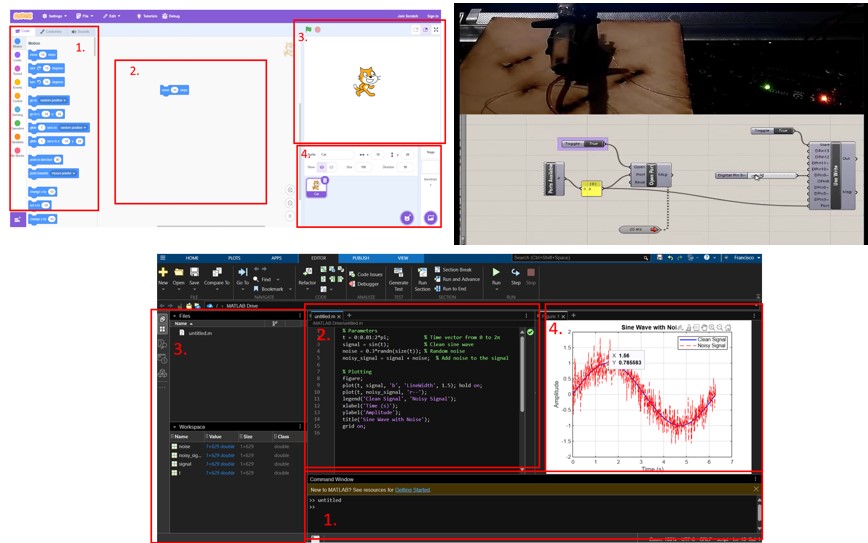
we worked with Scratch, Firefly, and MATLAB.
Scratch is a visual programming language created by MIT, mainly aimed at beginners and children. I explored its online platform and made a simple game where a character collects coins. It was an easy and fun way to understand basic programming concepts like loops, conditionals, and events—without writing any code.
Firefly is a plugin for Grasshopper (in Rhino) that lets you connect devices like Arduino to your digital models. I tested it by linking a temperature sensor to a servo motor, with real-time data streaming into Grasshopper. It was a very visual and interactive way to explore the connection between hardware and parametric design.
MATLAB is a programming environment widely used in engineering and science. I used it to analyze accelerometer data from a CSV file and plot vibration patterns. Its tools for working with data and graphs are very powerful, especially when dealing with matrices and signal processing.
Overall, this group task gave us the chance to explore different tools with practical examples and understand which ones are better suited for education, prototyping, or technical computing.
Details can be seen on the group page: Group link
Individual Assignment
Processing
Processing is an open-source graphical programming environment designed for artists, designers, and beginners to easily create visual and interactive digital projects. It uses a simplified version of Java and provides an intuitive interface for coding animations, visualizations, and interactive art, making it ideal for learning programming through visual feedback.
The first thing I did was to print Hello World! in the console.
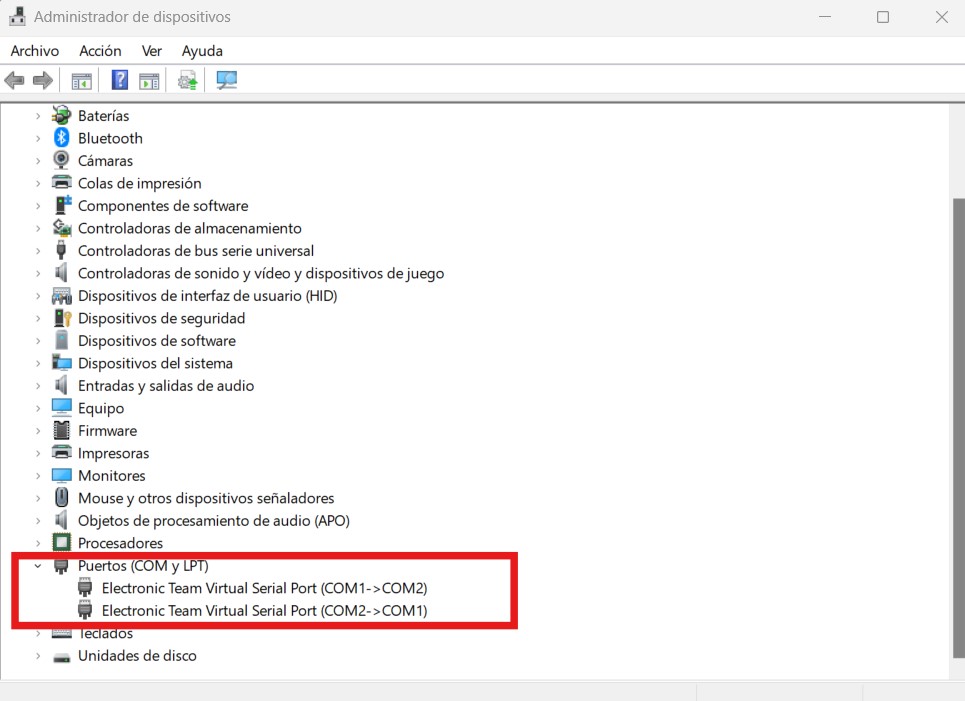
On thursay here in Spain was holiday, so I worked from home. Since I did not have the microcontrollers I downloaded a paid software that enables you to have different COM connections on your computers. The program is called Virtual Serial Port Driver. It has a 14 days free trial.
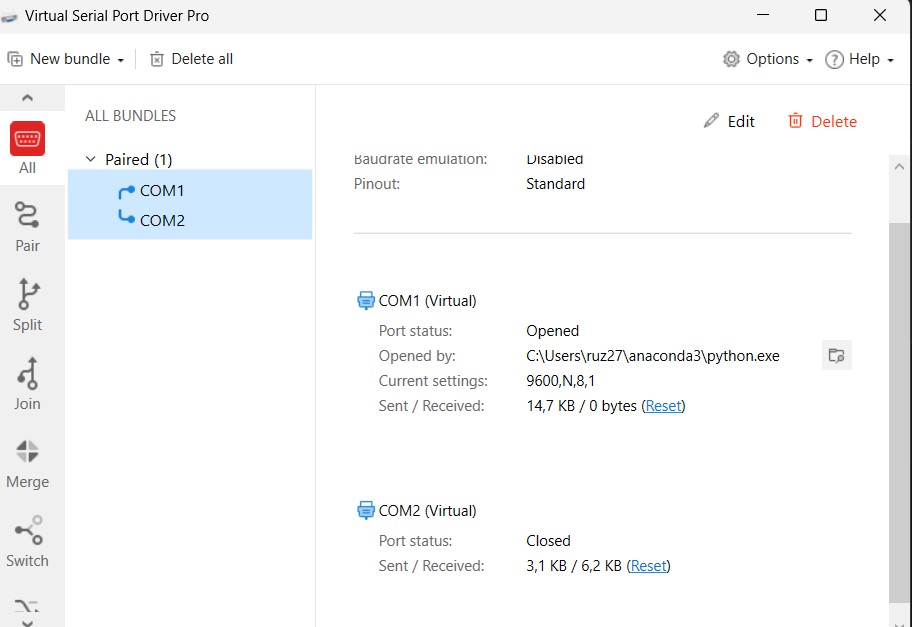
I can see that it is working on Device Manager on my computer
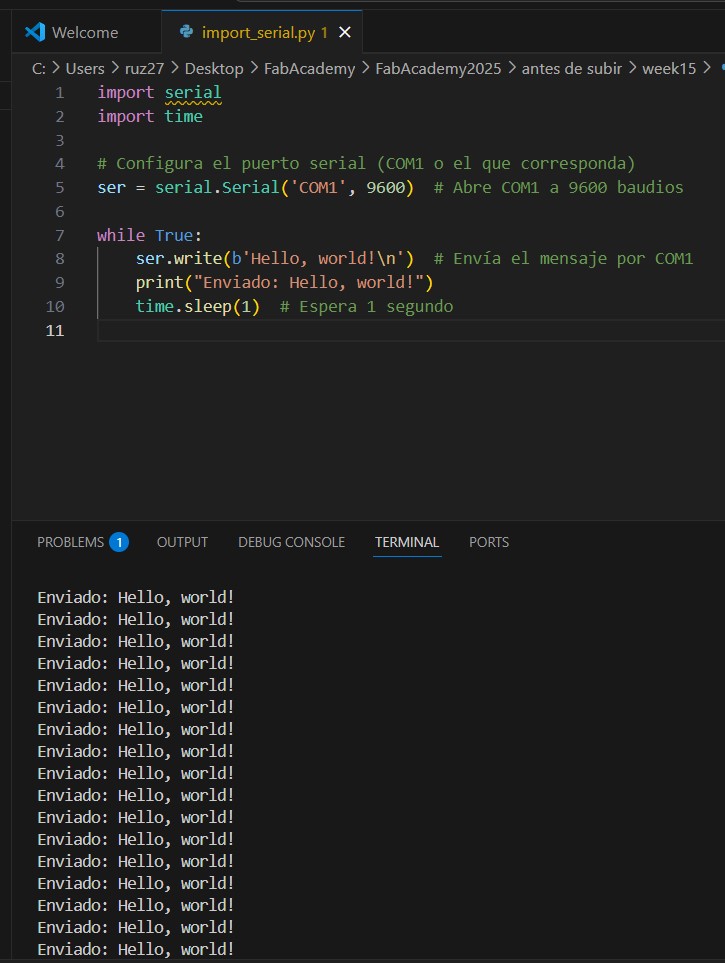
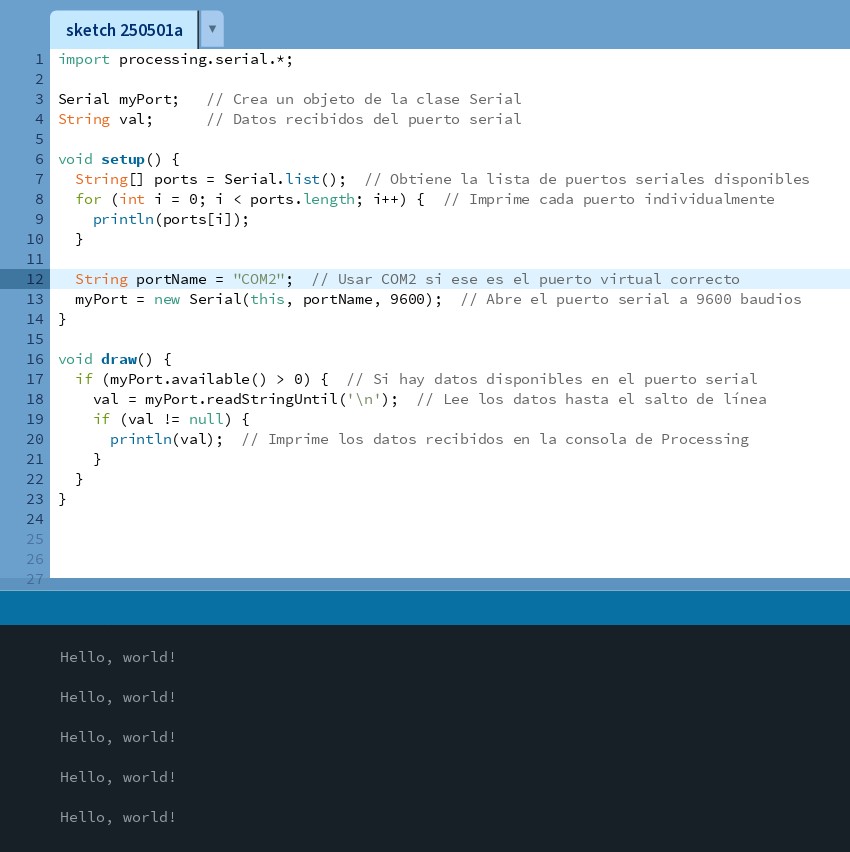
Then I wrtoe a very simple code on visual studio code to send the information to COM1. For this I install the library pyserial writing the following code on the console: pip install pyserial
So now COM1 is recieving Hello, world! every second
After this, I went to processing and made a new sketch from scratch using the option Serial.
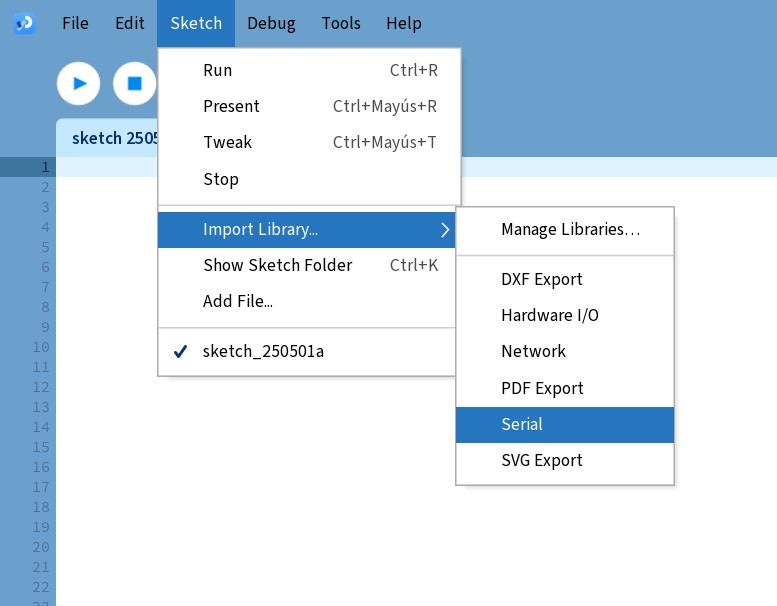
Then I did the coding to recieve the information via COM2 and write the information on the console.
It worked well so now I could do a thermoemeter with a nice interface.
Thermometer on processing
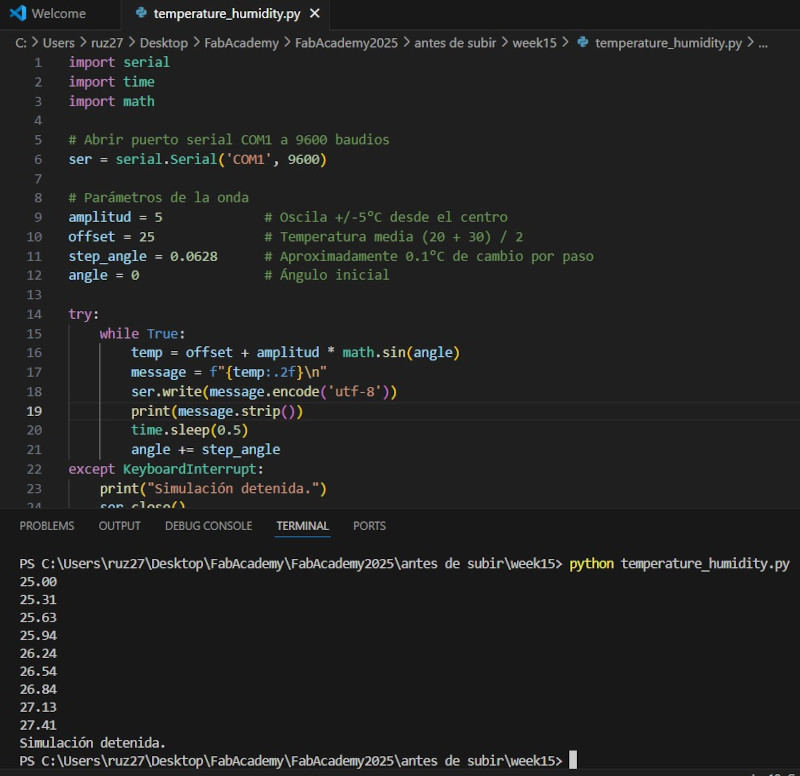
The next step I took was to simulate a sinuoidal temperature witha a min of 20°C and maximum of 30°C on python and sent the information via COM1
import processing.serial.*;

Serial myPort;  // Create object from Serial class

String val = "0";     // Data received from the serial port
float previousval = 0;
float m;

PFont verdana;
PFont verdana12;
PFont verdana48;

void setup() {
  String portName = "COM2";  // <--- Asegúrate de que este sea el correcto
  myPort = new Serial(this, portName, 9600);
  delay(100);

  size(400, 400);
  verdana12 = createFont("Verdana", 12);
  verdana = createFont("Verdana", 32);
  verdana48 = createFont("Verdana", 48);
  textFont(verdana);
}

void draw() {
  if (myPort.available() > 0) {
    String input = myPort.readStringUntil('\n'); // lee hasta salto de línea
    if (input != null) {
      val = input.trim(); // elimina espacios en blanco y \r
      println(val);
    }
  }

  colorMode(RGB);
  background(0);
  fill(255);
  textAlign(CENTER);
  textFont(verdana);
  text("Temperature Monitor", width/2, 40);
  textFont(verdana48);
  text(val, width/2, 90);
  textFont(verdana);
  text("ºC", 310, 90);

  // Variación de temperatura
  float currentVal = float(val);
  if (previousval > currentVal) {
    fill(0, 0, 255);
    text("<", 360, 380);
  } else if (previousval < currentVal) {
    fill(255, 0, 0);
    text(">", 360, 380);
  } else {
    fill(255);
    text("=", 360, 380);
  }

  textFont(verdana12);
  text("Temp \nvariation", 310, 365);
  fill(255);
  text(hour() + ":" + minute(), 30, 370);

  rect(180, 120, 40, 200);  // Termómetro base

  colorMode(HSB, 360, 100, 100);
  m = map(currentVal, 20, 30, 0, 200); // Ajustado a tu rango 20-30
  float H_color = map(currentVal, 20, 30, 220, 0); // Azul a rojo
  fill(H_color, 80, 80);
  rect(180, 320, 40, -m);

  previousval = currentVal;
  delay(500);
}
Arduino IDE
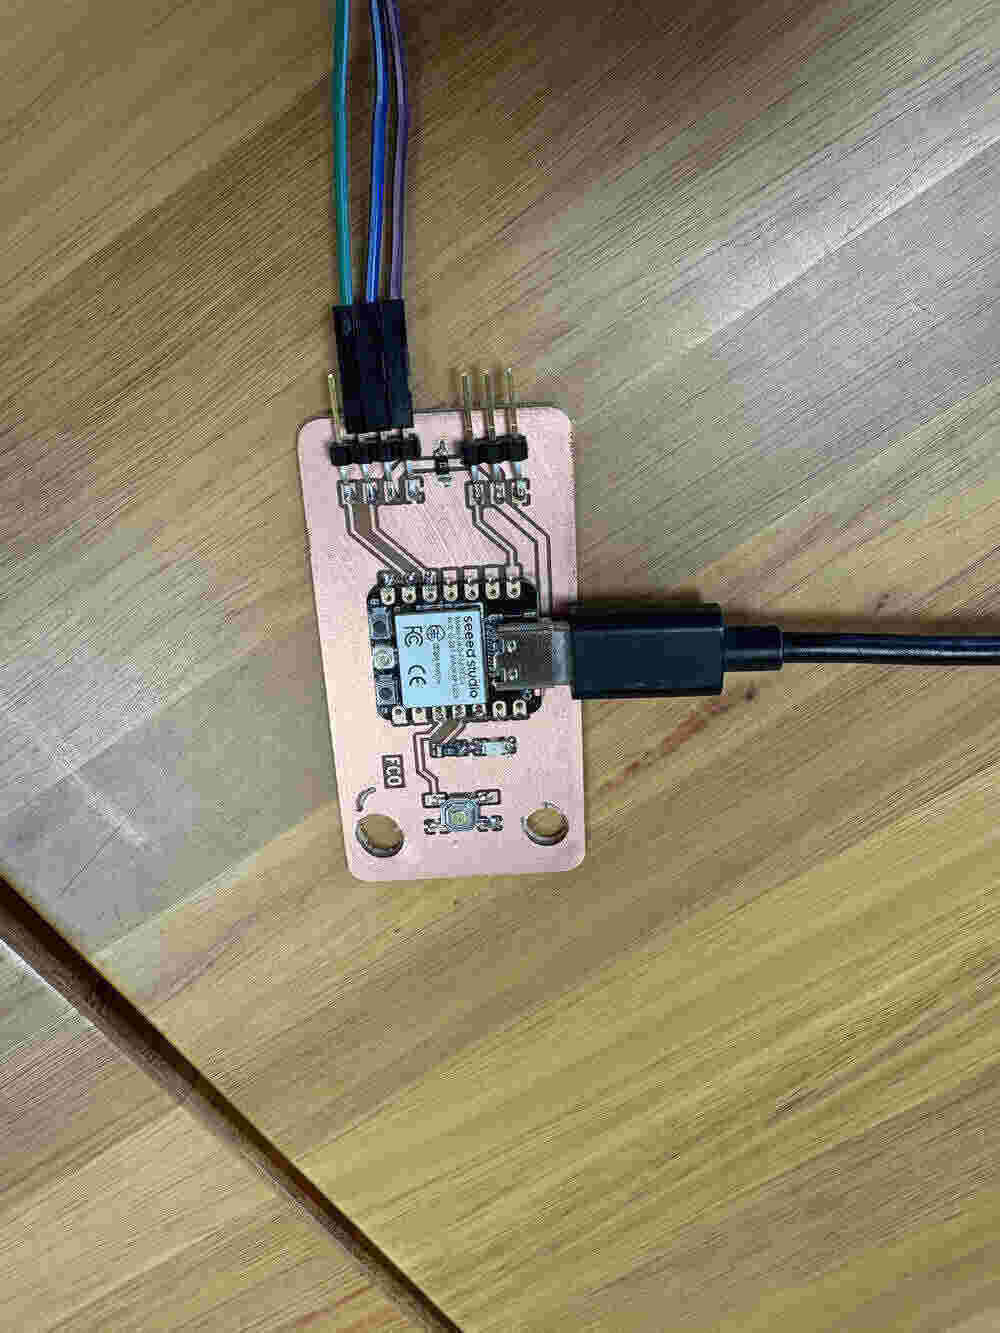
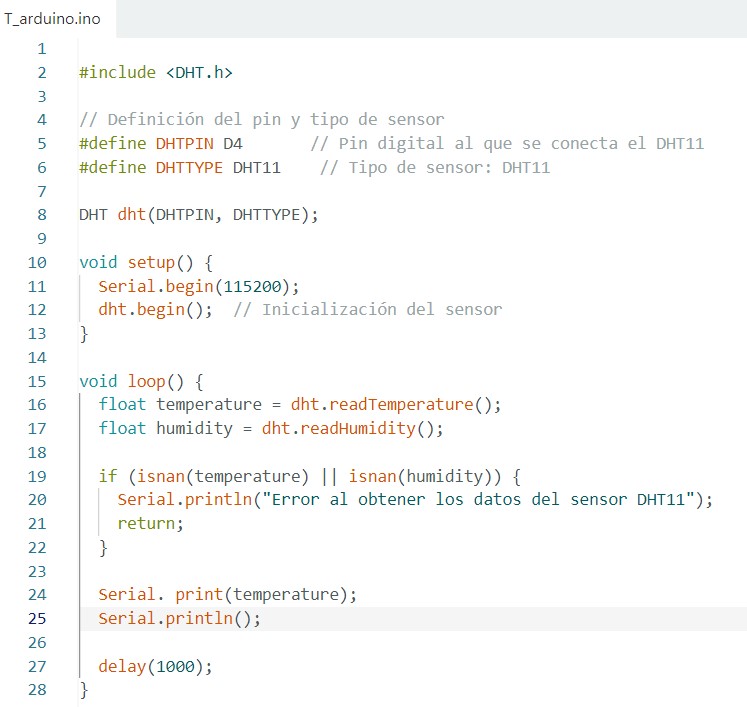
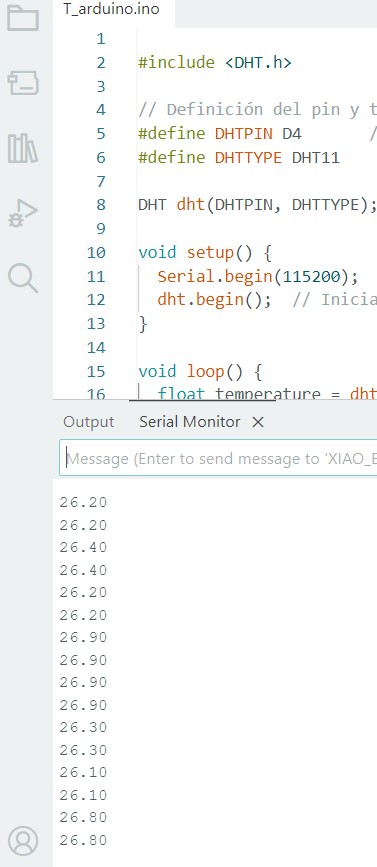
Since on the input week we worked with temperature/humidity sensor and arduino IDE, I felt familiarized with this part. I used a pcb fabricated by my own with a XIAO ESP32C3 microcontroller, the process is shown on the electronics production page.
The code is the following:
Documentation
- Temperature python: .zip click here
- Hello world python: .zip click here
- Hello world processing: .zip click here
- Temperature processing: .zip click here
- Temperature with emojis: .zip click here
- Arduino IDE: .zip click here