
Interface and Application Programming
assignment
individual assignment:
- write an application that interfaces a user with an
- input &/or output device that you made
-
group assignment:
- compare as many tool options as possible
- Link: Group assignment
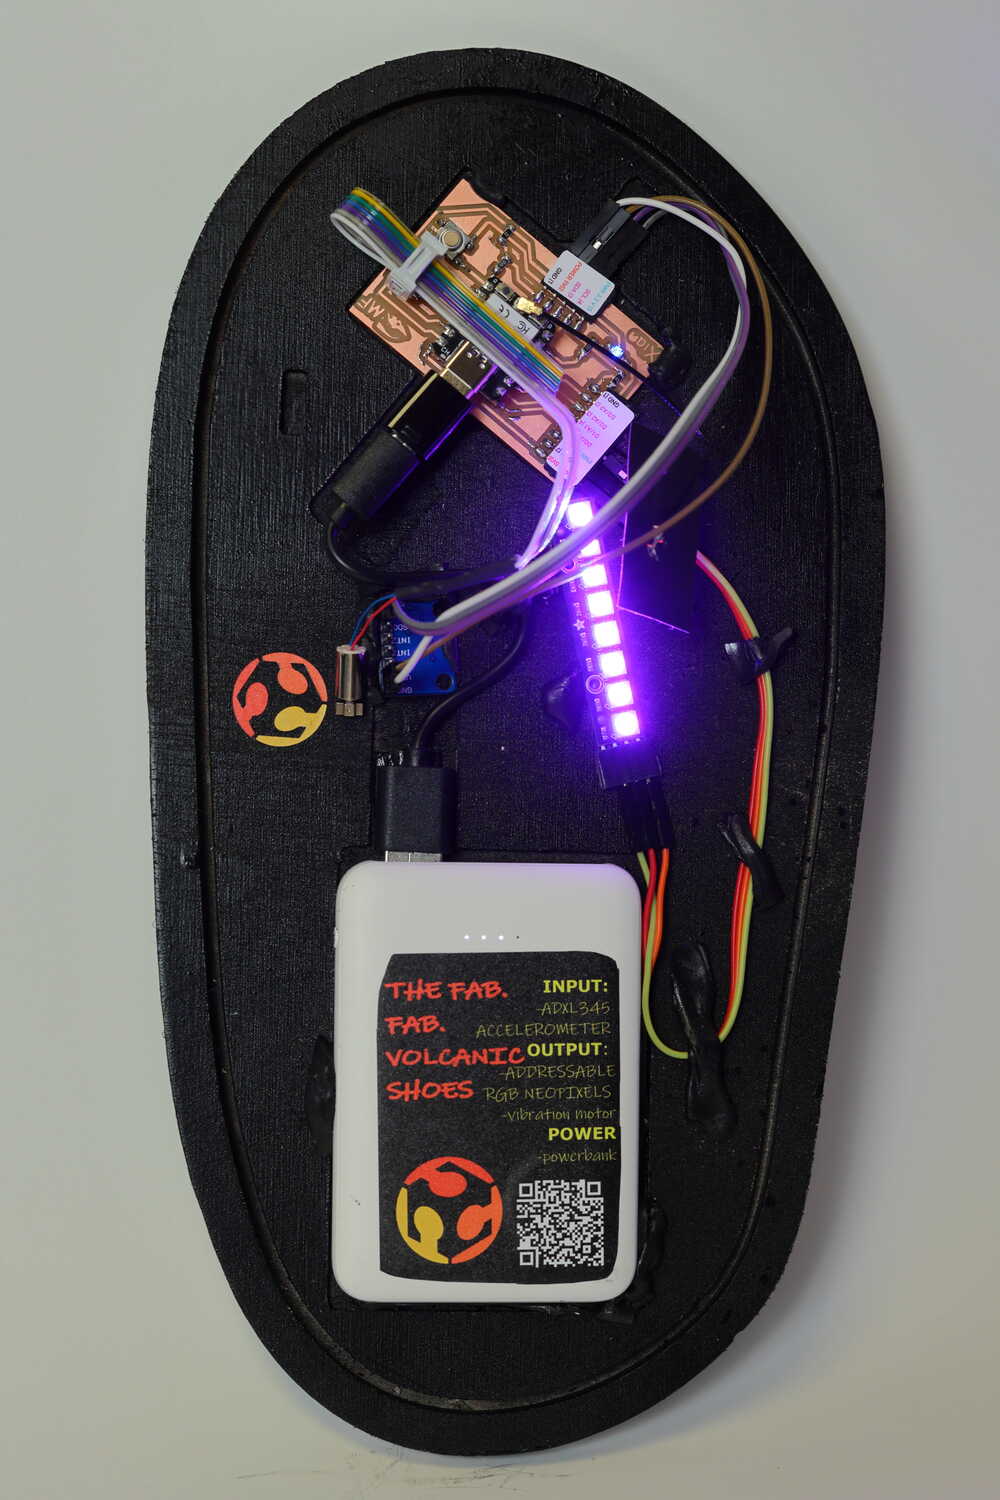
Here is an image of the inside of the shoe:
I used chat gpt to make a python code that showcases the data
Code:
This code shows the graph from the data it recieves from
the accelerometer
Code:
import serial
import matplotlib.pyplot as plt
import matplotlib.animation as animation
from collections import deque

# Initialize serial port
ser = serial.Serial('COM8', 9600, timeout=1)

# Create a figure and a set of subplots
fig, ax = plt.subplots()
plt.ion()

# Deques to store accelerometer data
x_vals = deque(maxlen=10)
y_vals = deque(maxlen=10)
z_vals = deque(maxlen=10)

# Initialize the bar containers
bars = ax.bar(['X', 'Y', 'Z'], [0, 0, 0], color=['blue', 'green', 'red'])
ax.set_ylim(-10, 10)
ax.set_facecolor('gray')

def update_bars():
    try:
        line = ser.readline().decode('utf-8').strip()
        if line:
            parts = line.split()
            x = float(parts[1])
            y = float(parts[3])
            z = float(parts[5])
            x_vals.append(x)
            y_vals.append(y)
            z_vals.append(z)

            bars[0].set_height(x)
            bars[1].set_height(y)
            bars[2].set_height(z)

            plt.draw()
    except Exception as e:
        print(f"Error reading data: {e}")

def animate(i):
    update_bars()

# Create the animation object and store it in a variable to prevent garbage collection
ani = animation.FuncAnimation(fig, animate, interval=100, cache_frame_data=False)

# Make sure the script doesn't terminate immediately
plt.show(block=True)

# Close serial port when the script ends
ser.close()
Here is a video demonstrating the code
working:
DRAWING THROUGH THE ACCELEROMETER
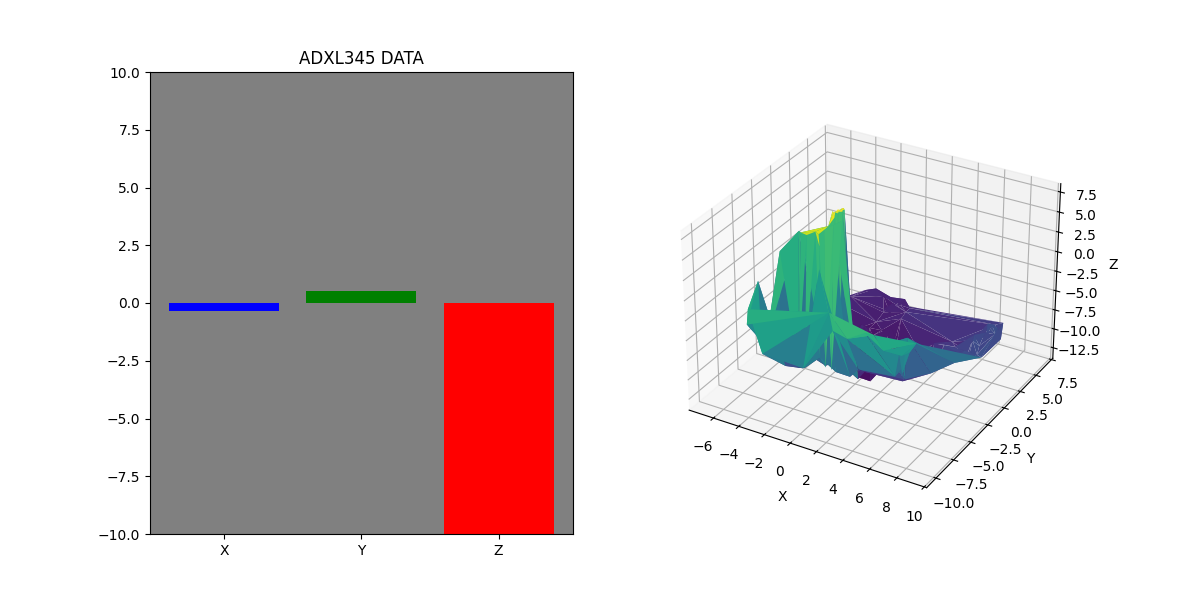
I used chat gpt to generate
a python code that would allow the accelerometer data to be
turned into a 3D graph
Problems:When connecting my circuit board to the windows PC, the COM port varied, and sometimes I had to change the python code to COM6 in stead of COM8 like in original code.
PYTHON CODE
I created a python code that receives and displays values from ADXL345 accelerometer via serial on COM8using: pyserial and matplotlib
This Python script reads accelerometer data from an ADXL345 connected to an RP2040 microcontroller via a serial port (COM8). It visualizes the data in real-time using Matplotlib, displaying a bar chart for X, Y, and Z values and a 3D surface plot of the accelerometer's trajectory. The script continuously updates the plots and automatically exports the 3D surface plot to an STL file named surface_plot.stl when the plot window is closed. This allows further processing of the data in 3D modeling software.
INSTALLATION INSTRUCTIONS
To ensure the script functions correctly, you need to install the necessary Python libraries. Follow these steps:Install Python: Make sure Python is installed on your system. You can download it from python.org.
Install Required Libraries: Open your command prompt or terminal and run the following commands:
commands:
bash
copy code
pip install matplotlib
pip install numpy
  pip install pyserial
 pip install meshio
These commands will install Matplotlib for plotting, NumPy for numerical operations, PySerial for serial communication, and Meshio for exporting the 3D surface plot to an STL file.
Code:
This code was generated
import serial
import matplotlib.pyplot as plt
import matplotlib.animation as animation
from collections import deque

# Initialize serial port
ser = serial.Serial('COM8', 9600, timeout=1)

# Create a figure and a set of subplots
fig, ax = plt.subplots()
plt.ion()

# Deques to store accelerometer data
x_vals = deque(maxlen=10)
y_vals = deque(maxlen=10)
z_vals = deque(maxlen=10)

# Initialize the bar containers
bars = ax.bar(['X', 'Y', 'Z'], [0, 0, 0], color=['blue', 'green', 'red'])
ax.set_ylim(-10, 10)
ax.set_facecolor('gray')

def update_bars():
 try:
 line = ser.readline().decode('utf-8').strip()
 if line:
 parts = line.split()
 x = float(parts[1])
 y = float(parts[3])
 z = float(parts[5])
 x_vals.append(x)
 y_vals.append(y)
 z_vals.append(z)

 bars[0].set_height(x)
 bars[1].set_height(y)
 bars[2].set_height(z)

 plt.draw()
 except Exception as e:
 print(f"Error reading data: {e}")

def animate(i):
 update_bars()

# Create the animation object and store it in a variable to prevent garbage collection
ani = animation.FuncAnimation(fig, animate, interval=100, cache_frame_data=False)

# Make sure the script doesn't terminate immediately
plt.show(block=True)

# Close serial port when the script ends
ser.close()
As demonstrated in these videos the graph can be turned
3D. The fun thing about this is that this can be put as an
STL, meaning in theory it could even work for 3D printing.
A user can draw with the accelerometer and theoretically
could create a landscape.
Here is an STL file of the 3D image created by
the data from the accelerometer from the video above!