Wildcard?! Could be a bit bonkers
Programming & Ilustrating for a better tomorrow
This week's assignment is sposnsored by my final project. Why you may ask? Well, my entry for this week stems from the making of the final project, it's a program designed to take some data arrays in terms of angles and translate them into a dynamic graph that display certain data that's relevant to the testing of my final project as well as gathering information.
Using python I created a software model that uses arrays and other functions with some equations that then display in a visual manner some randomized stats that could later be replaced by real data obtained by my final project's sensors (Accelerometers & Gyroscopes).
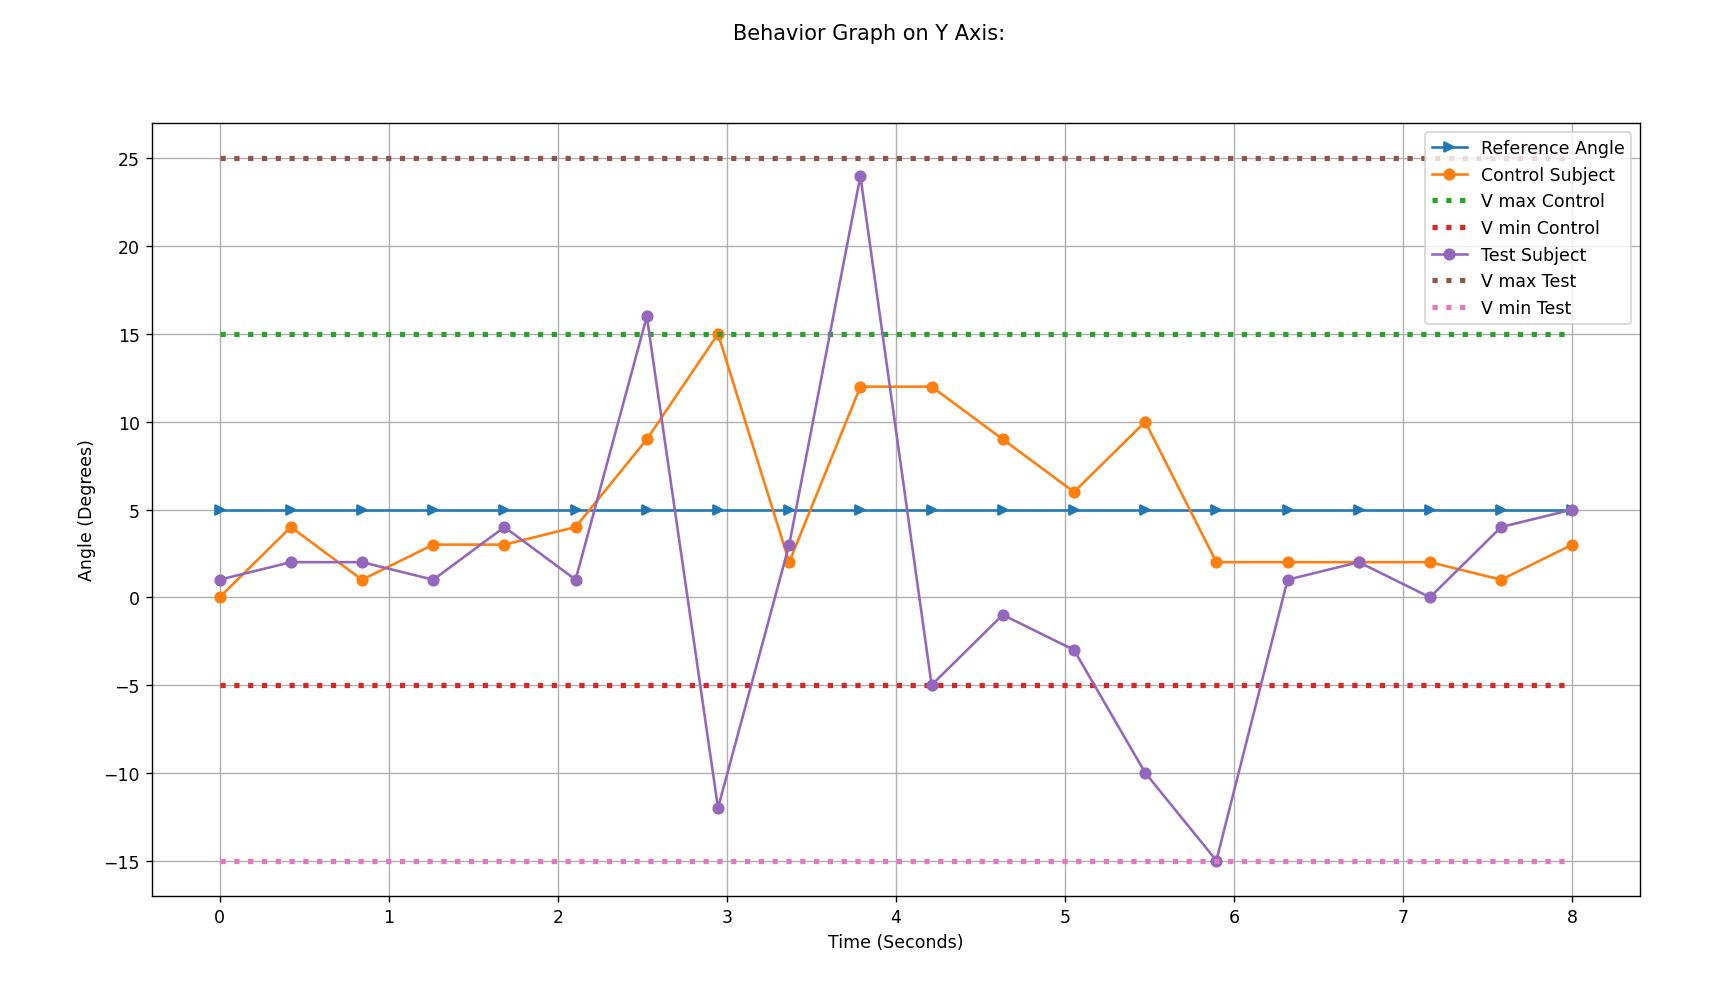
In this particular graph, you can see reference range for each subject (test and control subjects), the angle registered every 5 seconds in nodes connected by lines and the original reference angle that should be ideally reached to complete the workout routine.
The reference angle is determined by the trainer in order to indicate to the user in which position the sensor must be located in, so if I wished to perform a certain work-out and I wanted to let the user know that their leg must be placed at a 15° angle, I just need to change the reference value of the angle in the Y axis.
This is an auxiliary tool in data analysis that can be linked into the final project and deliver a more visually appealing result.
Here is a small video showing some graphs that thanks to the randomizer function can be easily diferentiated.