Input Devices
Week 11
Group assignment:
- Probe an input device's analog levels and digital signals
Group 1
Group 2
Group 3
Group 1:
- Cristian Loayza
- Silvana Espinoza
- Jose Alberto Rodriguez
- Maria Angela Mejia
- Hans Moncca
- Maryori Vasquez
Hans Moncca Contribution
PROBE AN INPUT DEVICE'S ANALOG LEVEL AND DIGITAL SIGNALS
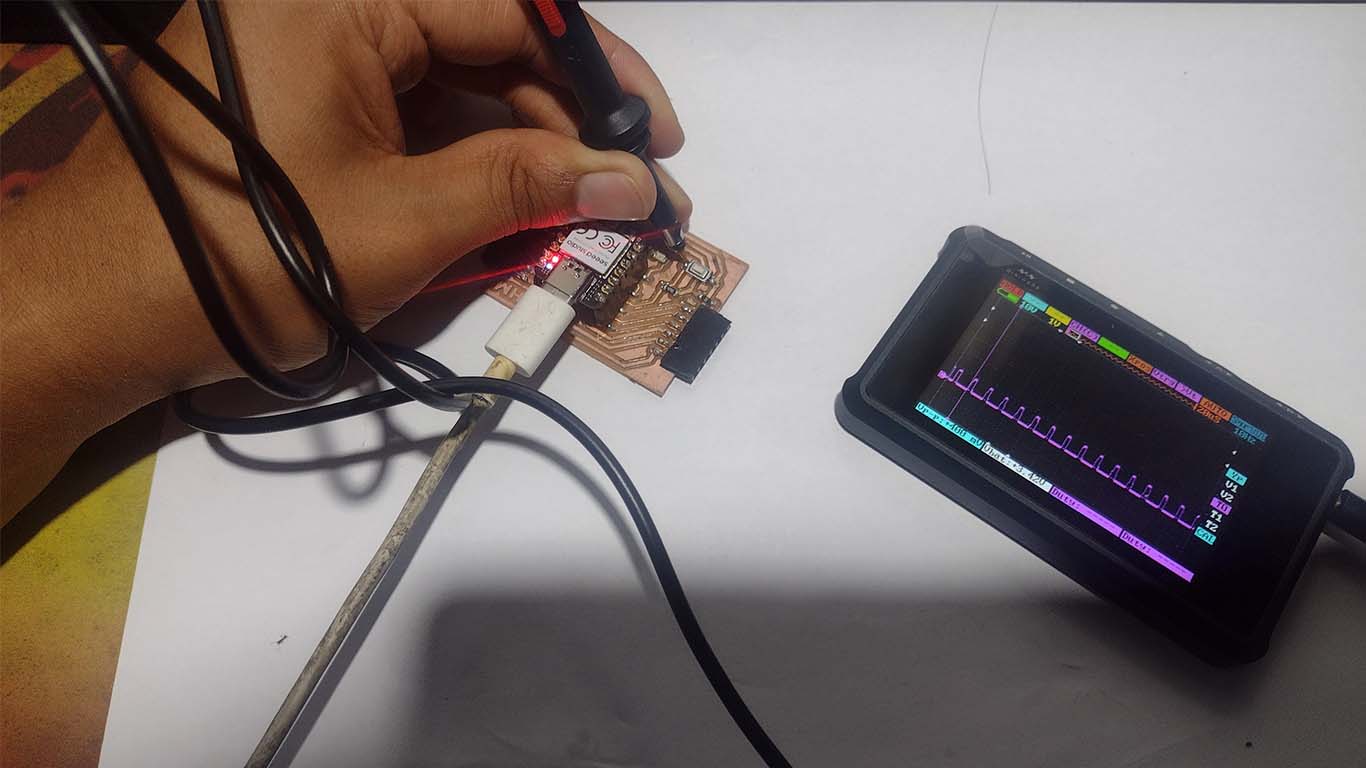
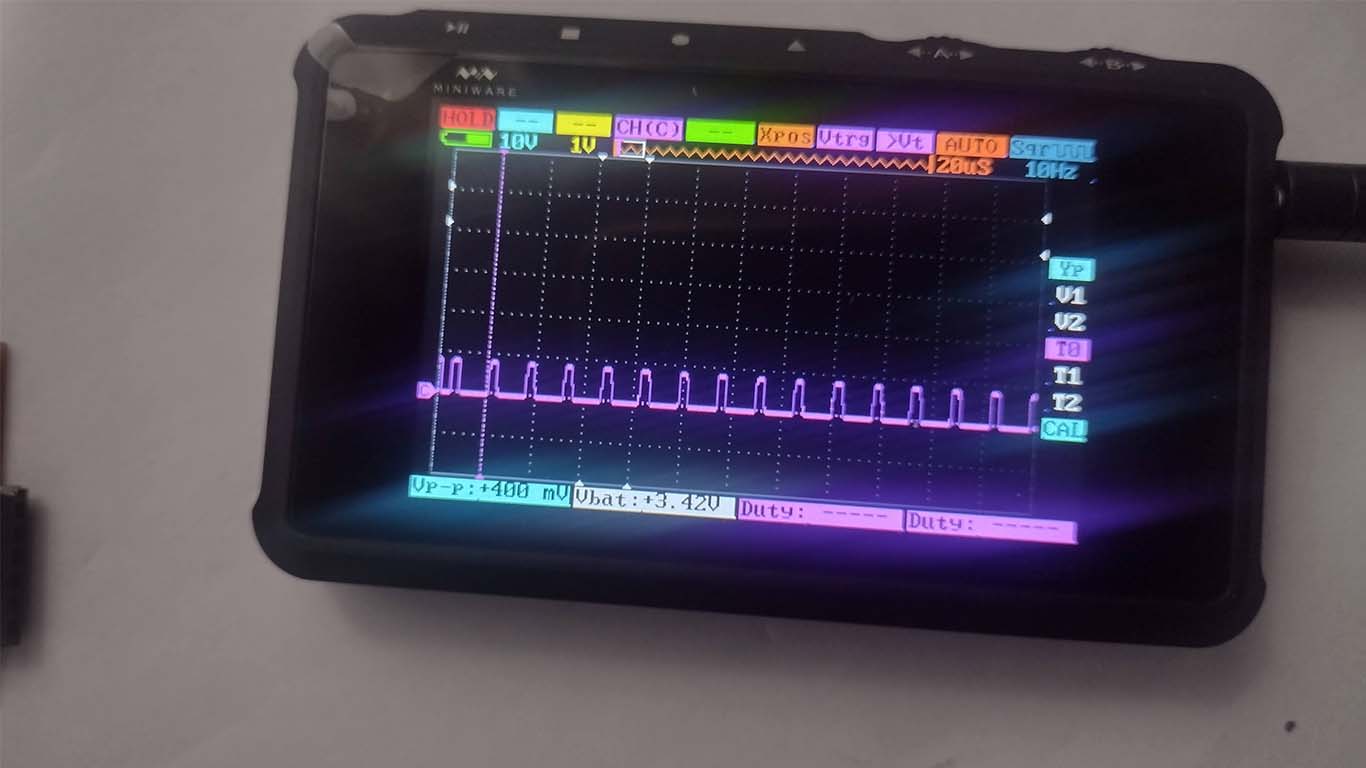
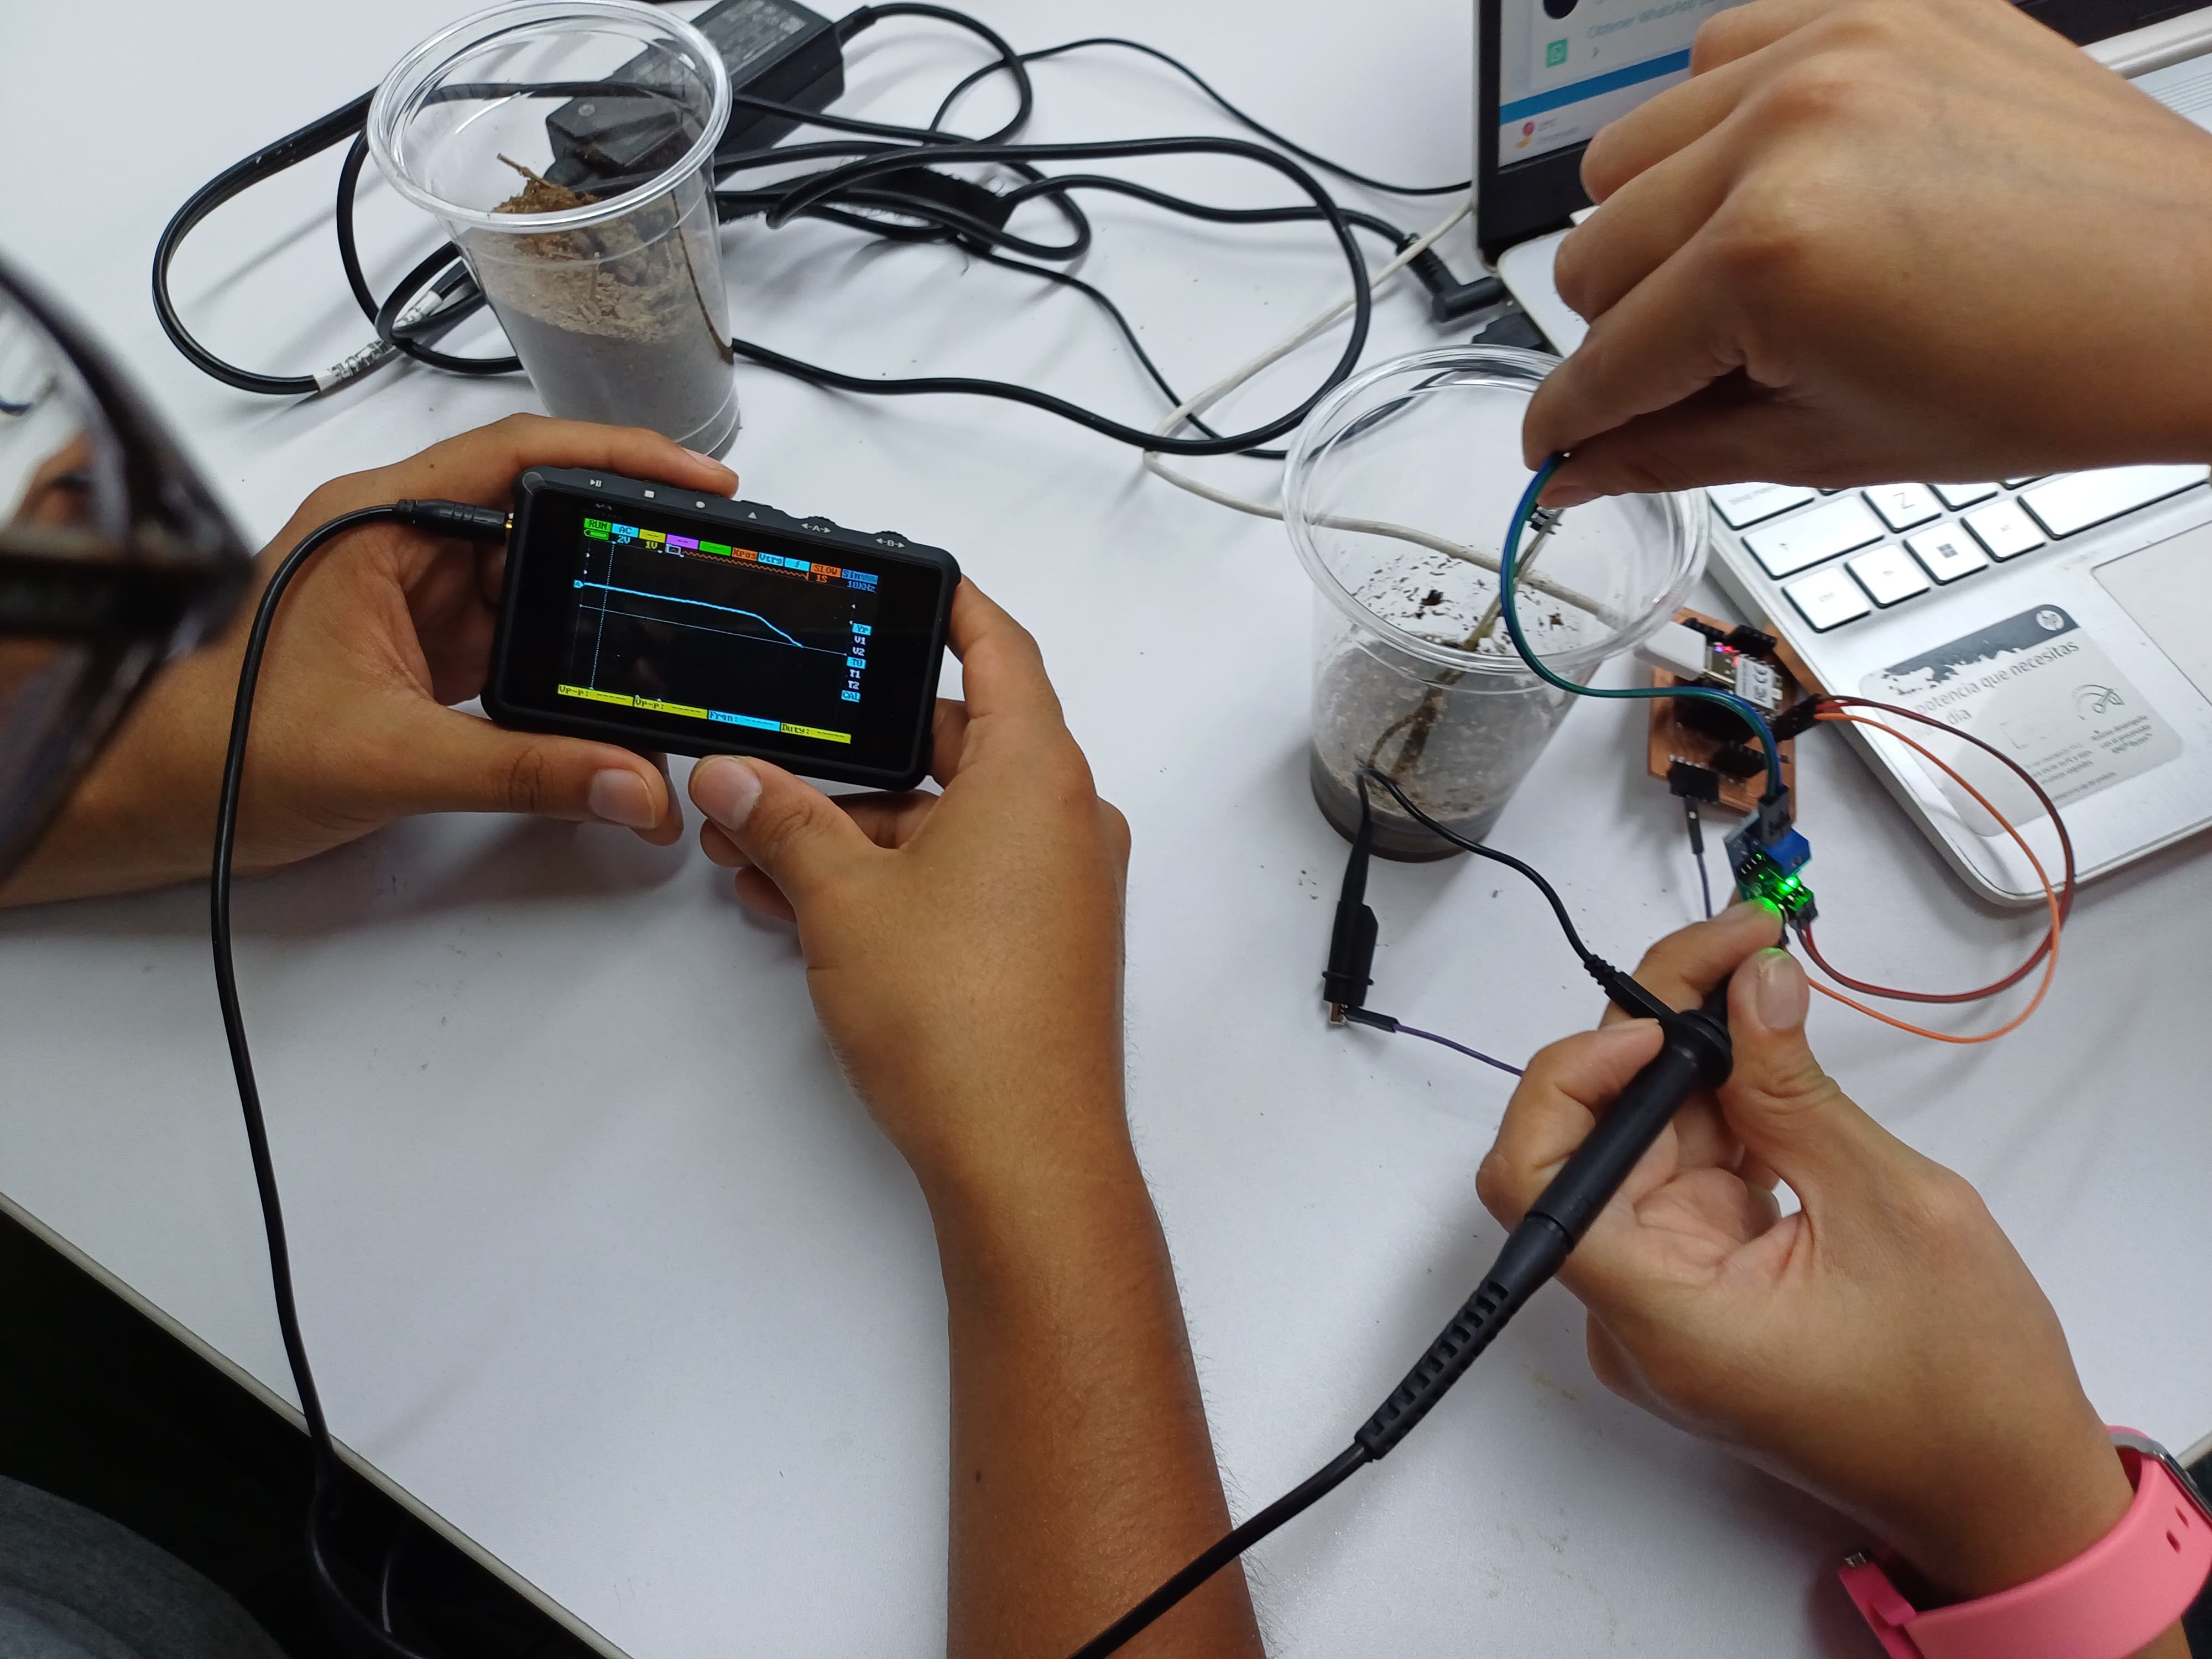
TIME OF FLIGHT ANALOG LEVEL
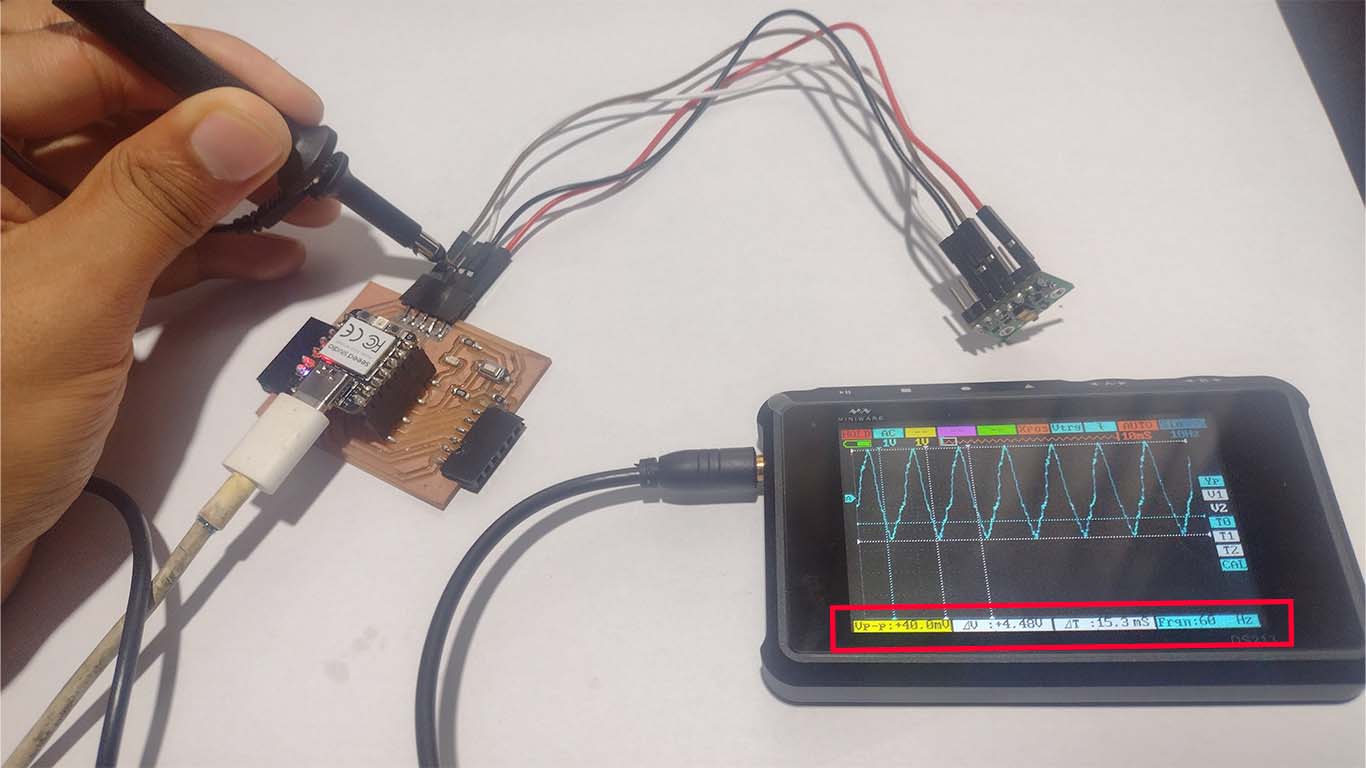
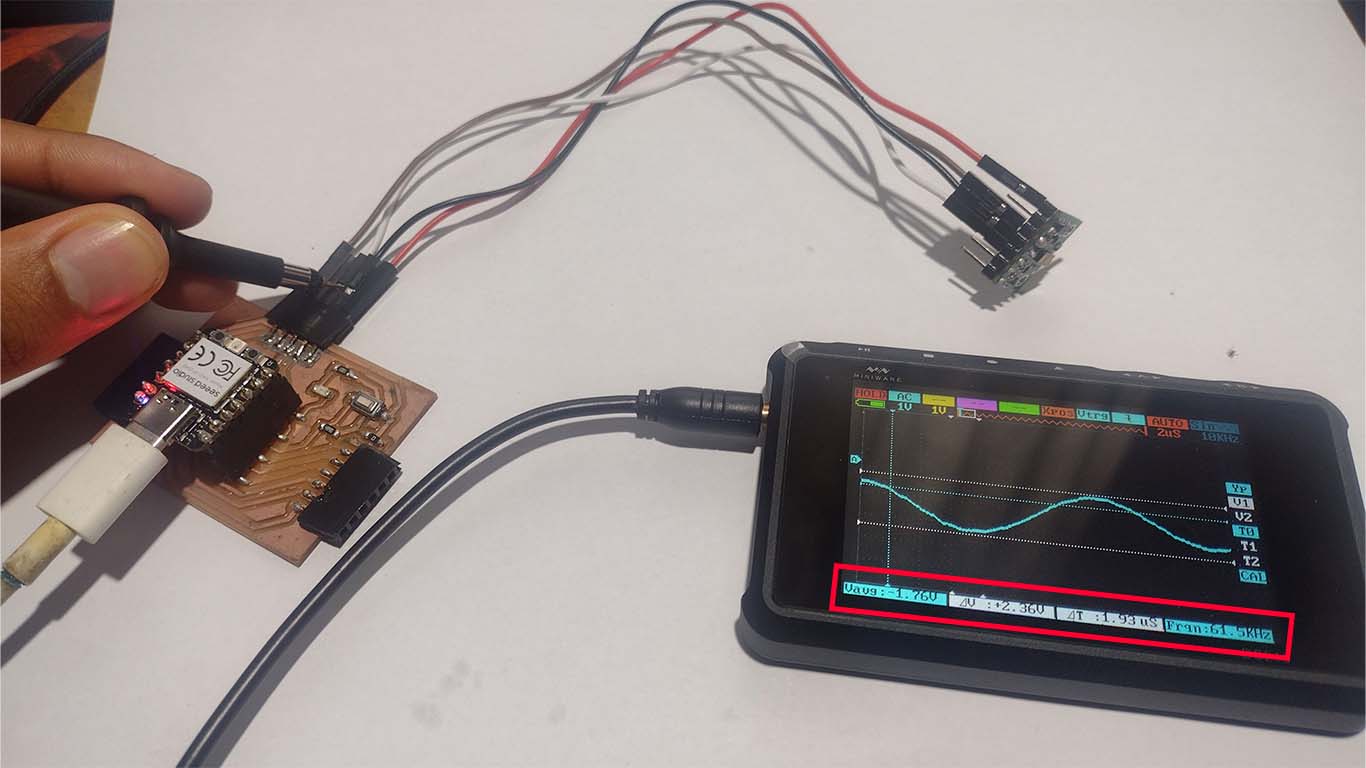
For the group assignment, we met with my colleagues from FAB LAB PERÚ and we will carry out the measurements of the analog level and 2-input digital signal that we chose. First we will work with the Time of Flight Distance to see the analog level behavior and then we will try with a switch that turns on an LED as a digital signal. The tool we will use is the DS213 oscilloscope that we have at the FAB LAB UCSUR.
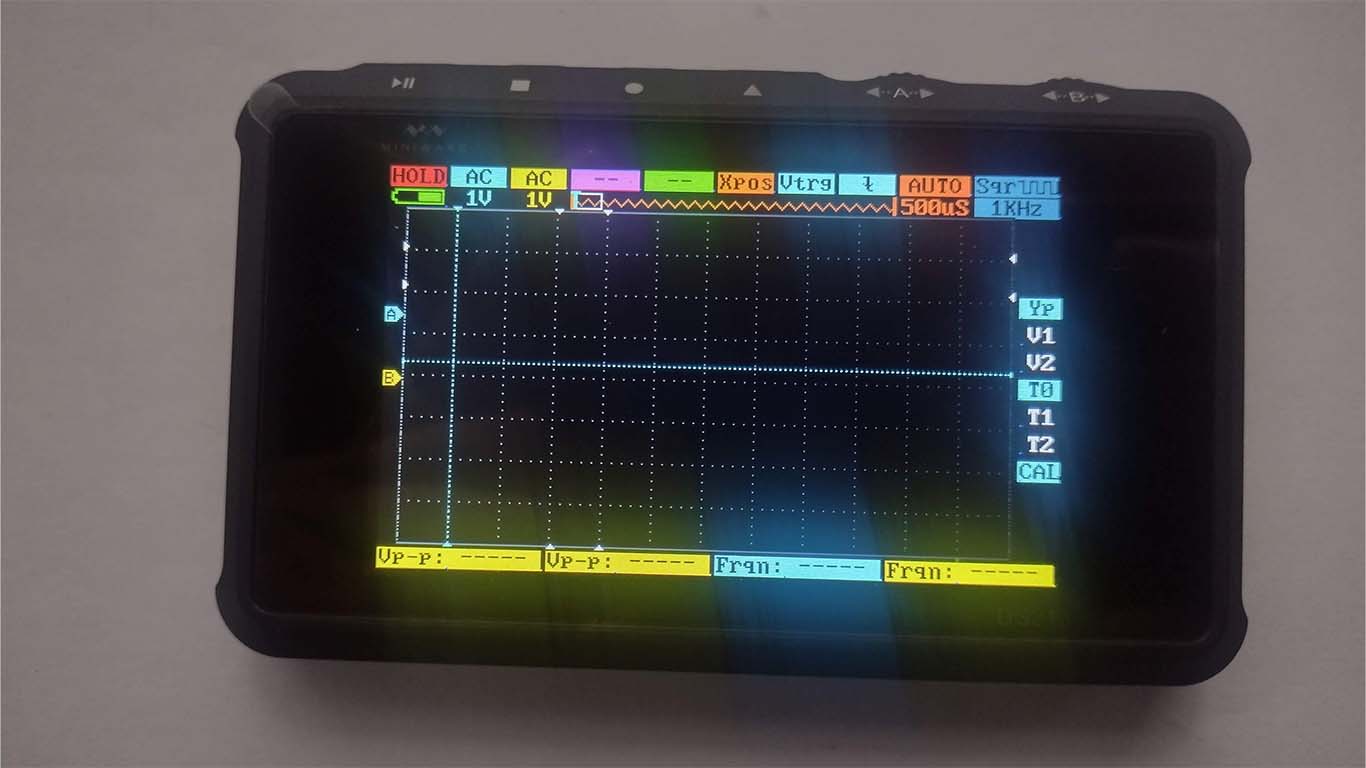
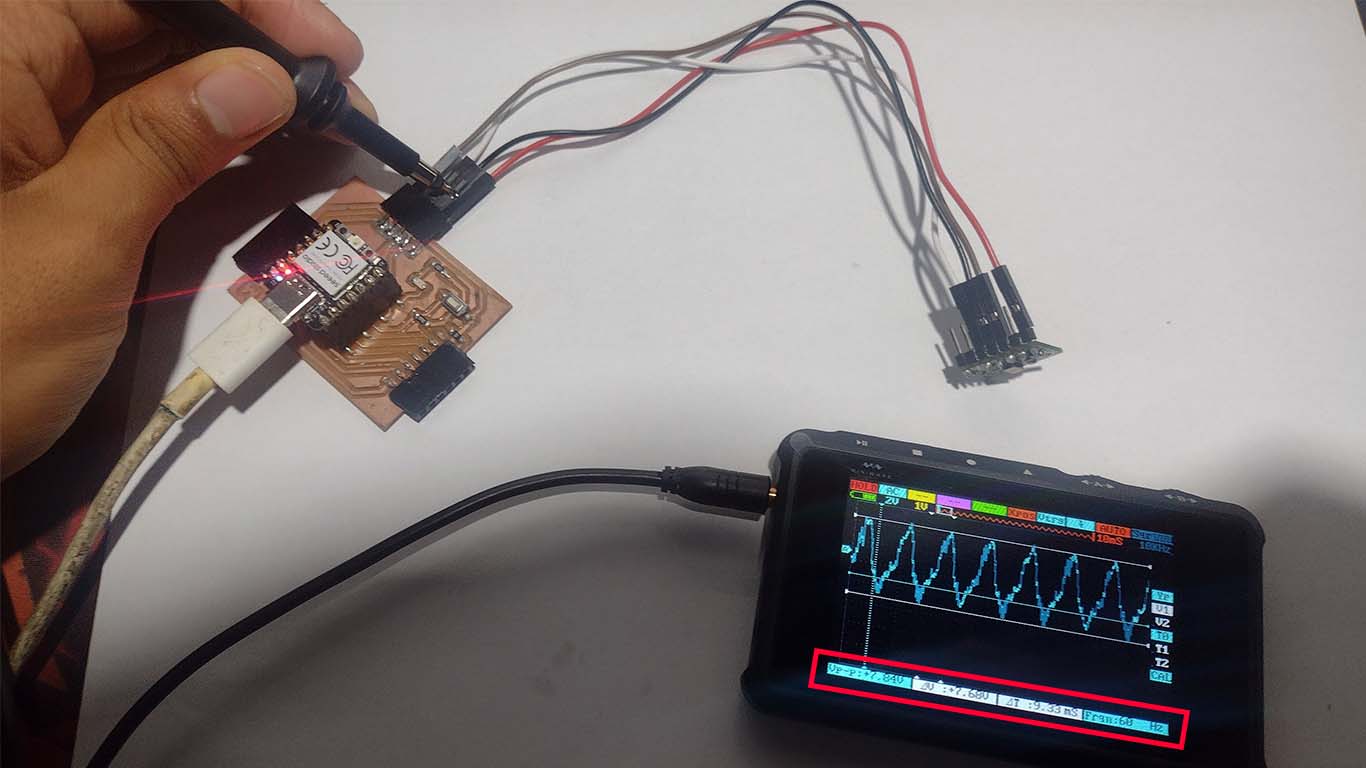
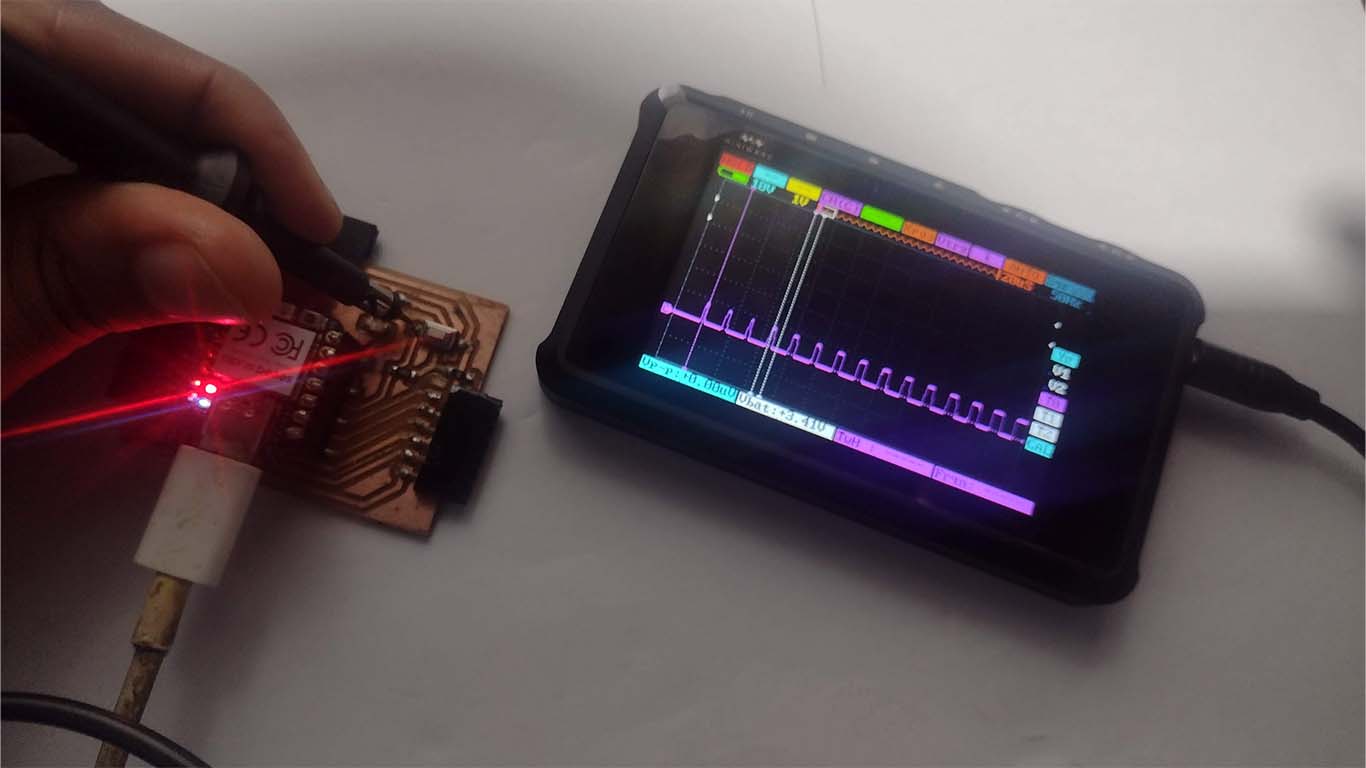
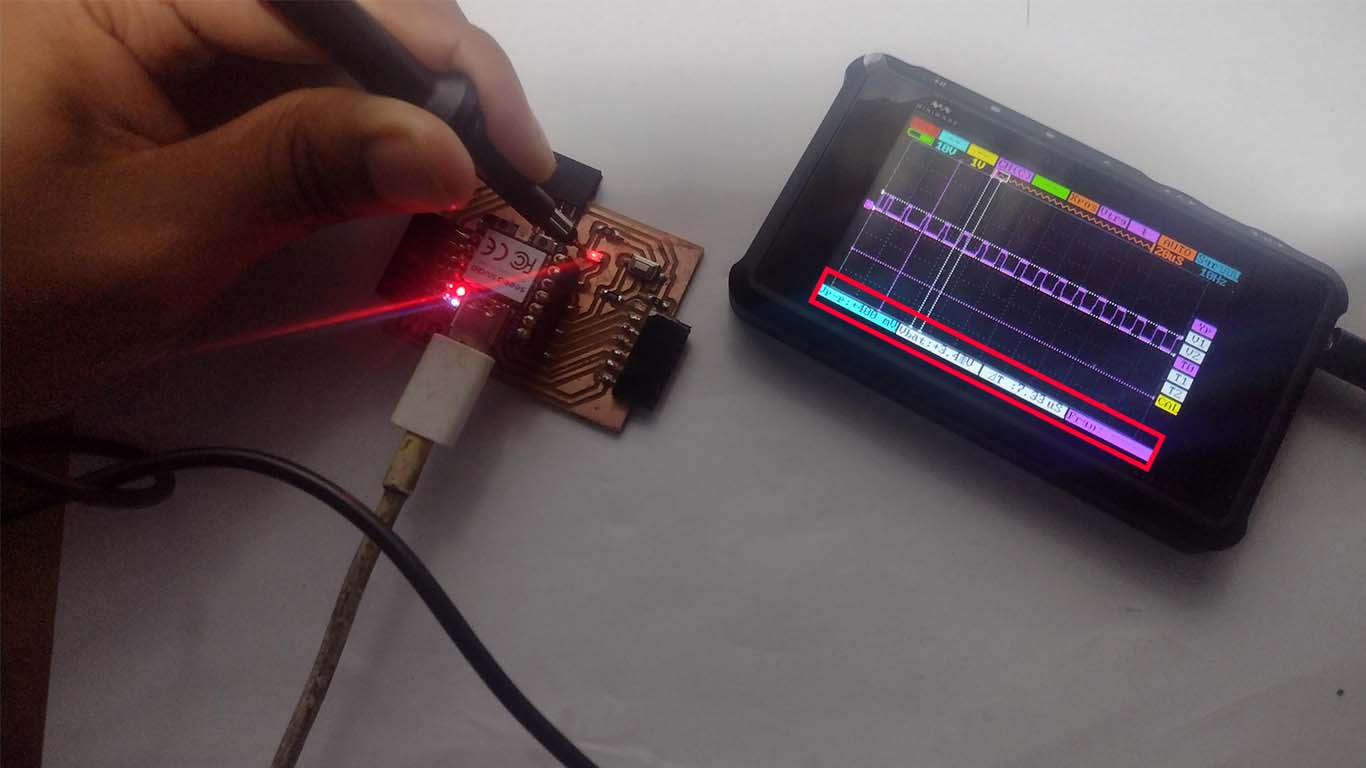
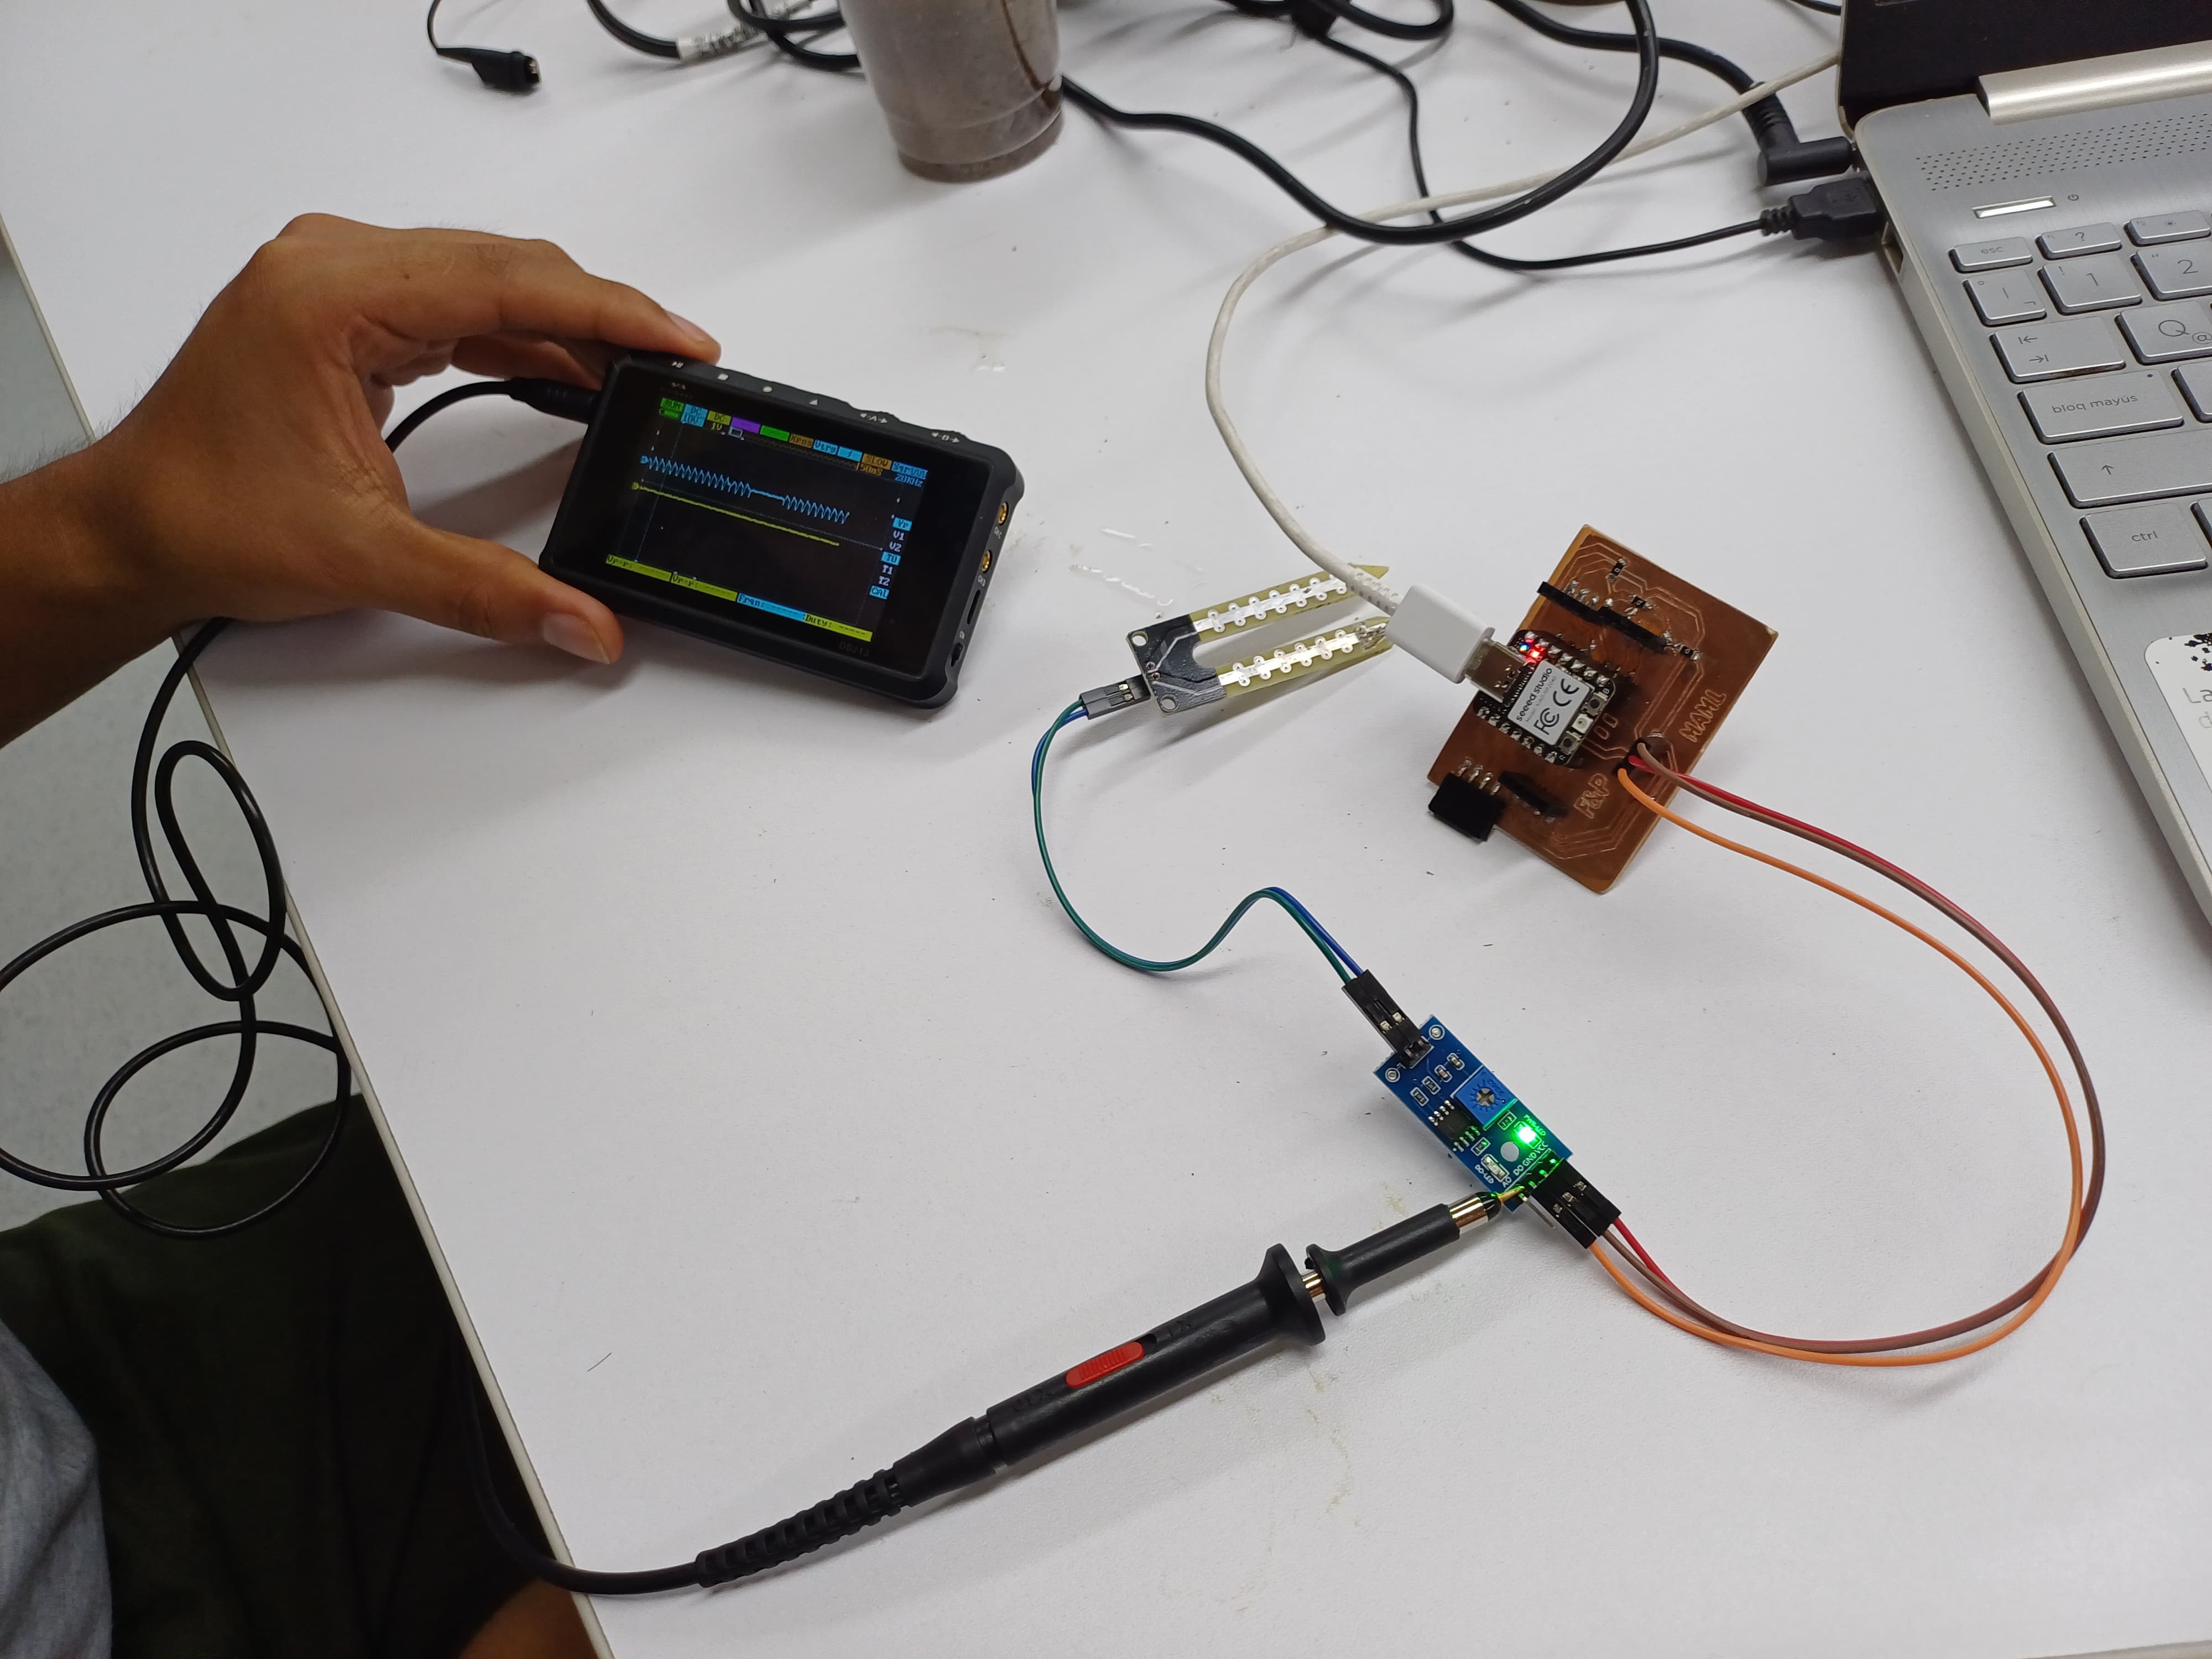
DIGITAL SIGNALS - SWITCH
For the group assignment, we met with my colleagues from FAB LAB PERÚ and we will carry out the measurements of the analog level and 2-input digital signal that we chose. First we will work with the Time of Flight Distance to see the analog level behavior and then we will try with a switch that turns on an LED as a digital signal. The tool we will use is the DS213 oscilloscope that we have at the FAB LAB UCSUR.
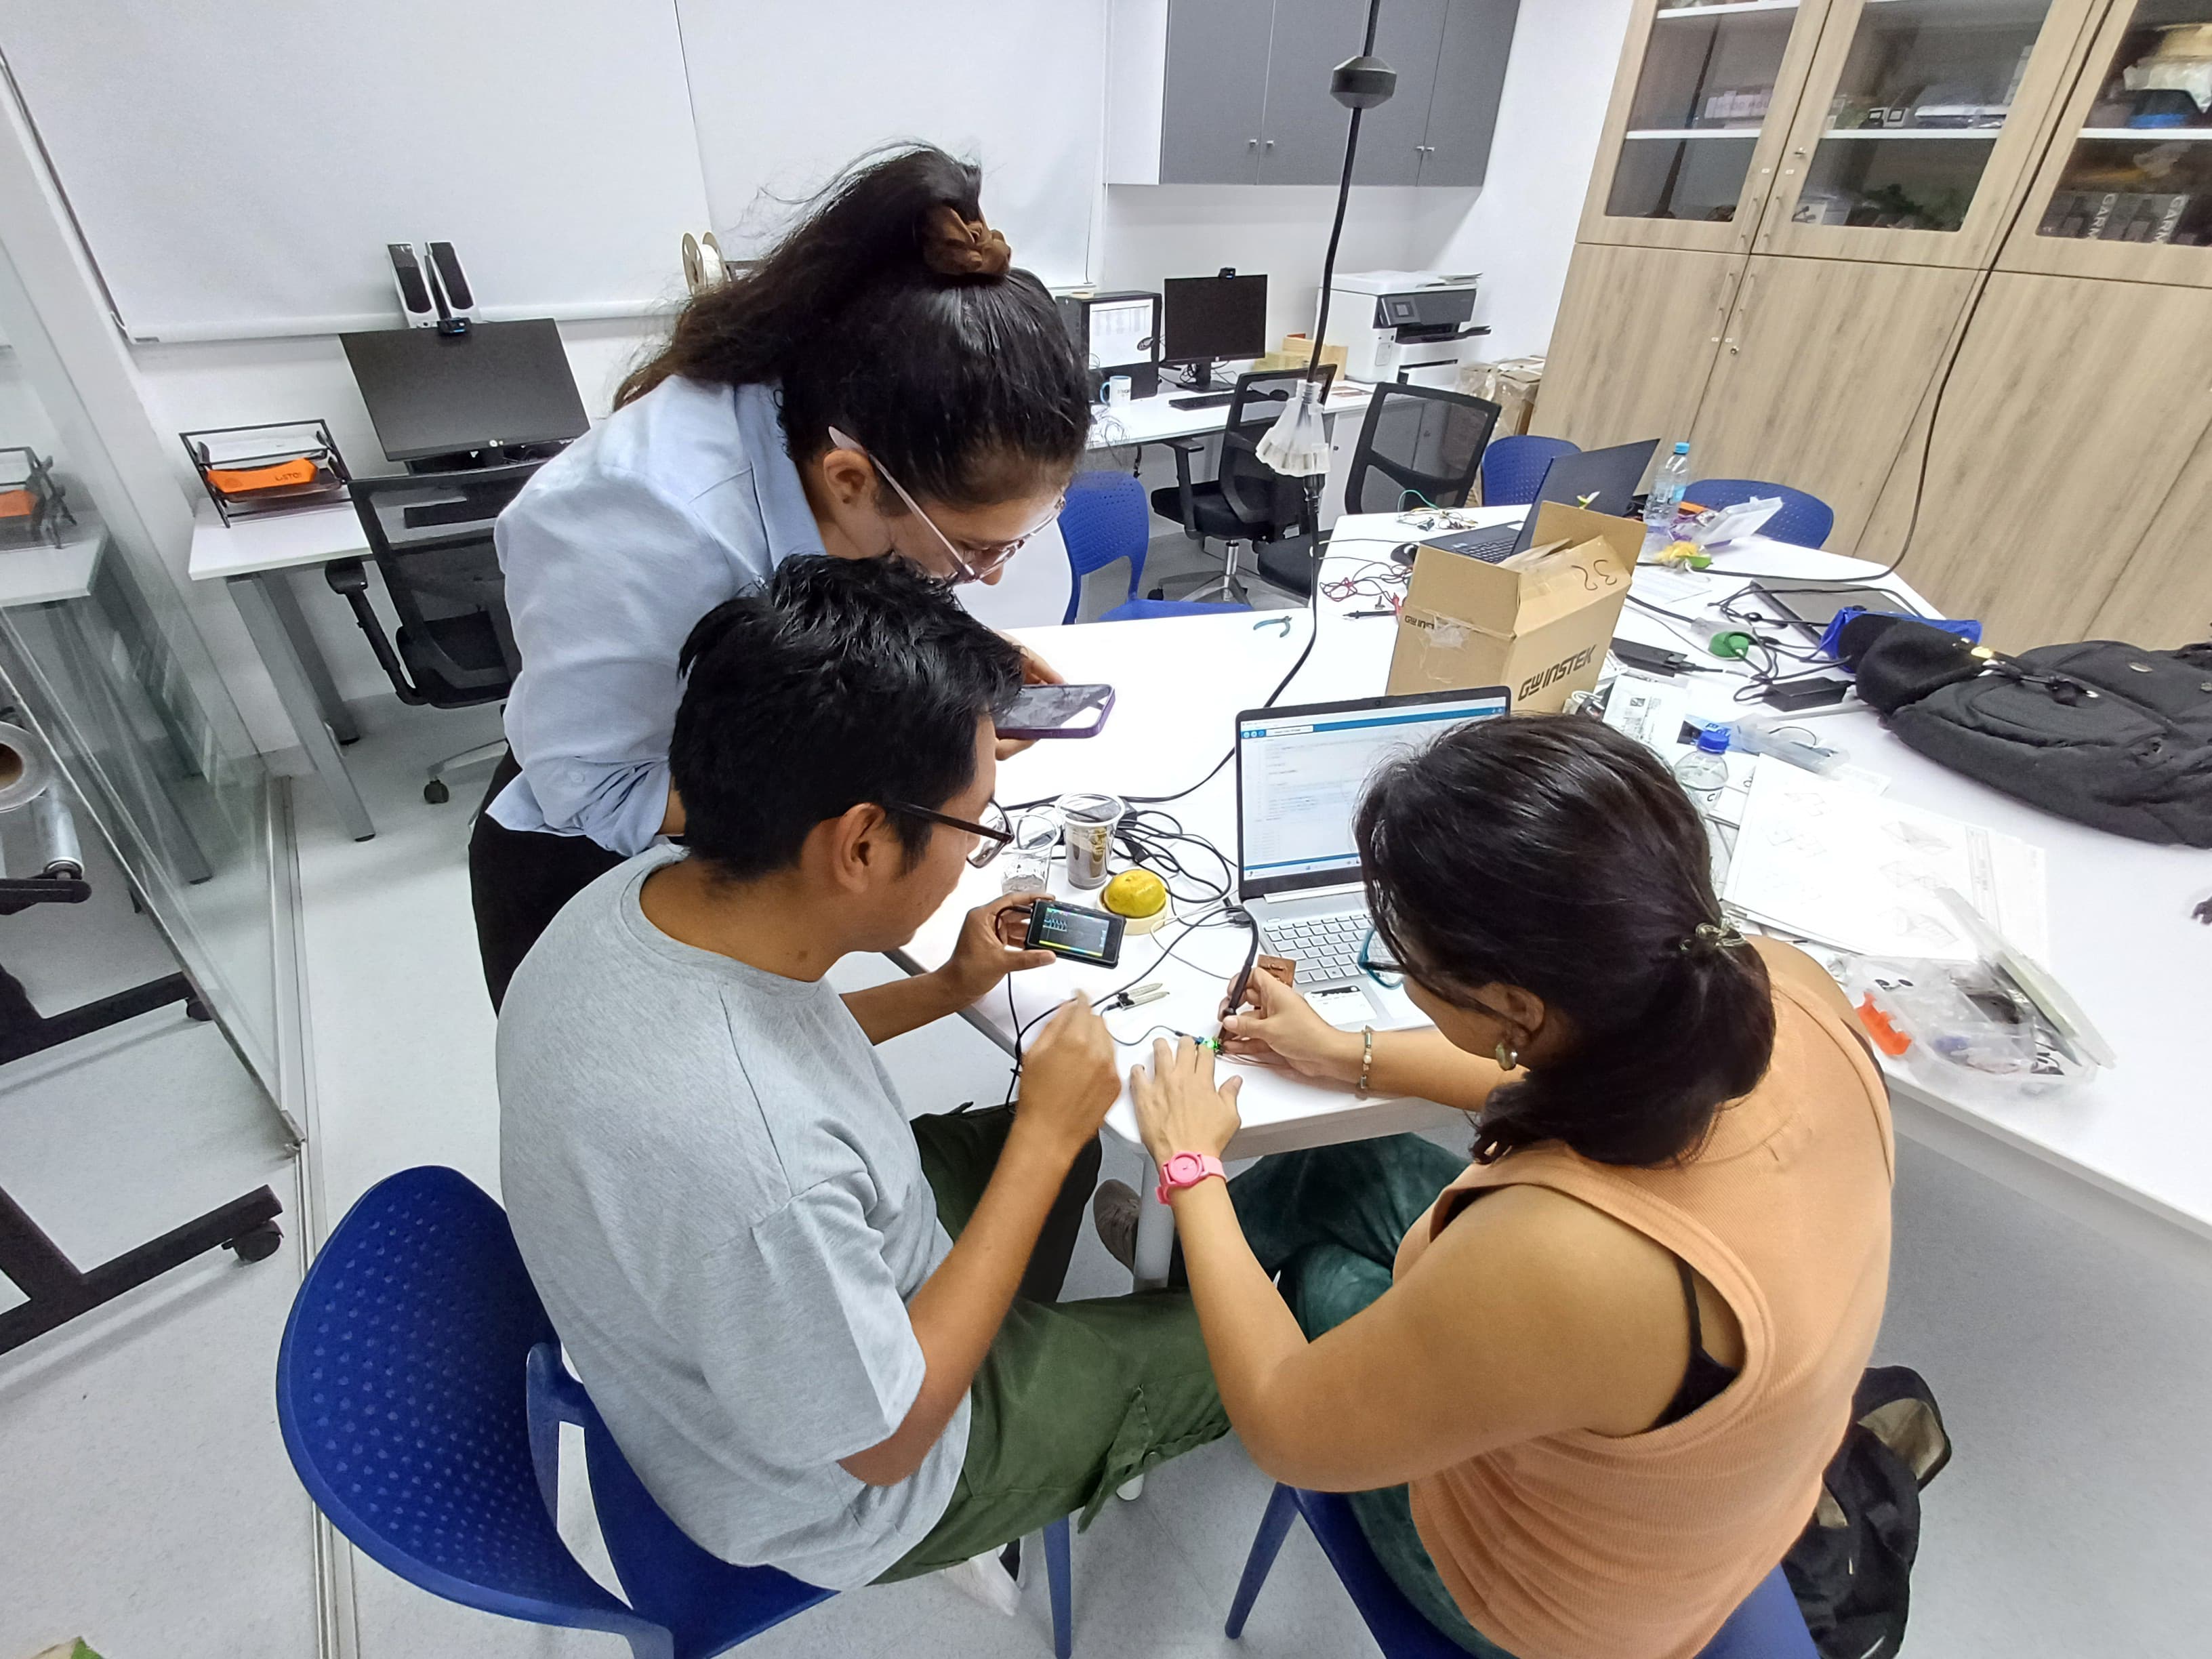
CONCLUSION
One more week of teaching and a lot of practice to understand a very complex world like electronics. This week I can conclude that I learned a lot about digital and analog signals. Now I understood the difference much more and we can see them in a "real" way on instruments like the oscilloscope. Finally, I can conclude that we must take into account that each INPUT has its characteristics and know if it is DIGITAL or ANALOG. From there, we can understand how it works, connect to the correct PINS of our microcontrollers to make better use of them and ensure they function better. Here is a group photo with my FAB LAB colleagues, each with the inputs seen and reviewed for the week.
March 23
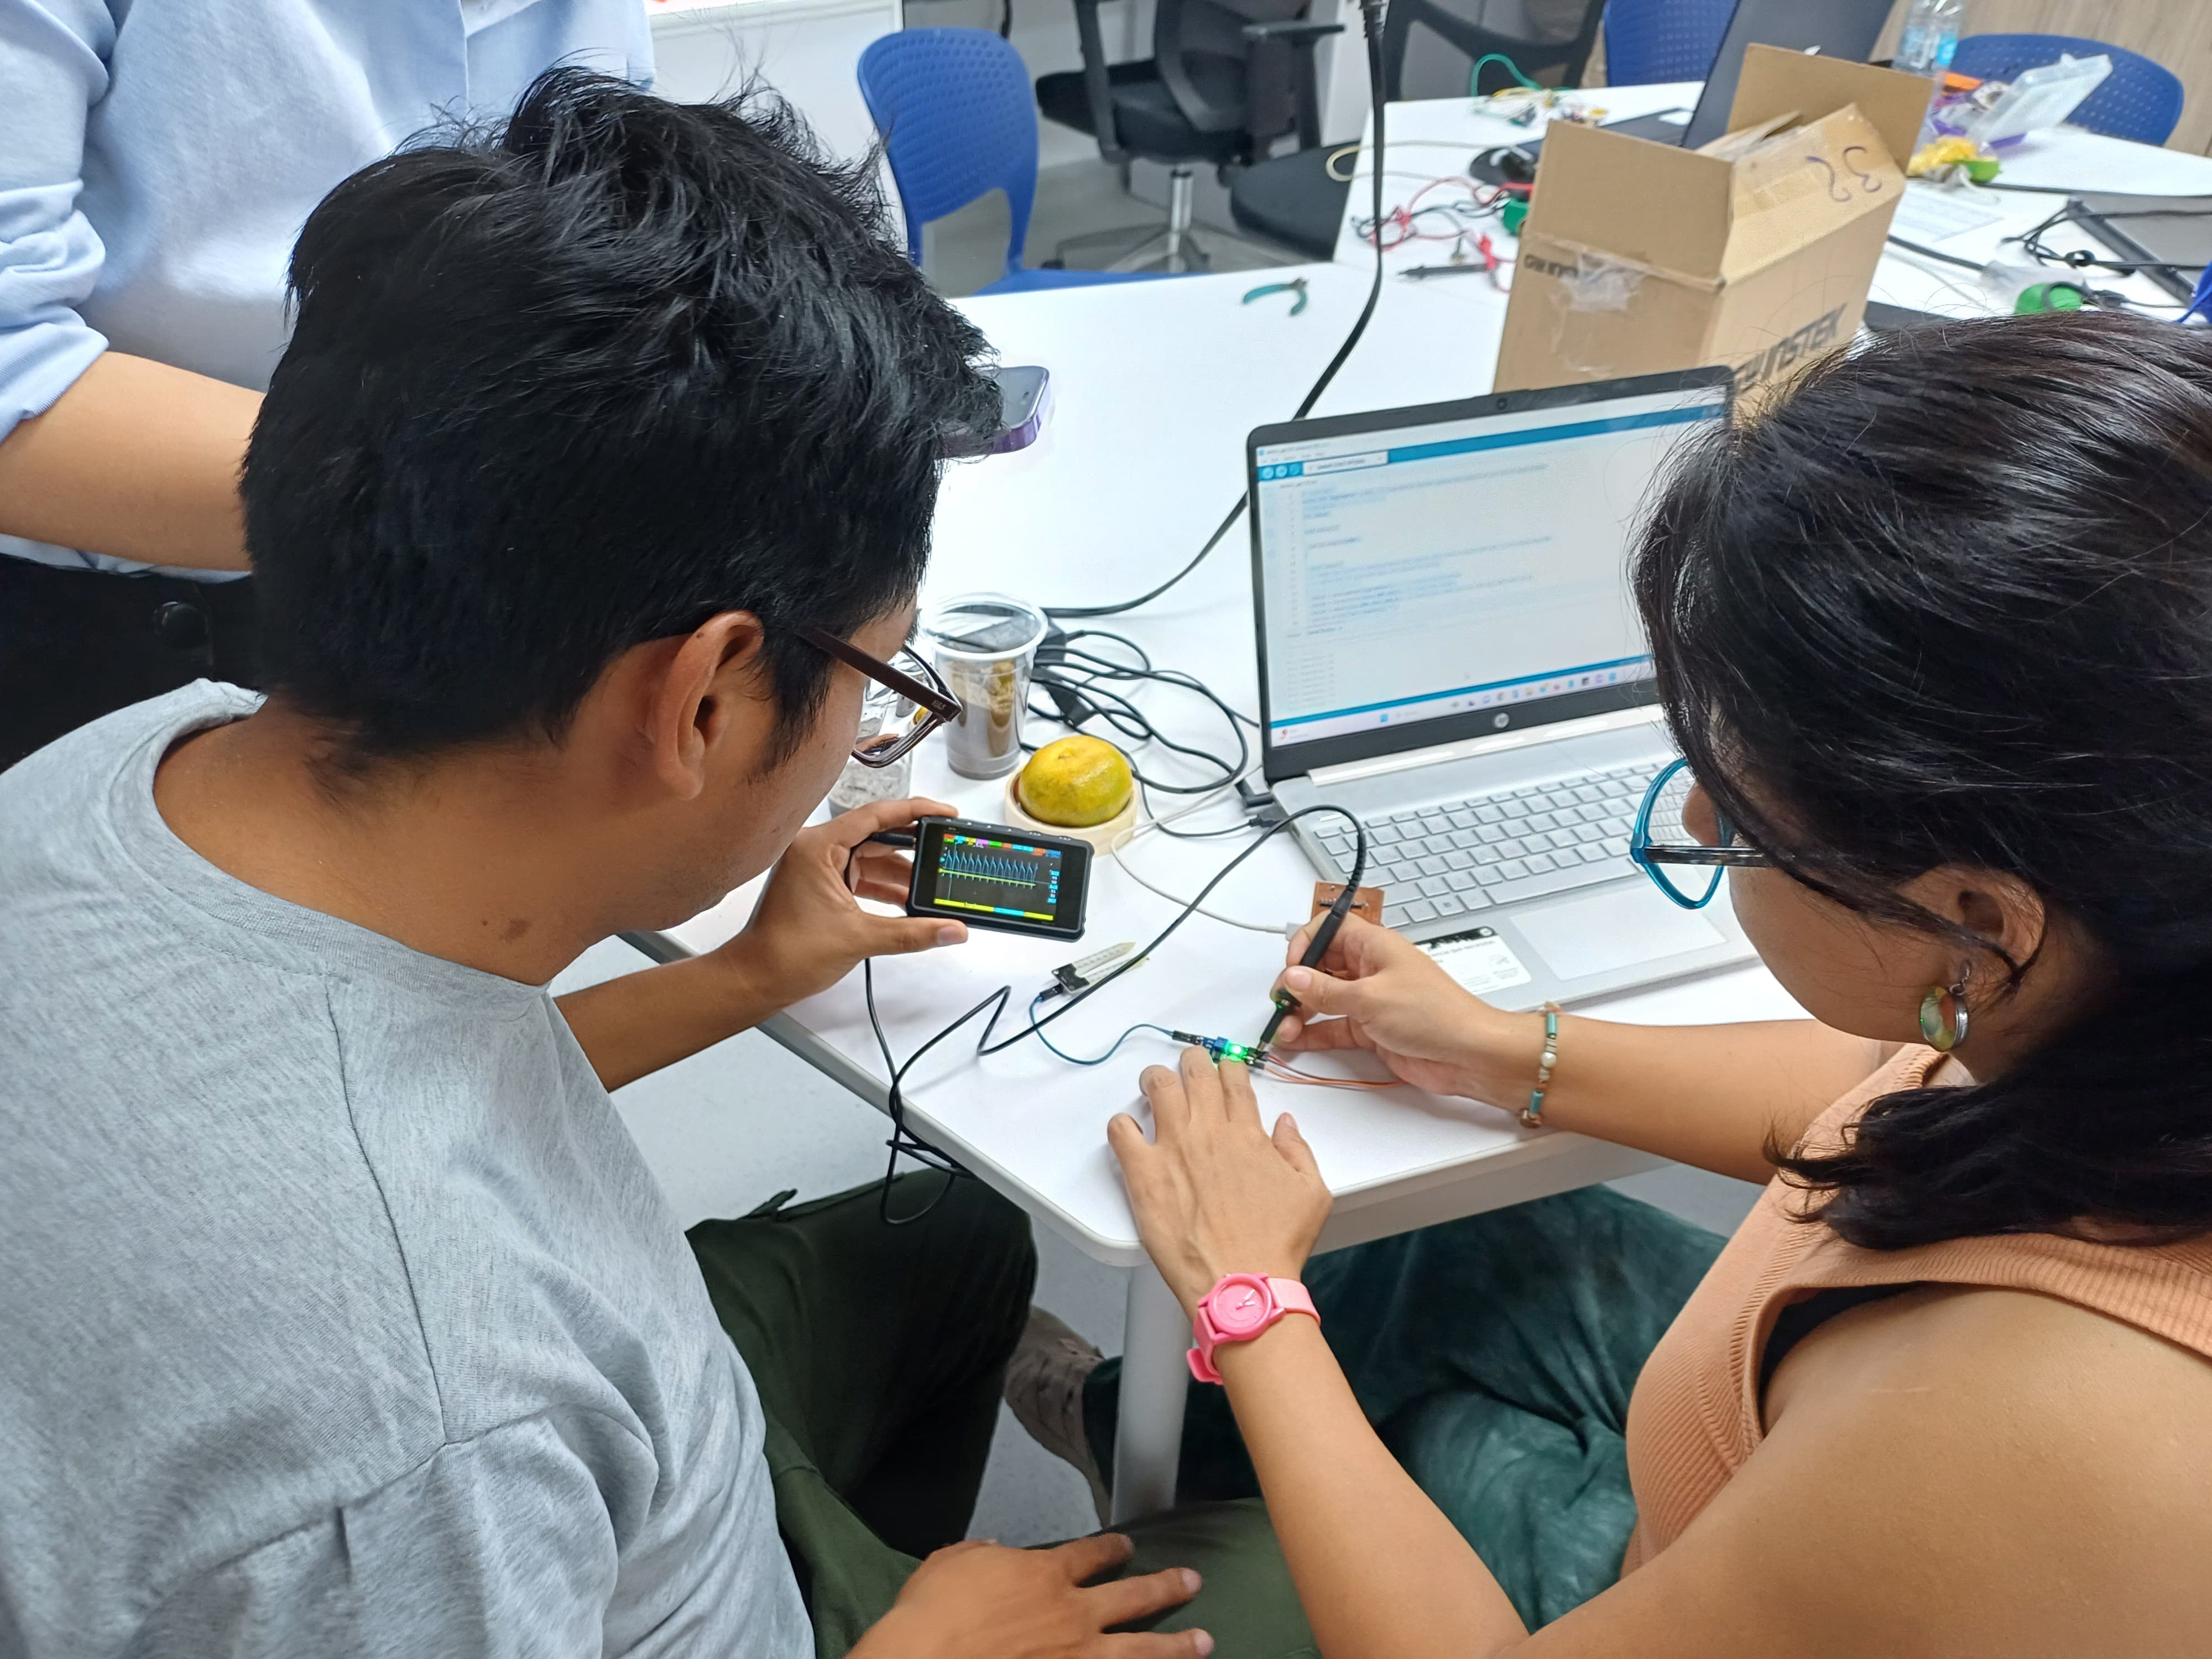
We went to UCSUR (Universidad Cientifica del sur), we all started to see what sensors we have, we saw how they work, each one brought his programming for his sensor and we could do the tests.
Hans was setting up the oscilloscope to start measuring the sensor signals.
Group 2:
- Renson Samaniego
- Wilber Giron
- Ronal Noel
Ronal Vilca Apolinar
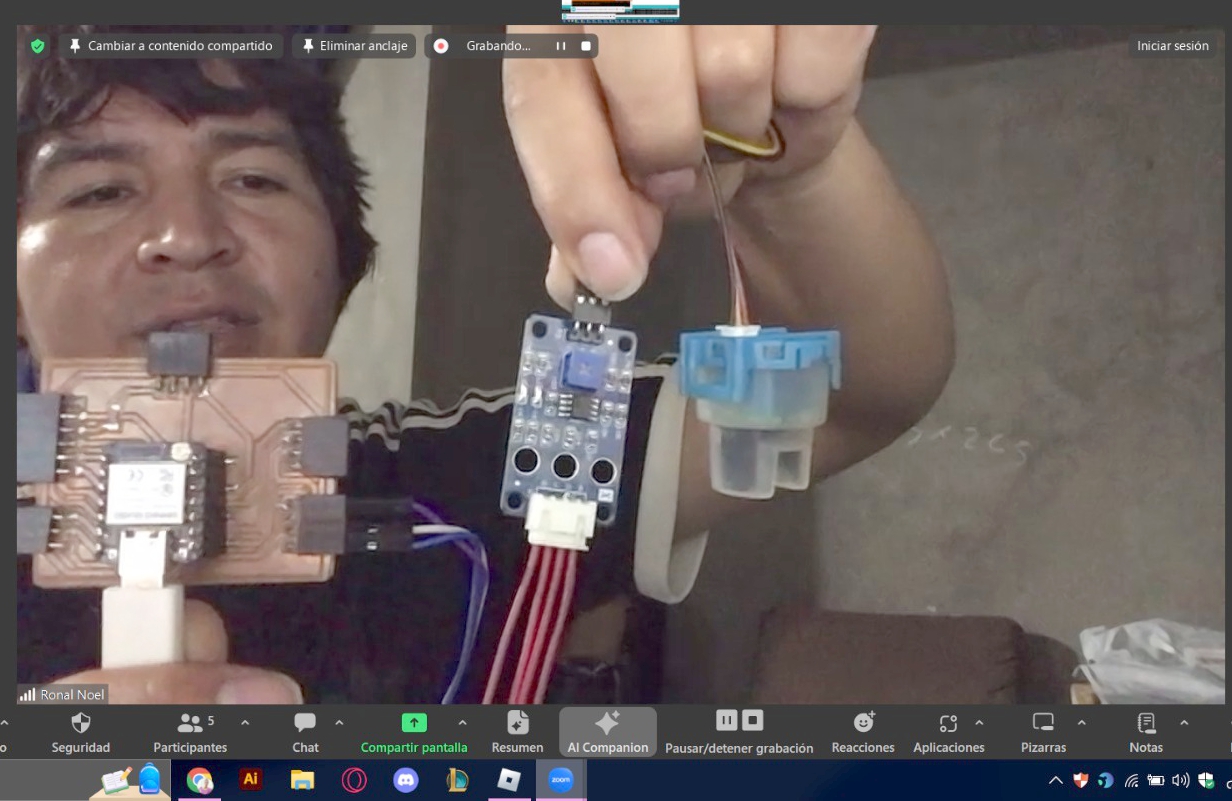
This week, we carried out group work in which each team member used their own sensors, maintaining an online connection throughout the process. We used the Zoom platform to meet, which allowed us to discuss and carry out tests with different sensors. In my case, I focused on the turbidity sensor and we were able to work collaboratively to obtain effective results.
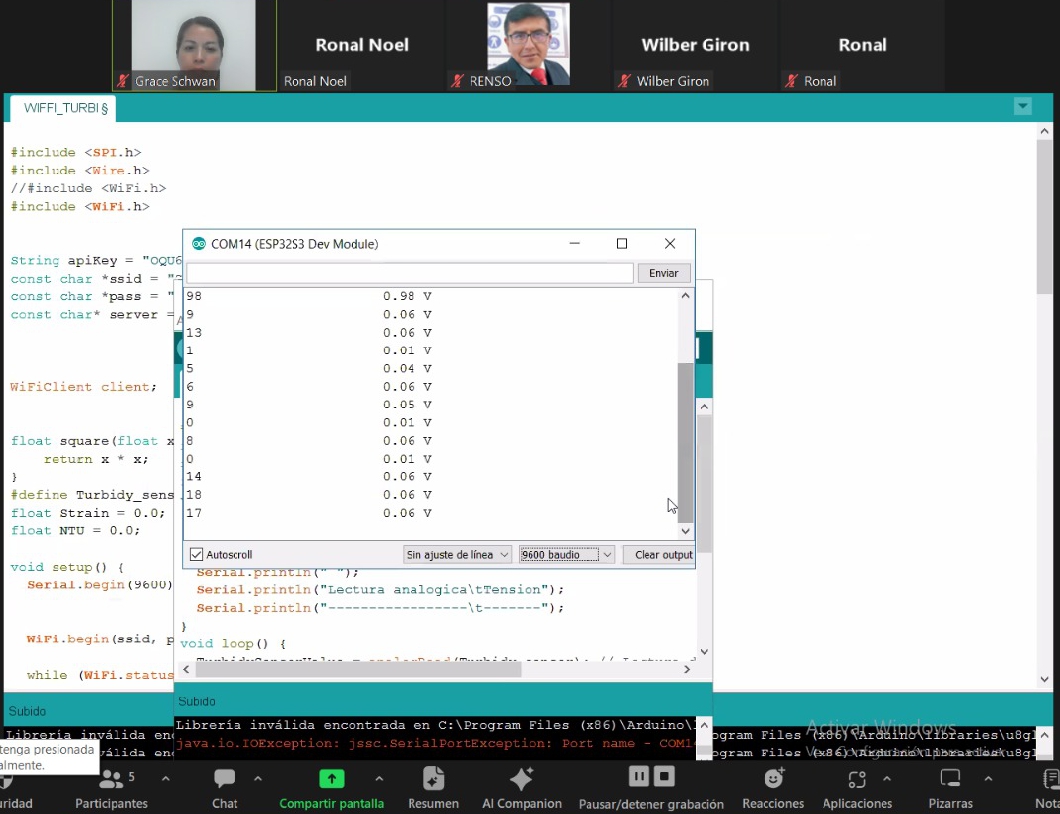
To analyze this data, we performed the test using the Arduino IDE development environment and the following code, as part of our first job.
Code
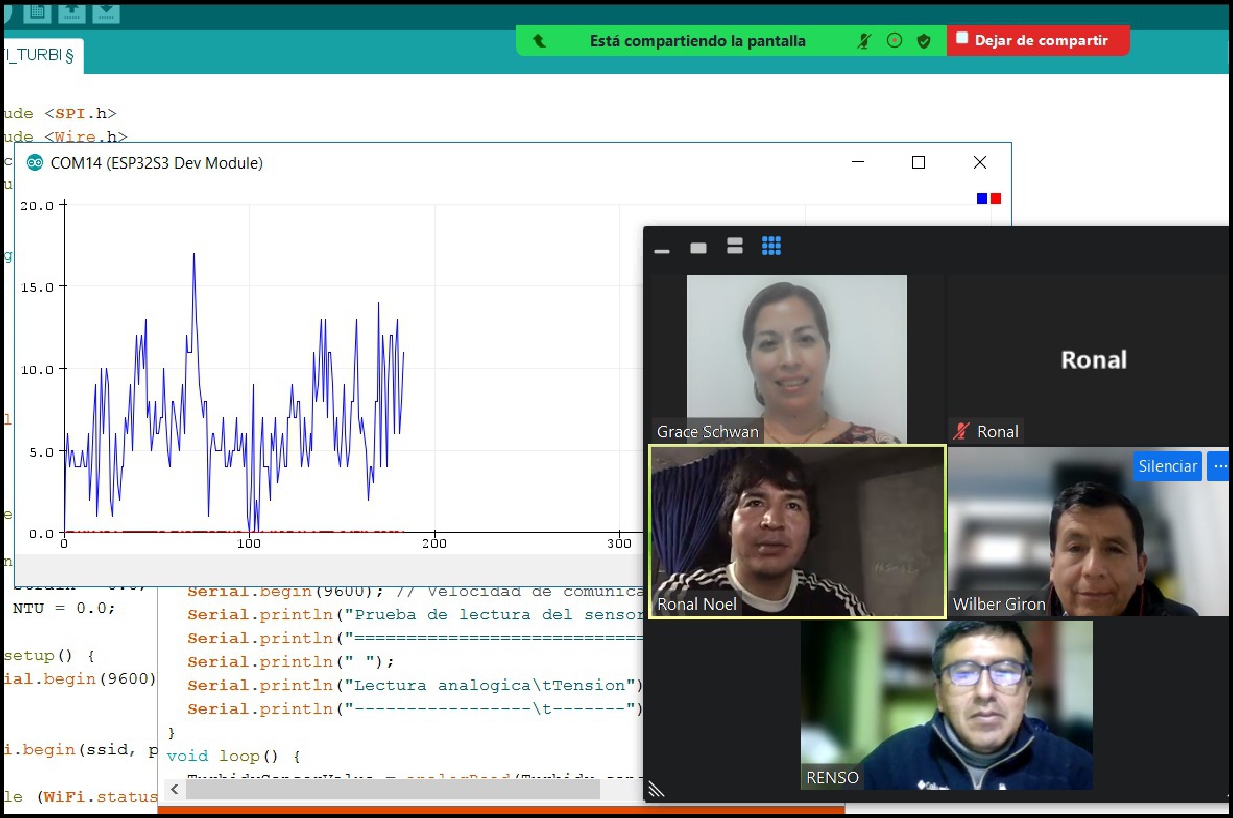
These are the results we obtained after uploading them to the XIAO, which allowed us to perform a more detailed analysis of the collected data.
Photoresistor
An exciter or photoresistor is an electronic component whose resistance changes (normally decreases) with increasing intensity of incident light.1 It can also be called a photoconductor, photoelectric cell or light-dependent resistor, whose acronym, LDR, originates from from its English name light-dependent resistor. Its body is made up of a photoreceptor cell and two pins. The following image shows its electrical symbol.
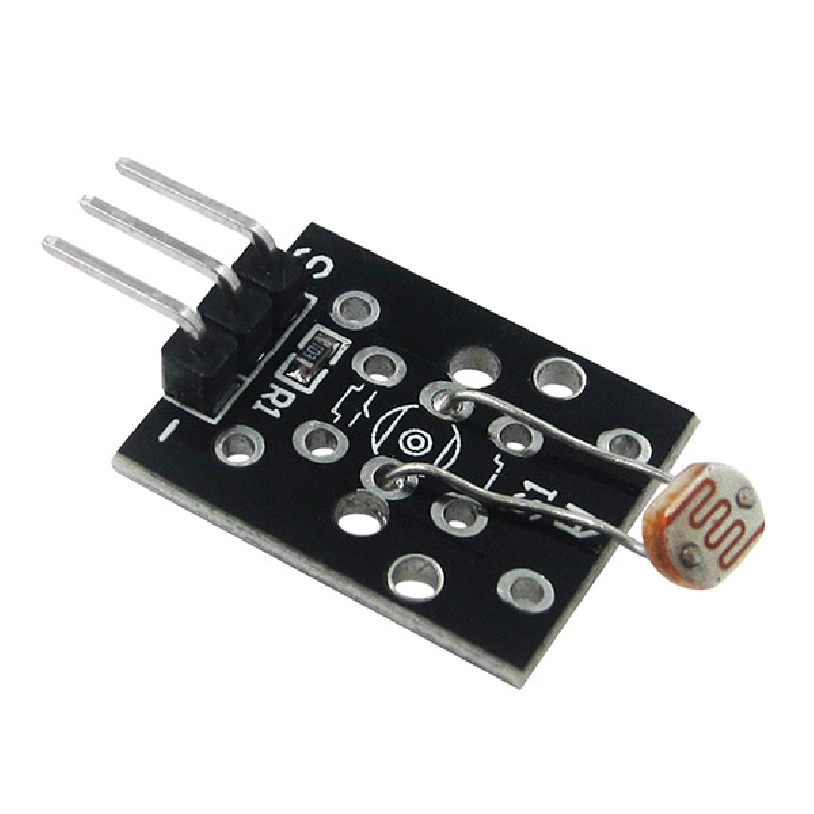
Its operation is based on the photoelectric effect. A photoresistor is made of a high-resistance semiconductor such as cadmium sulfide, CdS. If the light incident on the device is of high frequency, the photons are absorbed by the elasticities of the semiconductor giving the electrons sufficient energy to skip the driving band. The resulting free electron and its associated hole conduct electricity, thereby decreasing resistance. Typical values range from 1 MΩ or more in the dark to 100 Ω in bright light.
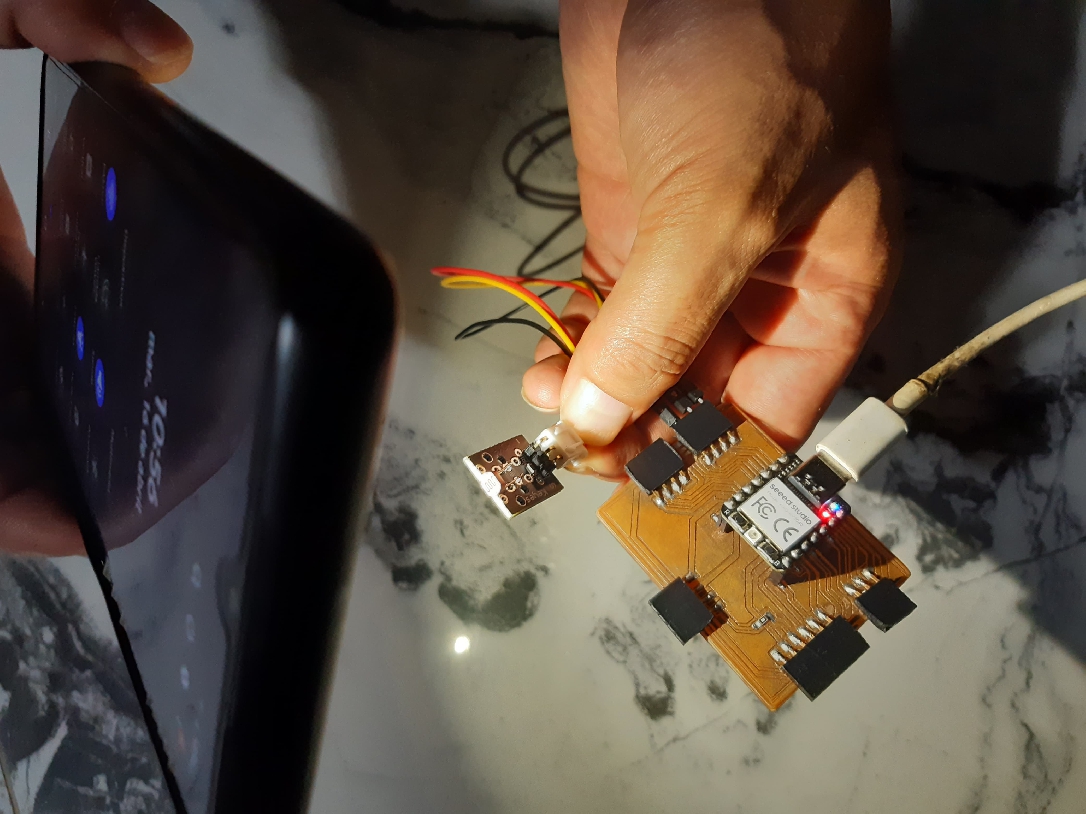
Component Inventory
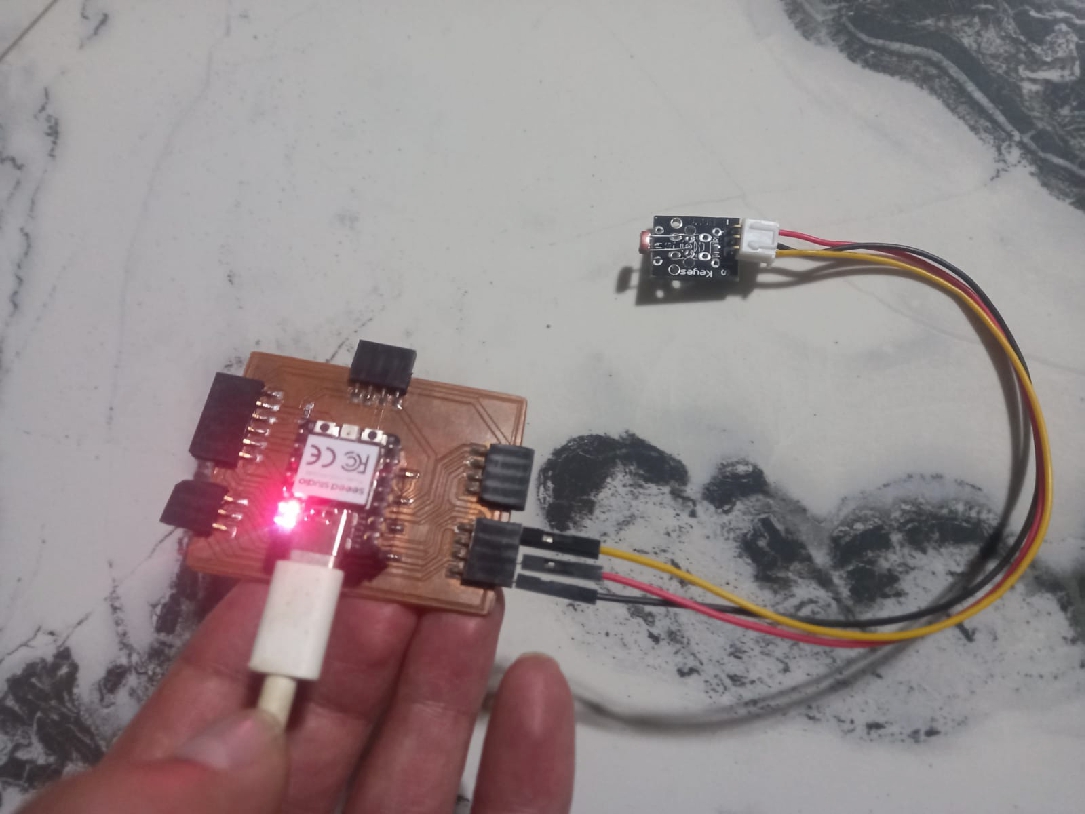
- Motherboard for the Xiao
- Xiao RP2040
- Photoresistor Sensor
The next step involves uploading the code that interprets the sensor values, allowing us to obtain accurate readings and better understand the data collected.
Code
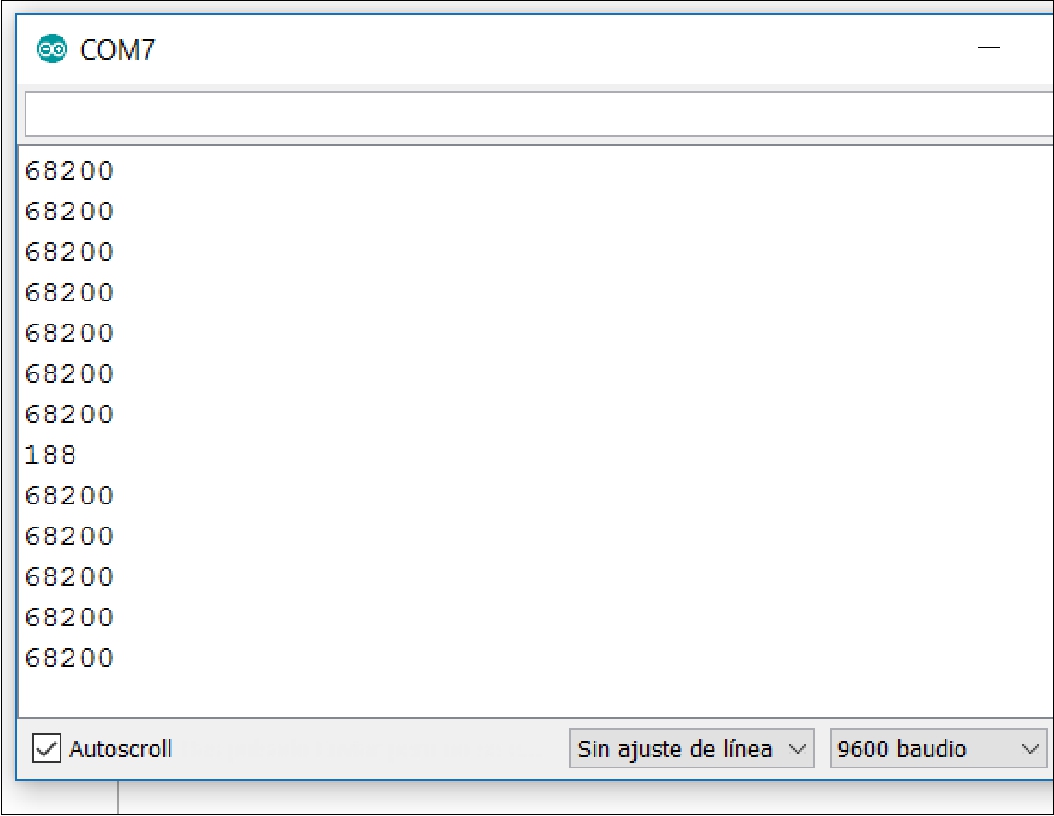
Case 1
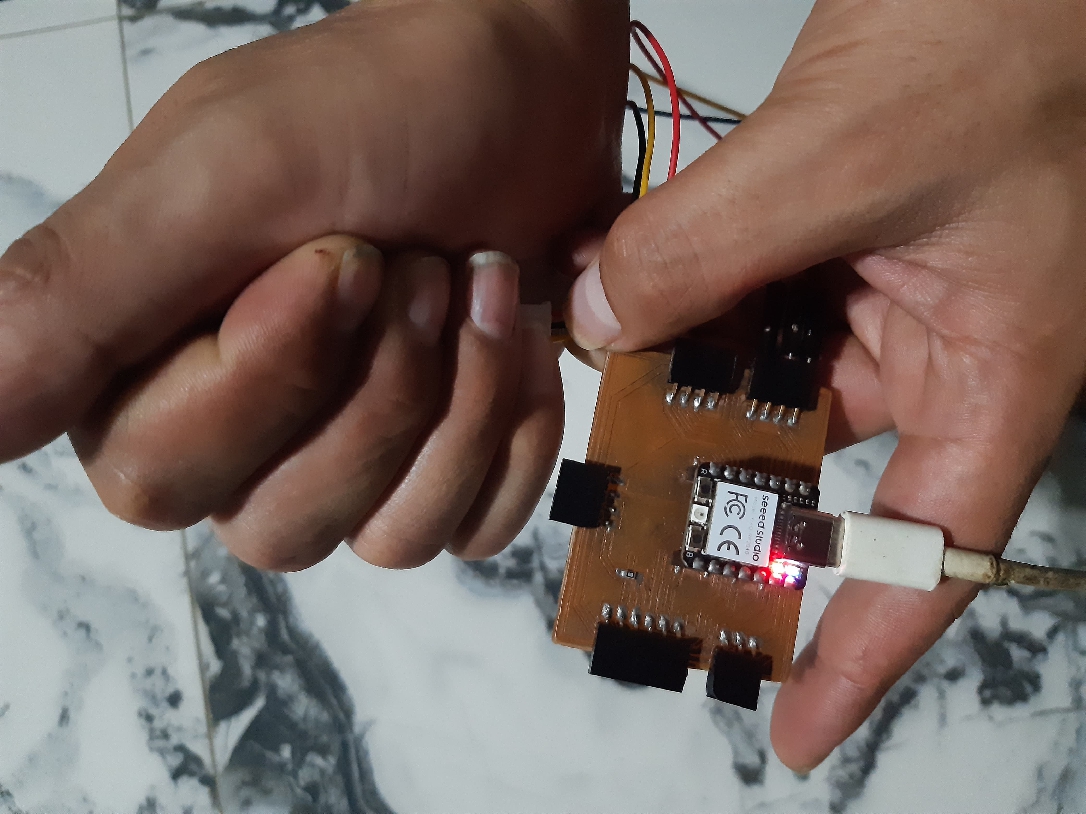
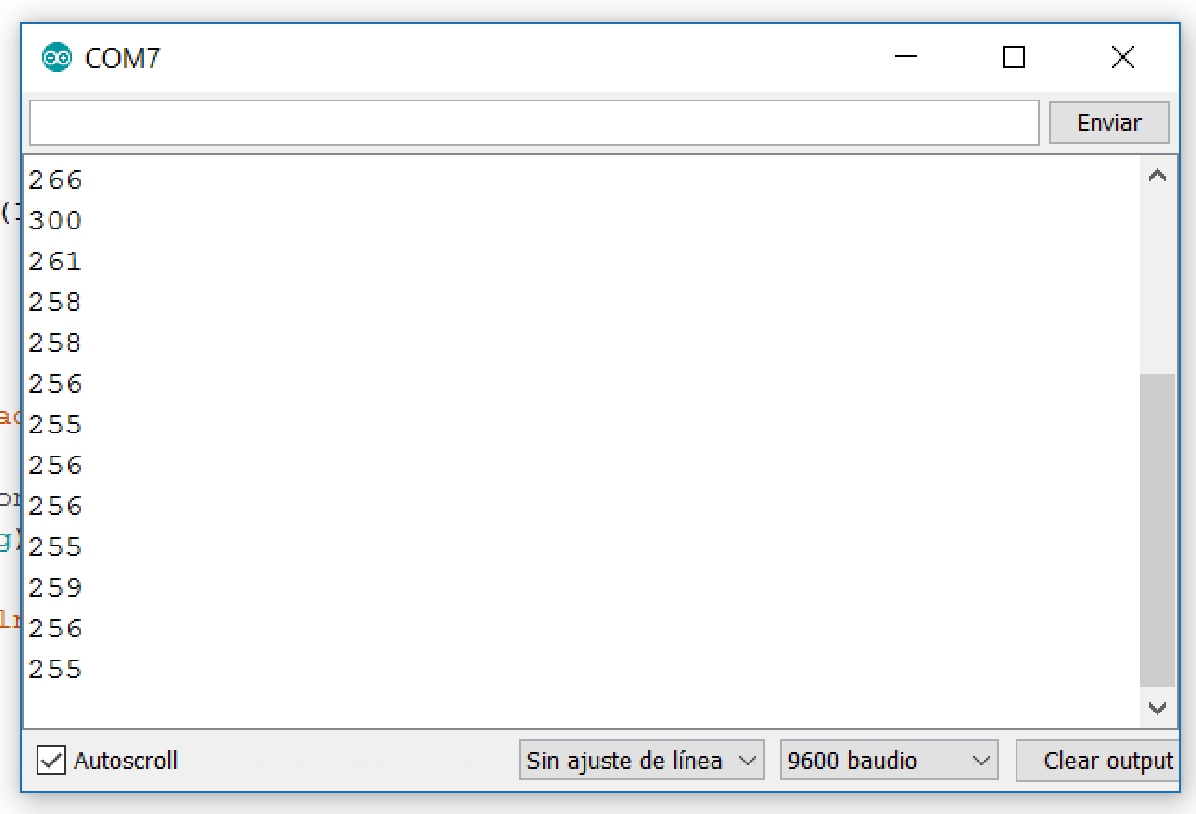
We continue reading the sensor values. As a first measure, we cover the sensor with our hand and then observe the results on the serial port.
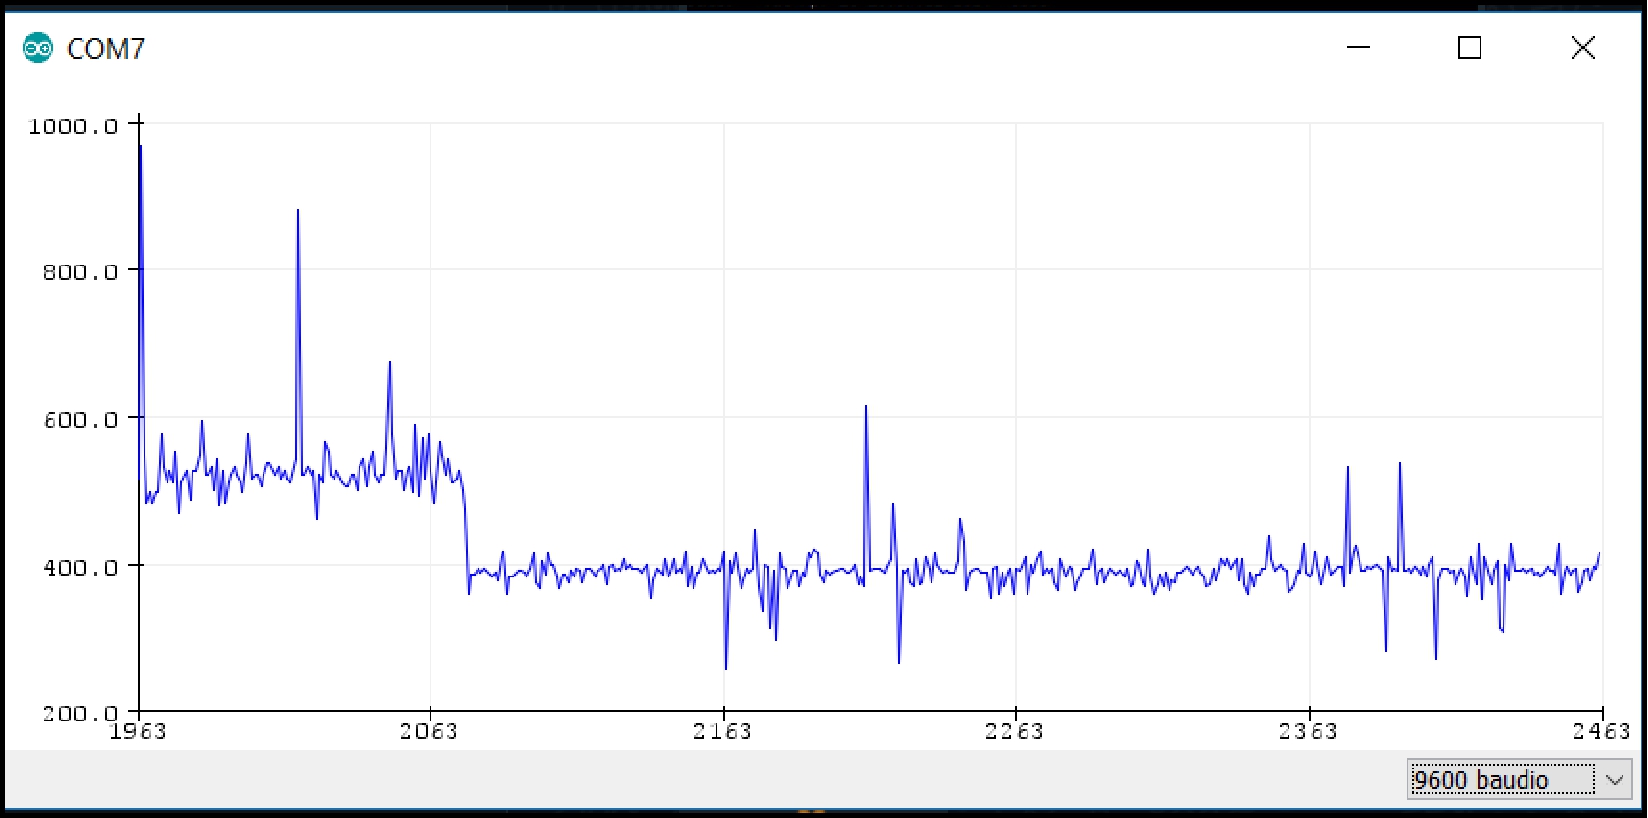
Case 2
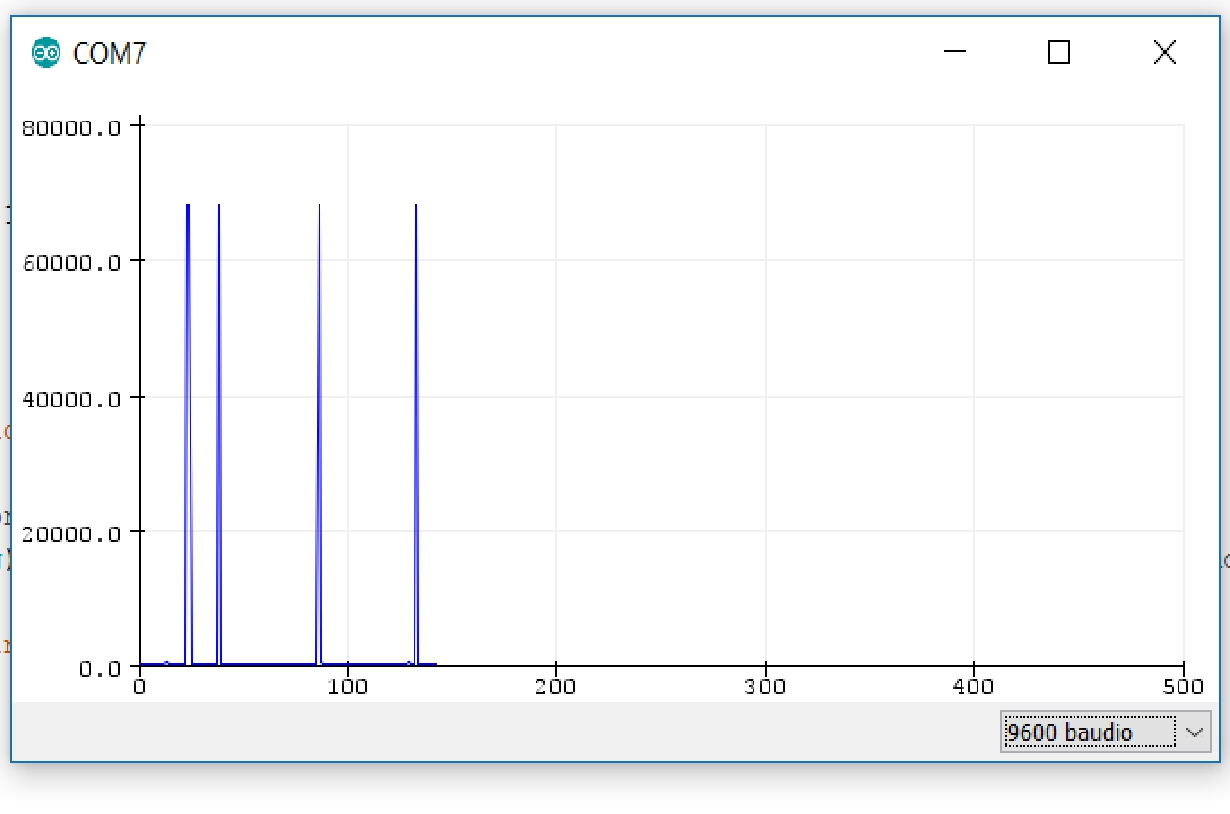
On this occasion, I provided direct illumination to the LDR sensor, which will allow you to clearly see the marked difference in the data collected.
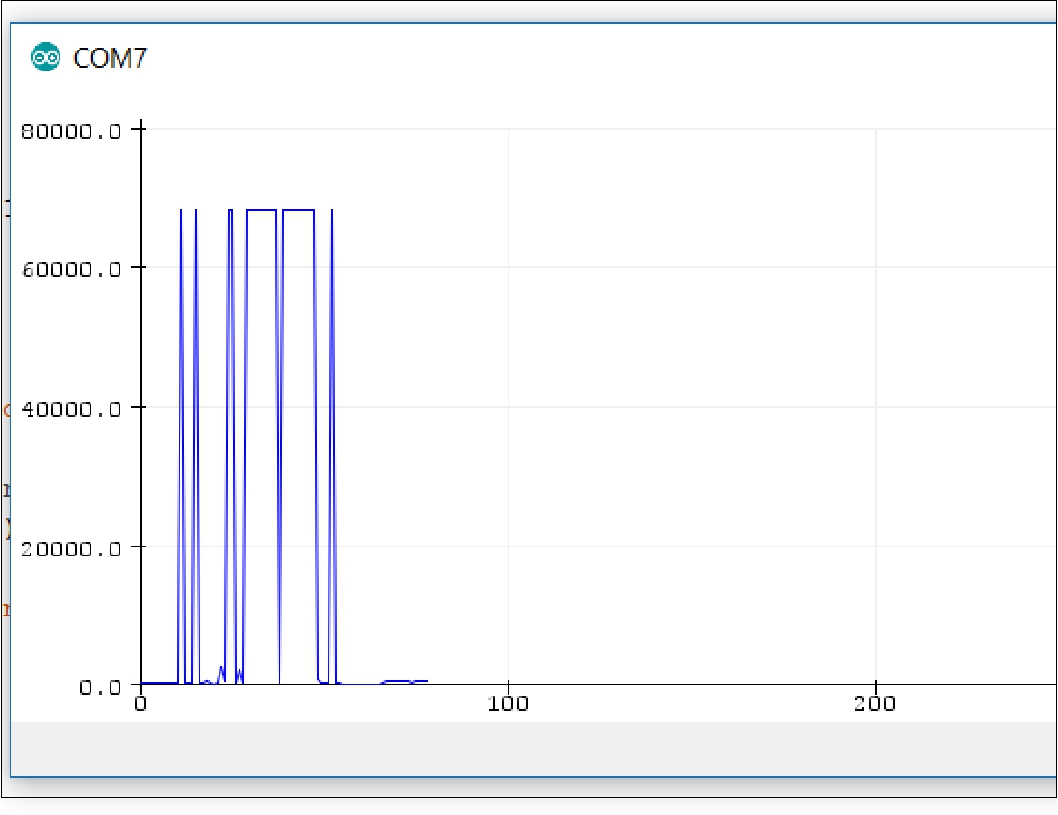
The following image shows a sequence of chart data collected by the Serial Plotter.
"It was a tremendously productive week, as as a Fablab Peru team, my colleagues Grace, Wilber, Renso and myself had the opportunity to experiment with a variety of sensors. We each shared our individual experiences, thus enriching our collective knowledge ".