FAB ACADEMY 2022 
FABLAB U. CONTINENTAL- PERU

INSTITUTE OF HIGHER EDUCATION "REPÚBLICA FEDERAL DE ALEMANIA"
  

Electronics Design

GROUP ASSIGNMENT

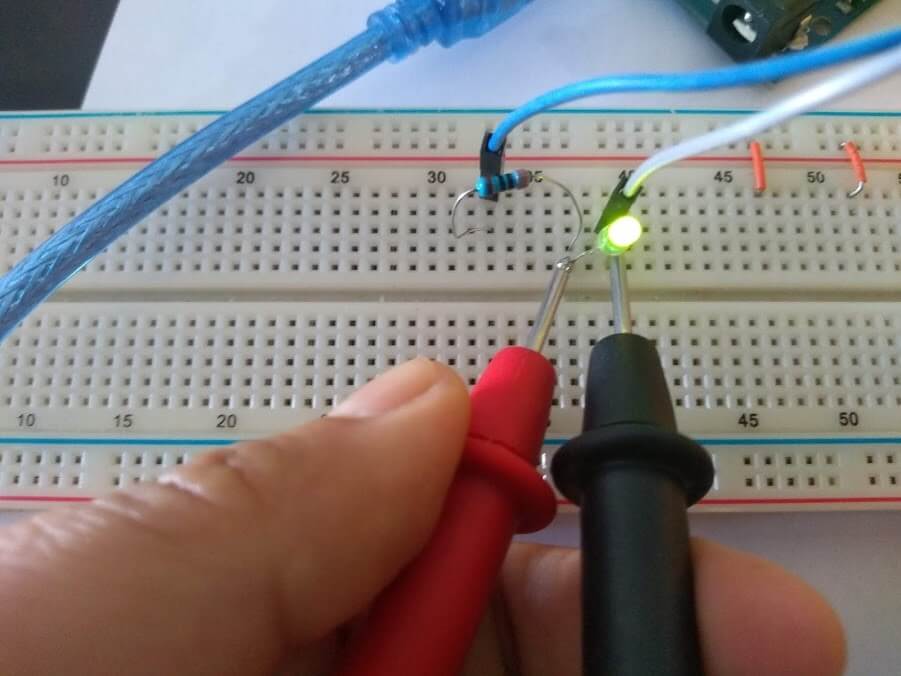
Use the test equipment in your lab to observe the operation of a microcontroller circuit board (in minimum, check operating voltage on the board with multimeter or voltmeter and use oscilloscope to check noise of operating voltage and interpret a data signal).

Document your work to the group work page and reflect on your individual page what you learned.

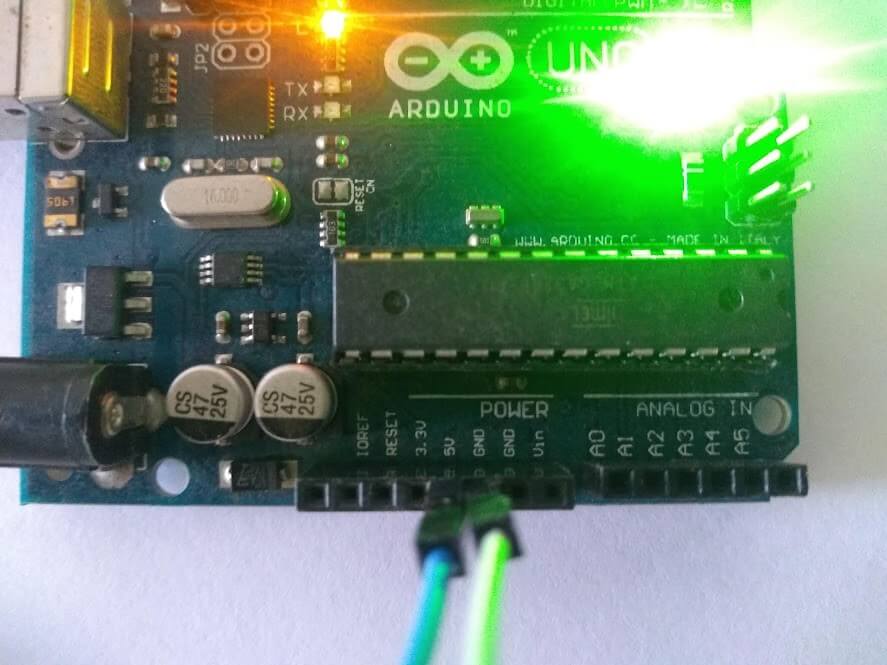
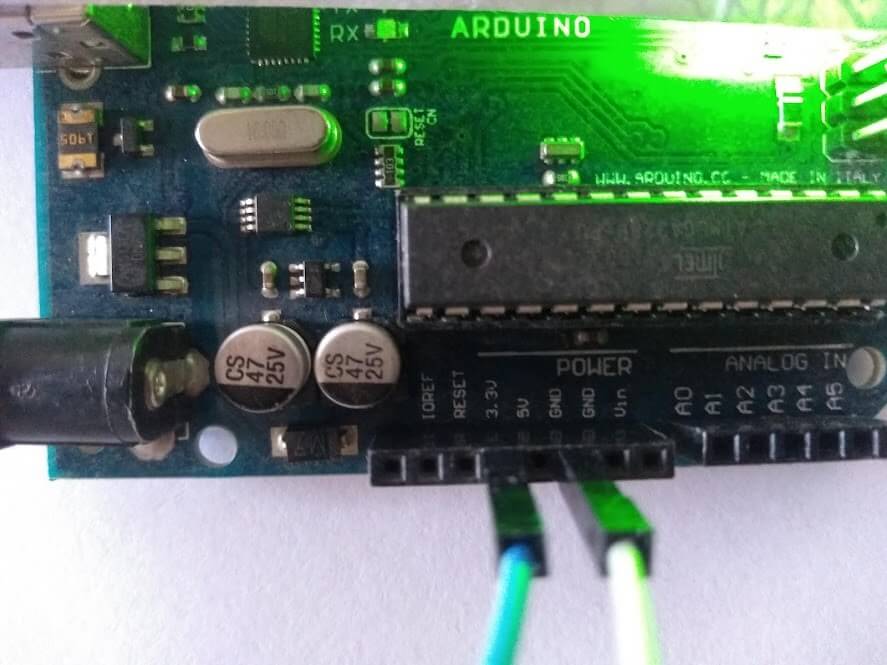
For this assignment we will use an Arduino Uno card to perform the measurements.

Step 1:  
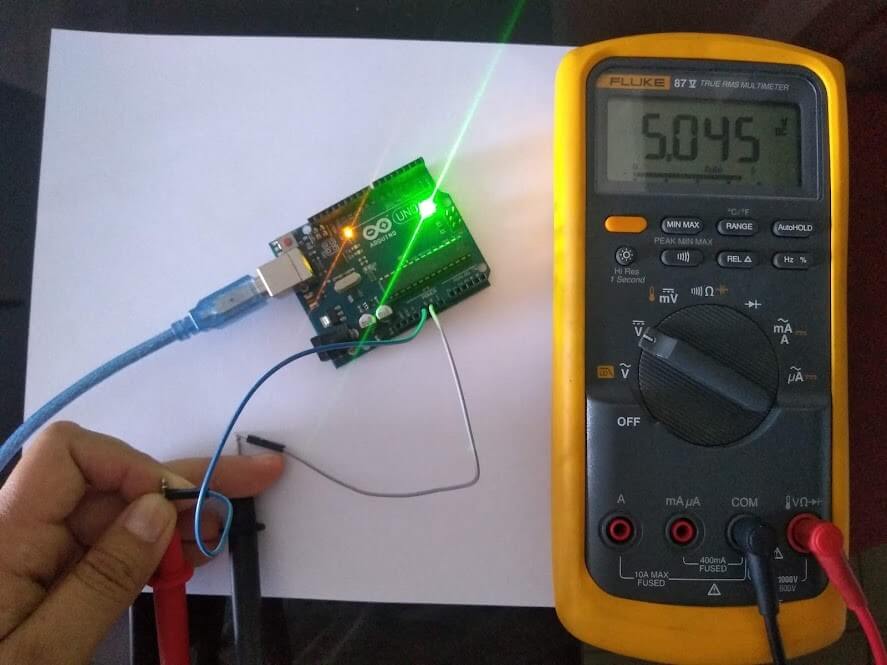
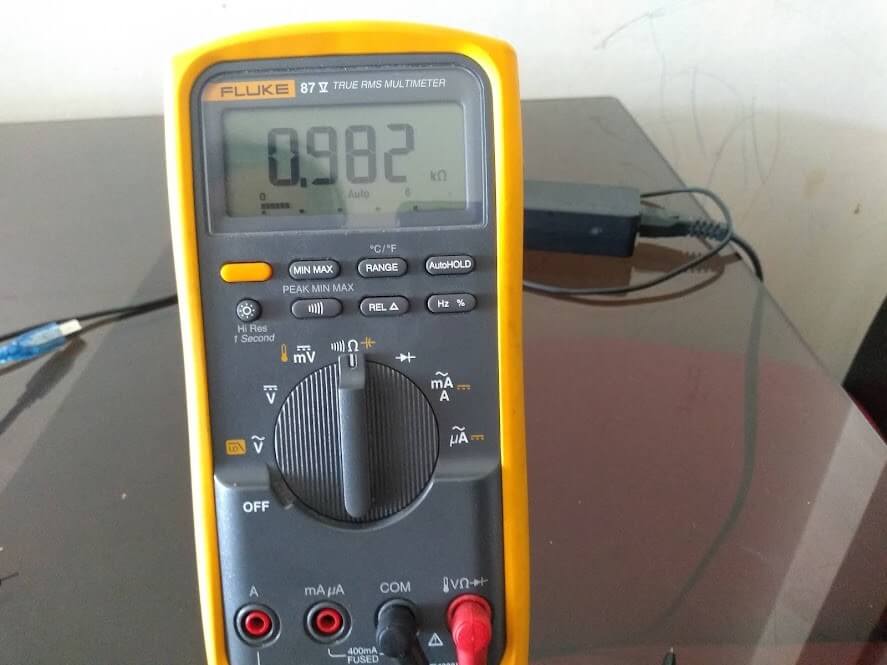
We will use a BK PRECISION oscilloscope and a FLUKE 87 V multimeter to make the measurements.

Oscilloscope BK PRECISION

Multimeter FLUKE 87 V

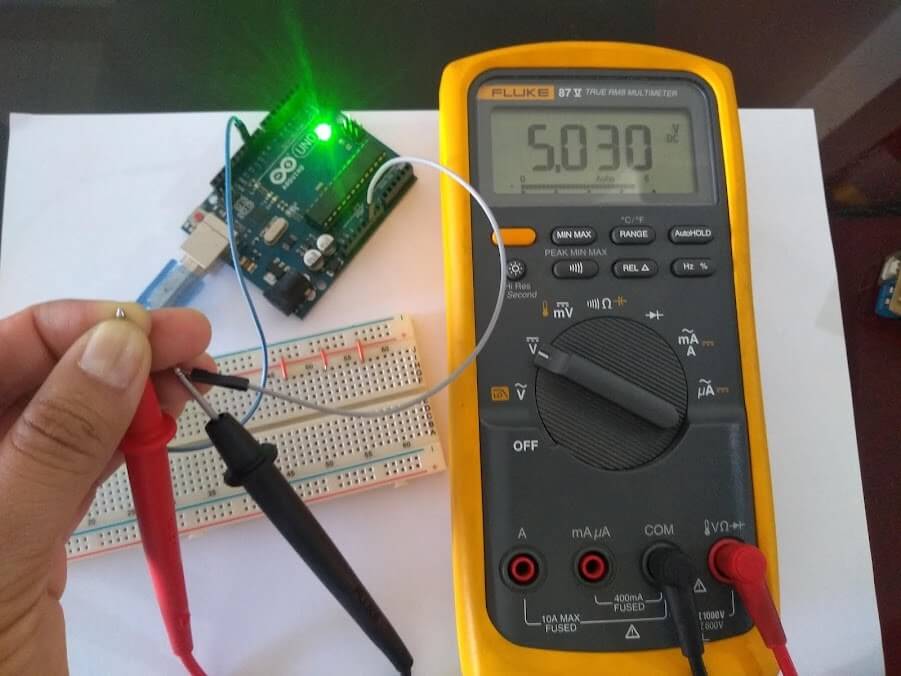
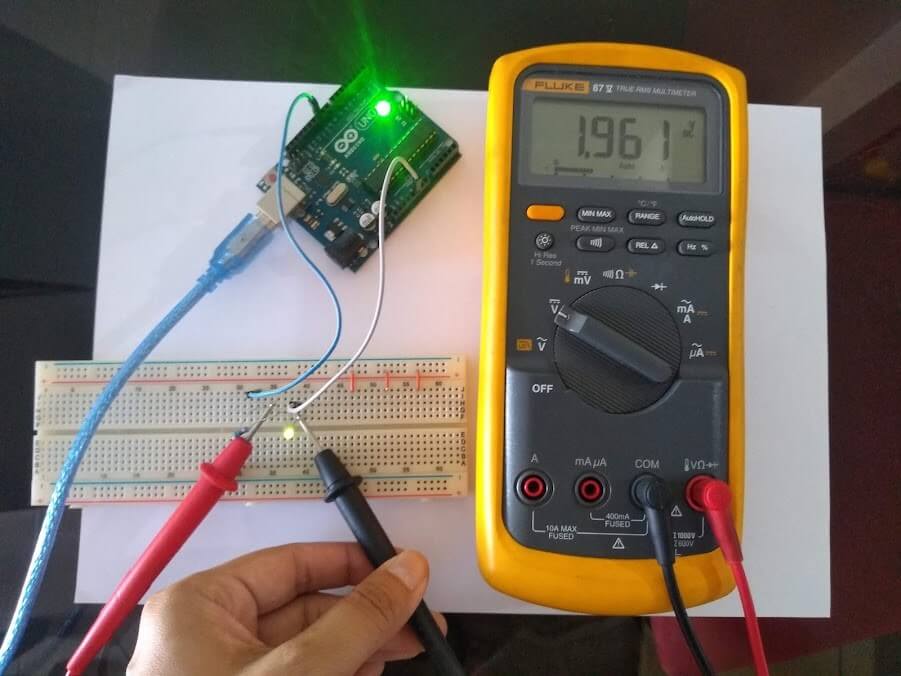
S tep 2: We place the selector of the multimeter in continuous voltage and proceed to measure the output voltages which are respectively 3.3V and 5V; in the multimeter the corresponding values of 3.302V and 5.045V can be seen, voltages that coincide with those indicated on the Arduino Uno card.

Step 3: Now we set the selector of the multimeter to ohms and means the SMD resistors of 102 (4 x 1KΩ) and 103 (4 x 10KΩ). With the multimeter the following resistance values are obtained, respectively 0.982KΩ and 10.08KΩ, which are very close to those indicated on the Arduino Uno board.

Step 4: Measure the output voltage of a digital pin, for this the Arduino board has been programmed to activate a led connected to pin 10, we build the small circuit with a 330 Ω resistor and a green led.The following measurements were made:

Video

Measuring voltages, led on: https://youtu.be/oGAG7zf8IyM

Step 5: Using the oscilloscope, visualize the waveform of a flashing LED connected to pin 13 of the Arduino which already contains an internal resistance, for this the card has been previously programmed. The waveform is square and each square is 1V, as can be seen in the first video. In the second video, the variation of the voltage is observed when the LED blinks. On the voltage is 4.784V and off 0V.

Video

Blink oscilloscope: https://youtu.be/1PdQbeoy0i4

Blink: https://youtu.be/b5C_yNnWrJk

Step 6: With the oscilloscope, we can see the behavior of a pin with PWM output. In the first video you can see how the intensity of light in the LED varies. In the second video you can see how the width of the output pulse varies. And in the last one, as this variation of the width of the pulse, it is reflected in the variation of the output voltage and the voltage in the led. It is shown that by varying the pulse width of the output signal, the voltage varies causing the led to shine with greater or lesser intensity.

Videos

PWM OUTPUT: https://youtu.be/IVzpJEyQr4w

PWM_OSCILLOSCOPE: https://youtu.be/4KL1Pq4gjZk

PWM_VOLTAGE: https://youtu.be/FDYLo1FTkbg

Step 7: We place the tips of the oscilloscope on the Tx and GND pins and observe the behavior of the signal when uploading a program to the Arduino board. We repeat the procedure, but this time with the Rx and GND pins. It is observed in both cases that when a program is loaded on the card there are variations in the signal, which shows that the data is being sent correctly.

Videos

SIGNAL ON PIN TX: https://youtu.be/XMs8ORXUlw4

SIGNAL ON PIN RX: https://youtu.be/q6qOEwfLiig

Single assignment

We download and install Eagle (add Link). After installing the program, the following icon appears on the desktop.

We enter the program by double clicking on that icon; We are presented with the following environment.

We go to Project, create a new project and give the project a name.

Now we create a new schematic, here we will create the electrical schematic of our circuit.

Before starting the circuit design, it is necessary to install the library that contains the Attiny45, which is the microcontroller with which we are going to work; left the corresponding link here.

After installing the library, clicking on ADD PART should show the installed library:

Now we can select the components of our circuit by clicking on the ADD PART icon.

Now we designate the values ​corresponding to each component by activating the VALUE icon and clicking each component.

We start the connection of components, for this we use the NET tool.

Finally, click on the ERC tool, to check if we have any connection errors. We have only one warning, but zero errors. We can create the PBC.

To do this, click on the GENERATE / SWITCH TO BOARD icon. We get a message, click YES.

We configure the GRID

We place the components trying to order them.

BY manually REORGANIZING the components we perform a better routing of the tracks.

PLACING NAME: With the text tool, we can place our name on the plaque. You can also change the font size.

With the move tool, we can place the text on the plate, finally it should look like this:

Once the routing of the board is finished, we double-click on “layer settings” and leave only two layers enabled: “top” in red, which corresponds to the tracks, and “dimension”, in yellow, and corresponds to the outline that limits the board.

We enter the dimensions layer and in line properties, we change the thickness to 20.

we should stay like this:

Finally, we proceed to export in PNG format, the tracks and the border. For this we go to FILE - EXPORT - IMAGE

The following box opens

We configure as follows. We locate where to save the file and give it a name. We first export the tracks and then the border, for this we must take into account that we must leave only one of the two layers active at a time and finally click on save.

After saving both images we should be left as follows: