
To observe the operation of a Microcontroller we used one of the Boards we made during the week and listened to one of the ouputpins which's function we then changed by changing the sketch over and over again. To know which pin to write to we used the following image, explaining which pins of the ATtiny1614 correspond to which "pin number" within the sketch:
We settled for using the same behaviour of the blinking LED and modulating the frequency of the blinking (Changing the delay timings) to observe, that the multimeter averages the signal at high frequencies, while the oscilloscope should in theory still detect all ups and down in the voltage levels. For this we simply used the following sketch:
		const int led = 10;
		const int testpin = 0;
		const int manualDelay = 1000;

		void setup() {
		  // put your setup code here, to run once:
		  pinMode(led, OUTPUT);
		  pinMode(testpin, OUTPUT);
		}

		void loop() {
		  // put your main code here, to run repeatedly:
		  digitalWrite(led, HIGH);
		  digitalWrite(testpin, HIGH);
		  delay(manualDelay);
		  digitalWrite(led, LOW);
		  digitalWrite(testpin, LOW);
		  delay(manualDelay);
		}
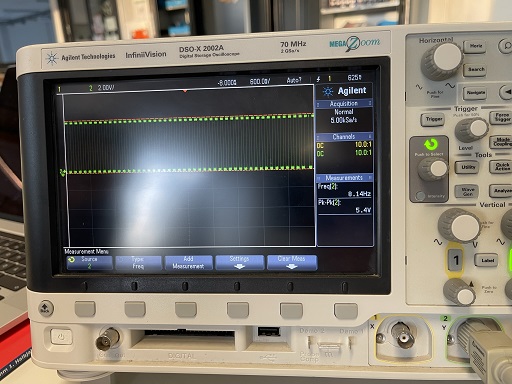
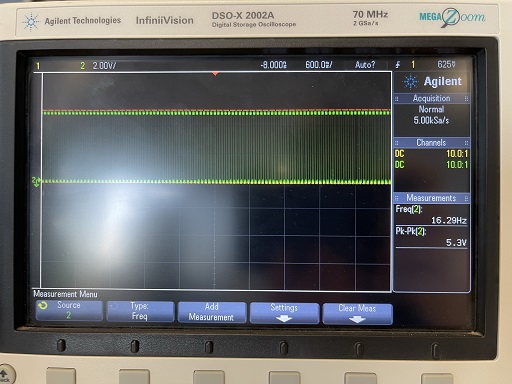
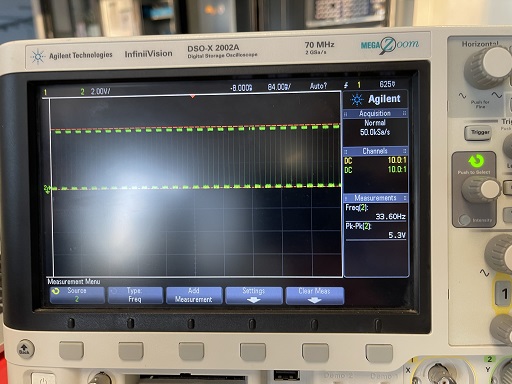
This sketch allowed us to change the delays very quickly. To observe the changes we modulated the delay time between 1000 and 7, always halving the prior value: 1000, 500, 250, 125, 62, 31, 15. To show the differences between the multimeter and the oscilloscope, we recorded the multimeter and snapshot the image of the oscilloscope to show them next to each other:
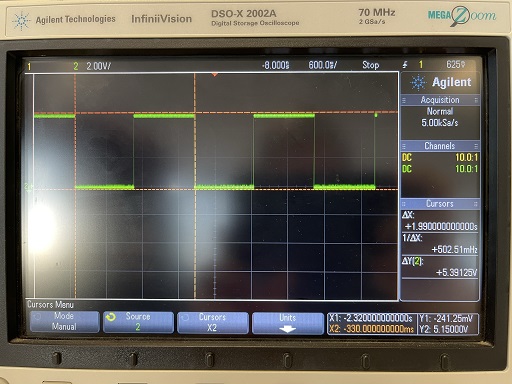
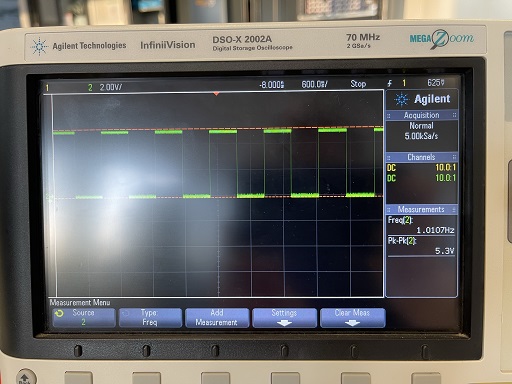
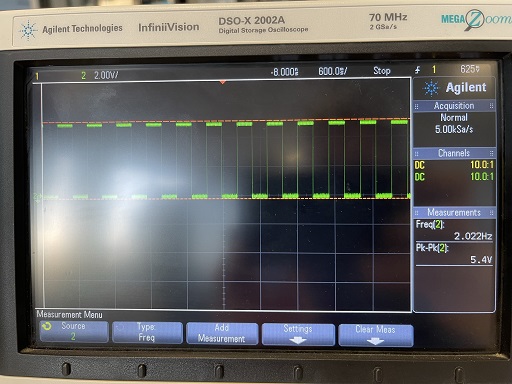
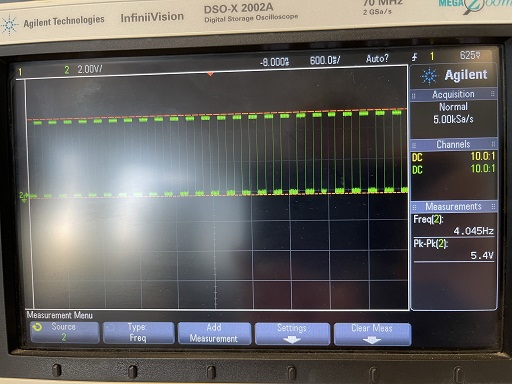
By the end it is clearly visible, that the multimeter averages out the volatge levels its reading, because the time intervals in which the LED is being powered on and of are just to short for the multimeters sampling rate. To further show this, we decided to change the ration of the two delays to one third and two thirds instead of half and half. Meaning, that the LED would be turned on two thirds of the time. Again this was very clearly visible as you can see in the following pictures:
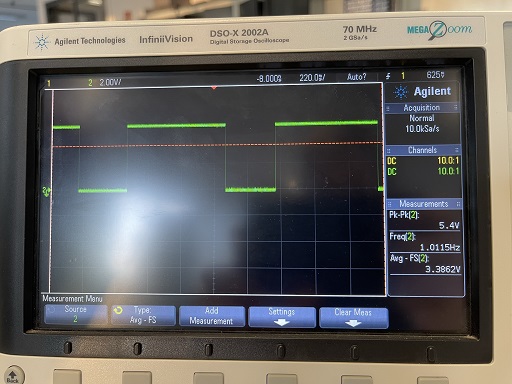
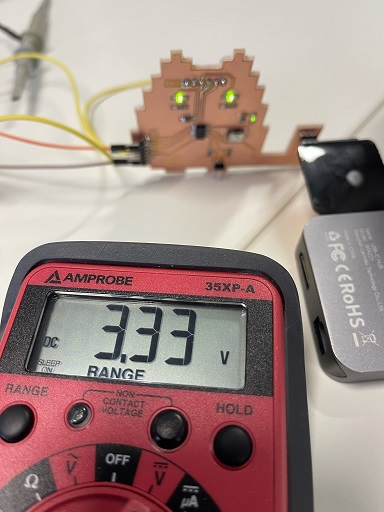
The multimeter showing 3.33V is even the perect Value for this experiment as the LED is on for two thrids of the time, meaning 2/3*5V = 3.33V.
The conclusion we are gathering here, is that the multimeter and the oscilloscope have different fields in which they work best. For the oscilloscope, this is the examination of signals and with its vast functionality the investigation of signal problems and properties of signals. The multimeter on the other hand can be used to check for errors after soldering or checking for continuity. The Multimeter is also far easier to use and much more quickly set up.