Week 14 Interface and Application Programming
Welcome to this page about interface and application programming! In the summary below, you can jump directly to topics.
Summary
An interface or application makes it possible to interact with data. This week, we will learn how to design and program these. During the local session on Thursday, our instructor Henk explained: “For some people who already program a lot, this week is easy. When you’re new to programming, it is a lot of learning.” He provided the following advice: “If you’re new to programming, focus on one application. Then find someone online who already did this and try to extend the program. Then reverse-engineer the programming language. When you modified it, it proves that you try to understand programming. That’s enough for programming this week.”
Pick one of the boards you made in previous weeks, that has an input or an output. Read out the data with the FTDI. Then use the data to visualize it or do something else. To make it easier, pick an output. When you click the button on the screen, the LED starts blinking. That’s also enough. Example: Henk’s Fab Academy with data plotting of a phototransistor in Python.
Assignments
Group assignment: Compare as many tool options as possible.
Individual assignment: Write an application that interfaces a user with an input and/or output device that you made
Learning outcomes: Interpret and implement design and programming protocols to create a Graphic User Interface (GUI).
Project management
This week’s planning:
| Spiral | Tasks | Time |
|---|---|---|
| 1 | Group assignment | 8 hours |
| 2 | Programming in P5 | 16 hours |
| 6 | Programming in D3 | 8 hours |
| 7 | Documentation | 8 hours |
Let’s get started!
This week’s results
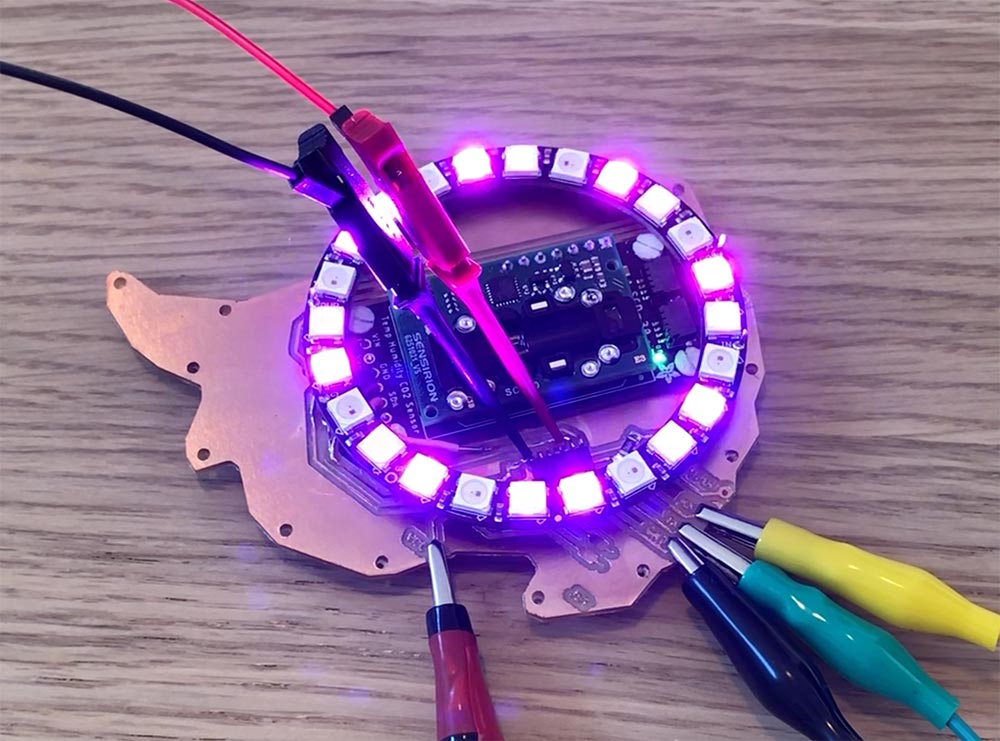
An application for the phototransistor on my Hello Fryslân board was programmed with P5 and the P5.serial:
Interface and Application tools
During lecture, Neil showed an overview of the many languages, tools and libraries available to us. In our local session, Henk provided practical information on what to do this week. After that, Nadieh gave a presentation about a couple of tools she often uses. Nadieh also showed some of her wonderful data visualization work. The section below is a summary of the presentations.
The general process for interface and application programming is as follows:
- Pick a programming language
- Choose device interfaces (serial or I2C)
- Select your data interface
- Design and program the user interface = key question of this week
We start with languages.
Languages
Go, Rust, Flutter, Dart - More modern languages. Addresses security vulnerability issues of C++. Provide more reliability.
Java native android devices.
APL = favorite language of Neil, however he doesn’t recommend to anyone because it’s been discontinued.
APL still lives under the hood, spiritually, in Python. - Neil Gershenfeld
Processing is a flexible software sketchbook and a language for learning how to code within the context of the visual arts.
MIT App Inventor = good to build portable apps. https://appinventor.mit.edu/
Data interfaces
This is how your data is supplied to the main code. For example, flat files, Google sheets, or MySQL.
Visual data programming
Grasshopper + Firefly are programming environments within Rhino.
Python is a beautiful language. Strongly recommend to learn python.
JavaScript is not from the ground up an interesting language. It’s browser-based. Web-native.
- Node.js allows you to make javascript outside a browser.
- V8 is one of Javascript’s engines for just-in-time calculations.
- Node-RED is a programming tool for wiring together hardware devices, APIs and online services in new and interesting ways.link
Question during class: Is there any programming language to read I2C? Yes, any of these programming languages talk to it. There is in micropython. The busio library in circuitpython provides an I2C interface directly. For I2C in python click here. And this Adafruit tutorial on circuitpython.
Graphics
Canvas = html standard for putting pixels on the screen. Run in the browser.
SVG 2D. The downside though is that your browser will stutter if there are too many SVG elements on the page moving, then going to Canvas is better.
Three.js is a standard for 3D graphics on the web. Based on top of WebGL, which is the standard.
VTK is for visualizing 3D
Unity game design.
Godot open source version.
TouchDesigner is for installations (https://derivative.ca/)
Question during class: Do you use a local host to show the examples? No, view source code of the browser visualizations to check Neil’s code.
Audio and Video
WebAudio Audiobuffer –> sound to sounify
Supercollider https://supercollider.github.io/ this is cool for audio synthesis.
Sonic Pi https://sonic-pi.net/ is an easy entry to supercollider.
VR and AR
WebXR
ThreeJS has an extension to turn it into an VR application.
Here are some links for VR:
Augmented Reality: look at your device & map it on your phone.
Math, Machine Learning, Performance and Deploy
Colab
D3 is a beautiful set of libraries suitable for complex visualizations.
Tensorflow.js machine learning in javascript. Classify or make predictions.
Pi calculation benchmark on CBA GitLab.
Google Cloud can runs apps in the cloud.
An important note on security
Almost all libraries have been hacked. You’re reasonably safe if you keep the libraries up-to-date. End-to-end encryption is not that hard. Make sure to do this.
Nadieh’s presentation
Nadieh is a fellow student at Waag, who’s an amazing data designer (check out her work here). She kindly offered to present five commonly used tools to create data visualizations with. These are HTML5 Canvas, D3.js, WebGL, Three.js and P5. As we will learn, each of them have unique characteristics that can be applied in specific situations.
D3.js In D3, shapes are generally created with SVGs. It’s very interactive. According to Nadieh, “It’s very hard to do something easy with D3, and it’s easy to do something complex. It’s a very steep mountain climb, but if you’re at the top you can do a lot!” You start with setting up one SVG, a canvas. With that you can add functions and interactivity.
The example she explained is the Simple animated bar chart. I made some notes, this is what the code (approximately) looks like in D3:
var dataset = [ numbers, ] = an array
var totalheight = 100

Screen

var yScale = d3.scaleLinear()

var colorScale = d3.scaleLinear() // run between colors, because colors are numbers

var svg = d3.select // you create an svg file

var bars = svg.selectAll(".bars") // is hardest part, to create the actual bars. Give me
        .data(dataset) //create a dataset
        .enter()append("rect") // create rectangles
        .attr("class", "bars") /
        .attr()       )


bars.on("mouseover", function(d)) {  // do something interactive


}
HTML5 canvas You still work with a canvas, but you work with pixels. Canvas is one of the easiest ways to learn. Compared to D3, Canvas is much better for the browser. It’s much more powerful for doing bigger things. You can overlay canvasses. So you can start with a static underlay and add more complex data on top of that.
ctx. // common function in Canvas
WebGL It’s the most difficult code to master of the three. Nadieh built the Planet Globe data visualization in WebGL.
Three.js Three.js is built on top of WebGL, which makes it much easier to work with. It’s 3D. Just place the camera in the scene and change your camera view to create an animation. It’s a little more difficult to get in, because you have to set the scene.
P5.js The last tool Nadieh explained is P5, which comes from Processing. P5 is very much Arduino-like and is a very friendly way to start with programming. You can even write code online in the P5 Editor without having to install any libraries on your local computer. From their website:
p5.js is a JavaScript library for creative coding, with a focus on making coding accessible and inclusive for artists, designers, educators, beginners, and anyone else!
Here is an example of Javascript code in P5:
var = variable

function setup(){
    createCanvas(400, 400);
    noStroke();
}

function (draw) {

    background(220);
    fill(255,0,0);
    circle(x,)

}
General principles and recommendations:
- Circles are friendlier shapes to many people.
- Never add a stroke when drawing circles :)
There is a good interface with Serial. P5 is better with that than for example D3, because that’s often based on existing datasets. You might have to run this locally with a localhost:. That’s not always possible because of security reasons.
Comparison between the tools
To compare the performance of the four tools, Nadieh once made the same visualization in all of them. This is Breathing Earth, in which 50.000 circles move through a year of data on planetary vegetation health. She told us that it uses WebGL under the hood, which is super fast. The Canvas version is much slower. D3 with SVGs is not even possible with this type of visualization. The performance of WebGL is much better for this task, because D3, Canvas, etc talk to your CPU. WebGL talks to your GPU.
Resources/tutorials for further learning
- Happy Coding
- Nadieh’s Blocks
- Observable is a useful tool to work with all of these things. You create notebooks. You can code online. It’s very nice to prototype data visualizations.
I am super grateful that Nadieh provided these introductions, as it can be daunting to start with programming when you have zero experience! There are so many cool options for this week and I’m excited to try a couple of them out.
Write an application in P5
Because it’s a friendly programming library to learn and because it has a solid plugin for serial monitor, I decided to start with P5. On Thursday, Nadieh provided excellent guidance to help us set up a local host and the p5.serial app.
Setting up a local host
2DA algorithm –> any folder that you put in localhost folder becomes accessible for localhost. We followed the Setting up Local Web server on Mac OS Big Sur tutorial.
What we did:
- Start the Apache Server
- Create Sites Directory
- Create username.conf file
- Configure the httpd.conf file
- Configure the httpd-userdir.conf file
What we didn’t do (yet):
- Create a phpinfo() page
- Setting up the MySQL Server
To set this up, type the following in Terminal:
sudo apachectl start
Then you will see, ‘It Works’
Now you can create a Sites folder.
Note from Henk: Apache is a webserver. It’s also enabling access on other computers. If you’re on a public wifi. If someone else is on the same network, you can also look what’s on someones sites folder.
In Terminal, type open . to open the file.
To open the localhost, just open a browser and type: localhost. This will show the folders. If that doesn’t work (for example in the Safari browser), type your name behind it: http://localhost/~nicolebakker/. If that succeeded, you can continue with the steps provided in the above link. It’s pretty straightforward. A good advice from Nadieh was to type open . in Terminal, to edit the httpd.conf files in a text editor instead of Terminal. This command opens folders and files.
Setting up p5.serial
For setting up p5.serial, five steps were given by Nadieh in the Waag Mattermost chat.
- Install either the p5.serial app: https://github.com/p5-serial/p5.serialport#p5serial-app (or if you know Node.js use that way: https://github.com/p5-serial/p5.serialport#p5serial-nodejs)
- After installing you need to start the serial server by running the app (or running p5serial in the terminal if you went the Node.js way)
- Next, unzip [Nadieh’s file] and place the “p5” folder in your “Sites” folder
- Within the script.js file, change the ID of my FTDI to your FTDI
- Navigate to your localhost in the browser and go into thee “p5” folder
This is the script of step 3.
let serial;
let data;

let width = 400;
let height = 400;

function setup() {
    // Instantiate our SerialPort object
    serial = new p5.SerialPort();

    // Assuming the board is connected, let's open the connection to it
    // Use the FTDI ID
    serial.open("/dev/tty.usbserial-D307S1LS");

    /////// Register some callbacks ///////
    // When we connect to the underlying server
    serial.on('connected', () => { console.log("We are connected!"); });
    // When we get a list of serial ports that are available
    let portlist = serial.list();
    serial.on('list', gotList);
    // When or if we get an error
    serial.on('error', (err) => { console.log(err); });
    // When our serial port is opened and ready for read/write
    serial.on('open', () => { console.log("Serial Port is open!"); });
    // When we some data from the serial port
    serial.on('data', gotData);

    /////////// Setup general p5.js stuff ///////////
    createCanvas(width, height);
}//function setup


function draw() {
    background('rgba(255,255,255, 0.1)');

    if (data) {
        document.getElementById("text-value").innerHTML = data;
        circle(map(data, 0, 255, 0, width), height/2, 80);
    }//if

}//function draw

//////////////////// Serial Helper Functions ////////////////////
// Got the list of ports
function gotList(thelist) {
    // theList is an array of their names
    for (let i = 0; i < thelist.length; i++) {
        // Display in the console
        print(i + " " + thelist[i]);
    }//for i
}//function gotList

// There is data available to work with from the serial port
function gotData() {
    let inString = serial.readStringUntil('\r\n');
    // check to see that there's actually a string there:
    if (inString.length > 0) {
        // convert it to a number:
        data = Number(inString);
    }//if
}//function gotData
Now you need to program your board with:
#define photo_pin 1 //ATtiny PA7

int sensor_value = 0;

void setup() {
  // Initialize serial communications at 9600 bps:
  Serial.swap(1);
  Serial.begin(9600);
  while(!Serial);

  pinMode(photo_pin, INPUT);
}//void setup

void loop() {
  sensor_value = analogRead(photo_pin);
  int mapped_value = map(sensor_value, 0, 1023, 0, 255);
  Serial.println(mapped_value);
  delay(100);
}//void loop
Once you’ve programmed the board, refresh the browser page, and it should hopefully work (keep the FTDI connected of course).
You can see more information in the browser if you check the console in the devTools (CMD+OPTION+I it should be in the lower right, if you can’t see it, press thee three button menu and say something like “show console:). For now I couldn’t get it to work with Serial.write(), but it seems that Serial.println works fine too. - Nadieh
I followed all steps and successfully connected my board!
P5 circle responds to audio
Then, I found a funny script that responds to sound.
/**
 * @name Mic Input
 * @description <p>Get audio input from your computer's microphone.
 * Make noise to float the ellipse.</p>
 * <p>Note: p5.AudioIn contains its own p5.Amplitude object,
 * so you can call getLevel on p5.AudioIn without
 * creating a p5.Amplitude.</p>
 * <p><em><span class="small"> To run this example locally, you will need the
 * <a href="http://p5js.org/reference/#/libraries/p5.sound">p5.sound library</a>
 * and a running <a href="https://github.com/processing/p5.js/wiki/Local-server">local server</a>.</span></em></p>
 */
let mic;

function setup() {
  createCanvas(710, 200);
  noStroke();

  // Create an Audio input
  mic = new p5.AudioIn();

  // start the Audio Input.
  // By default, it does not .connect() (to the computer speakers)
  mic.start();
}

function draw() {
  background(200);

  // Get the overall volume (between 0 and 1.0)
  let vol = mic.getLevel();
  fill(100);


  // Draw an ellipse with height based on volume
  let h = map(vol, 0, 1, height, 0);
  ellipse(width / 2, h - 25, 50, 50);
}
Here is the video. I tapped on the table:
D3
A couple of years ago I saw D3 for the first time and I instantly loved the beautiful data visualizations. Even if it’s a tiny small step this week, I’m exited to start learning. My goal is to visualize data related to climate, sustainability and circular materials. I have never done this before, or really worked with large datasets.
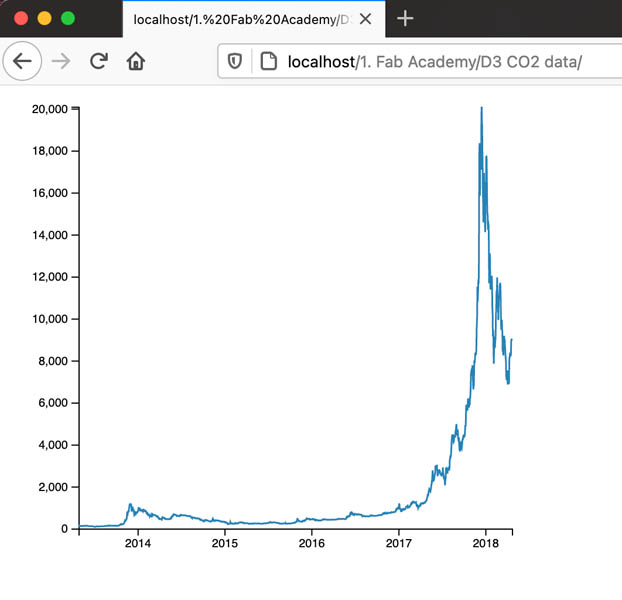
That’s why I start with a most basic linechart. The CSV file with the data is provided online in the D3 Graph Gallery and looks like this:
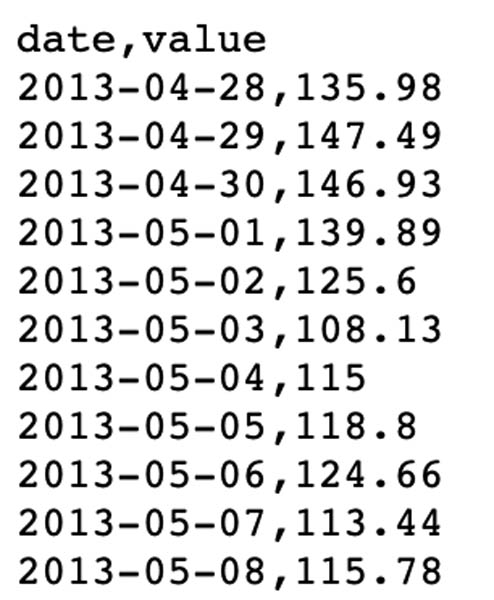
I created the html file and saved the sample code here. Tadaaa, my first D3 running on the local server!
Next, I downloaded the CO2 climate data from NOAA. I want to change the example chart to visualize climate data. This is the GML text file. Unfortunately, when I open this in Numbers/Excel to create a csv file, the data only appears in one column.
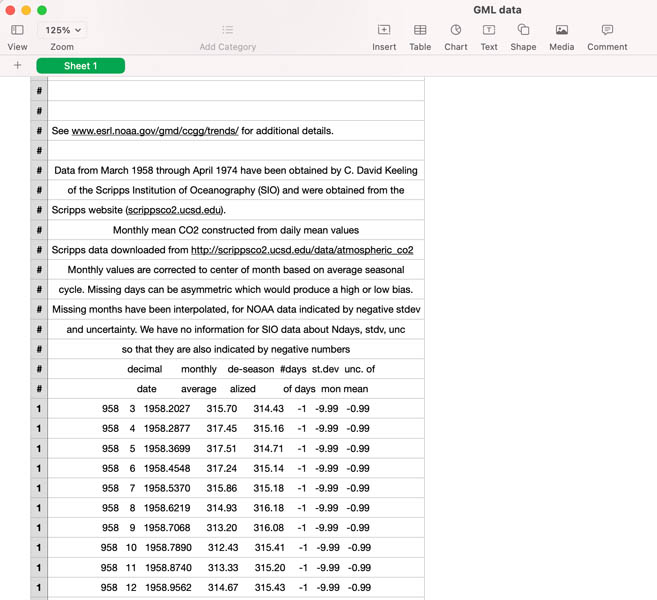
There must be a wonderful Python script to sort this data. But I did this manually with a snippet of the available data. I saved it as a co2data.csv file in the same directory.
year,month,value
2019,1,411.03
2019,2,411.96
2019,3,412.18
2019,4,413.54
2019,5,414.86
2019,6,414.16
2019,7,411.97
2019,8,410.18
2019,9,408.76
2019,10,408.75
2019,11,410.48
2019,12,411.98
2020,1,413.61
2020,2,414.34
2020,3,414.74
2020,4,416.45
2020,5,417.31
2020,6,416.62
2020,7,414.62
2020,8,412.78
2020,9,411.52
2020,10,411.51
2020,11,413.11
2020,12,414.25
2021,1,415.52
2021,2,416.75
2021,3,417.64
2021,4,419.05
Then, I changed the url of the code to link to this new dataset. I wanted to run this locally, so I renamed it to d3.csv("co2data.csv"),. Unfortunately, this didn’t work. I noticed that the data only has two entries: date and value. I changed that in the csv file.
date,value
2019-01-01,411.03
2019-02-01,411.96
2019-03-01,412.18
2019-04-01,413.54
2019-05-01,414.86
2019-06-01,414.16
2019-07-01,411.97
2019-08-01,410.18
2019-09-01,408.76
..
When I ran the file again in my localhost, noting happened. So I uploaded the csv file to my Fab Academy server and changed the local ‘read the data’ link to d3.csv("http://fabacademy.org/2021/labs/waag/students/nicole-bakker/assets/images/week14/co2data.csv"),. Here is the full code:
<!DOCTYPE html>
<meta charset="utf-8">

<!-- Load d3.js -->
<script src="https://d3js.org/d3.v4.js"></script>

<!-- Create a div where the graph will take place -->
<div id="co2_data"></div>

<script>

    // set the dimensions and margins of the graph
    var margin = {top: 10, right: 30, bottom: 30, left: 60},
        width = 460 - margin.left - margin.right,
        height = 400 - margin.top - margin.bottom;

    // append the svg object to the body of the page
    var svg = d3.select("#co2_data")
      .append("svg")
        .attr("width", width + margin.left + margin.right)
        .attr("height", height + margin.top + margin.bottom)
      .append("g")
        .attr("transform",
              "translate(" + margin.left + "," + margin.top + ")");

    //Read the data
    d3.csv("http://fabacademy.org/2021/labs/waag/students/nicole-bakker/assets/images/week14/co2data.csv"),

      // When reading the csv, I must format variables:
      function(d){
        return { date : d3.timeParse("%Y-%m-%d")(d.date), value : d.value }
      },

      // Now I can use this dataset:
      function(data) {

        // Add X axis --> it is a date format
        var x = d3.scaleTime()
          .domain(d3.extent(data, function(d) { return d.date; }))
          .range([ 0, width ]);
        svg.append("g")
          .attr("transform", "translate(0," + height + ")")
          .call(d3.axisBottom(x));

        // Add Y axis
        var y = d3.scaleLinear()
          .domain([0, d3.max(data, function(d) { return +d.value; })])
          .range([ height, 0 ]);
        svg.append("g")
          .call(d3.axisLeft(y));

        // Add the line
        svg.append("path")
          .datum(data)
          .attr("fill", "none")
          .attr("stroke", "steelblue")
          .attr("stroke-width", 1.5)
          .attr("d", d3.line()
            .x(function(d) { return x(d.date) })
            .y(function(d) { return y(d.value) })
            )

    })

    </script>
Nothing happened yet! I haven’t figured out yet why, but will update this soon!
Virtual Reality
To make CO2 emissions even more tangible, I was interested in exploring VR interfaces.
- A-Frame
- Three.VRController github
- Visualizing in VR using A-frame and D3
A-Frame
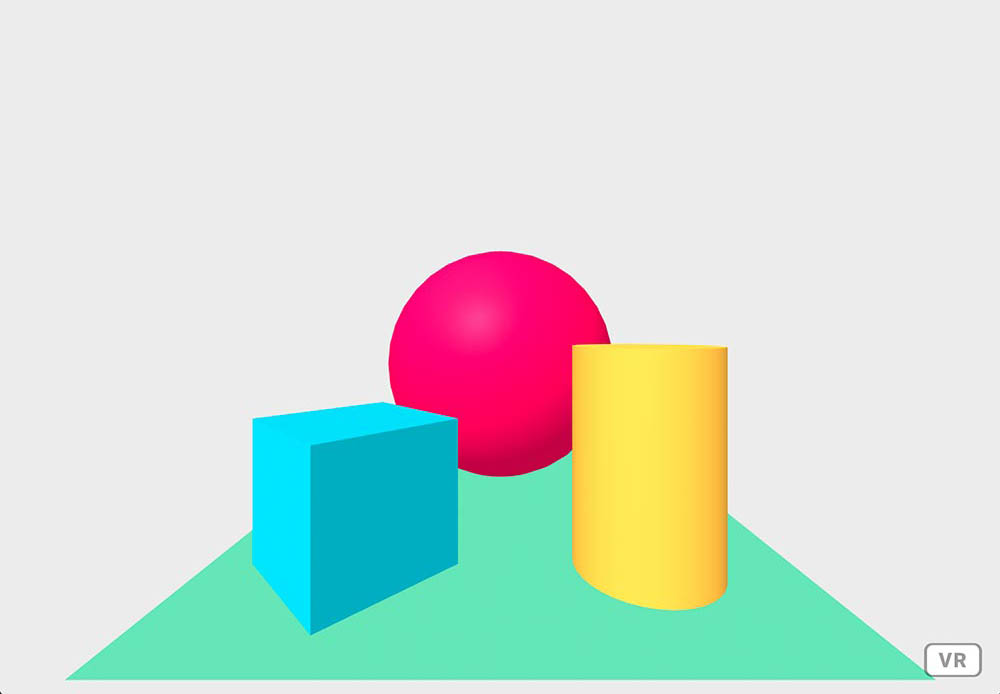
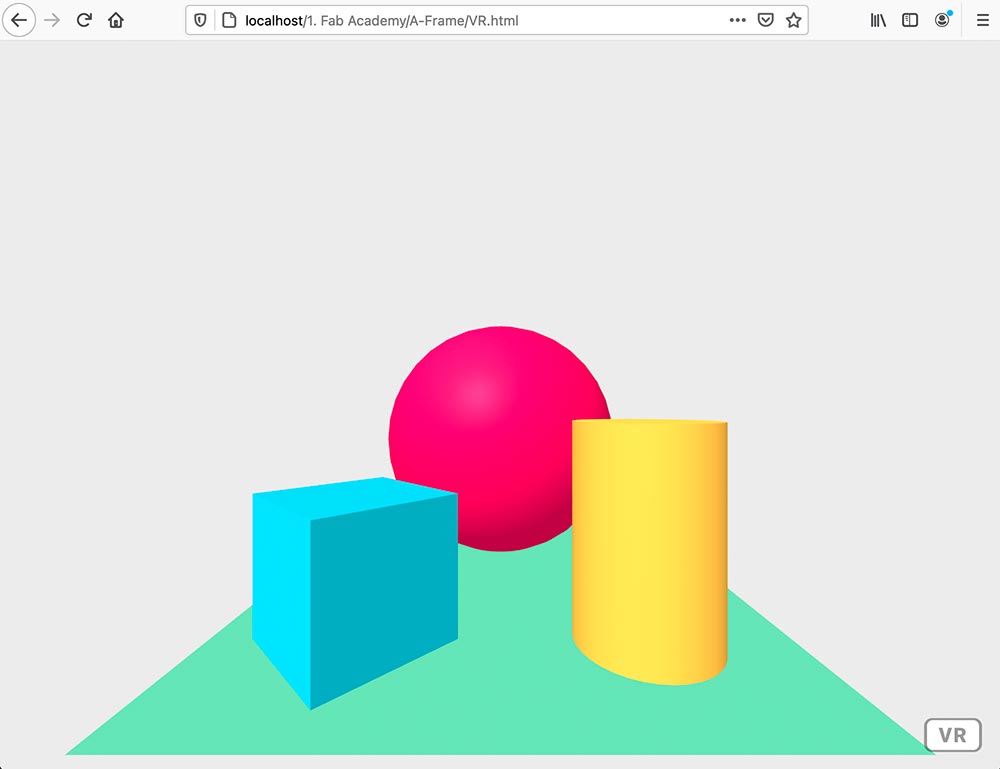
A-Frame is a powerful framework on top of three.js. The GitHub page can be found here. Also, here you can find a tutorial course and lectures about A-Frame by the University of Applied Science in Chur (Switzerland). On the Glitch page are many tutorials. I started with this example by creating an HTML file, copying the following code and saving this in the Sites folder.
<html>
  <head>
    <script src="https://aframe.io/releases/1.2.0/aframe.min.js"></script>
  </head>
  <body>
    <a-scene>
      <a-box position="-1 0.5 -3" rotation="0 45 0" color="#4CC3D9"></a-box>
      <a-sphere position="0 1.25 -5" radius="1.25" color="#EF2D5E"></a-sphere>
      <a-cylinder position="1 0.75 -3" radius="0.5" height="1.5" color="#FFC65D"></a-cylinder>
      <a-plane position="0 0 -4" rotation="-90 0 0" width="4" height="4" color="#7BC8A4"></a-plane>
      <a-sky color="#ECECEC"></a-sky>
    </a-scene>
  </body>
</html>
With localhost, this creates the following scene:
Three.js
Three.js can use WebGL to render scenes on all modern browsers. You can set up this with their Creating a Scene manual. I created a new folder in the Sites directory, then created an html and added a js directory with a copy of the three.js file.
In the html, I copied the following code:
<!DOCTYPE html>
<html>
    <head>
        <meta charset="utf-8">
        <title>My first three.js app</title>
        <style> body { margin: 0; } </style>
    </head>
    <body> <script src="js/three.js"></script>
        <script> // Our Javascript will go here.


        const scene = new THREE.Scene();
        const camera = new THREE.PerspectiveCamera( 75, window.innerWidth / window.innerHeight, 0.1, 1000 );
        const renderer = new THREE.WebGLRenderer();
            renderer.setSize( window.innerWidth, window.innerHeight );
            document.body.appendChild( renderer.domElement );

        const geometry = new THREE.BoxGeometry();
        const material = new THREE.MeshBasicMaterial( { color: 0x00ff00 } );
        const cube = new THREE.Mesh( geometry, material );
            scene.add( cube );
            camera.position.z = 5;
        const animate = function () { requestAnimationFrame( animate );
            cube.rotation.x += 0.01;
            cube.rotation.y += 0.01;
            renderer.render( scene, camera ); };
        animate();


        </script>

    </body>
</html>
This creates the following scene:
You can edit the code on Fiddle.
Downloads
Explore more like this
Week 17 Invention, Intellectual Property and Business Models
After acing through the technical assignments of Fab Academy, the last two weeks have a lighter load so we can focus on the final project. But this does not mean...
Week 16 Applications and Implications
Propose a final project masterpiece that integrates the range of units covered, answering: