
We decide to make some measurements on the node designed for networking week. It uses an attiny45 microcontroller, and has an LED connected to PB0. So the board was programmed to make the LED light up for one second and turn off for another second.
We were expecting a square signal showing the on and off states of the pin connected to the LED, which is what we saw on the oscilloscope.
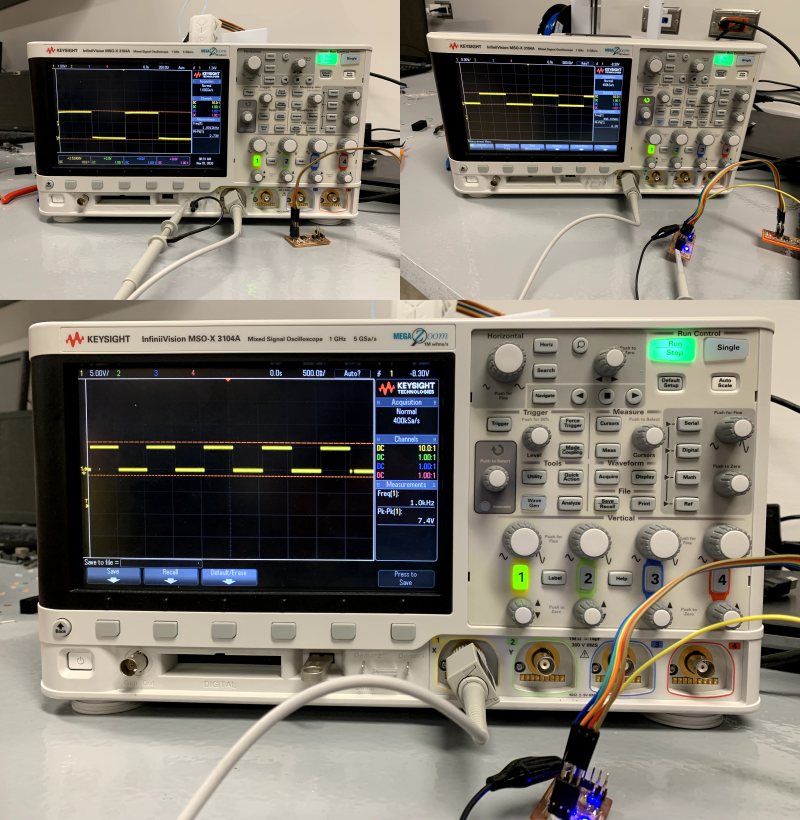
The three images show changes we made on the programming changing the blink frequency of the LED and the intensity. The frequency reading went from 1 kHz to 0,5 kHz, and the voltage changed between 6 V and 2,7 V.
We changed the on/off time to 1 ms. So we had to adjust the horizontal scale to be able to distinguish the signal changes.
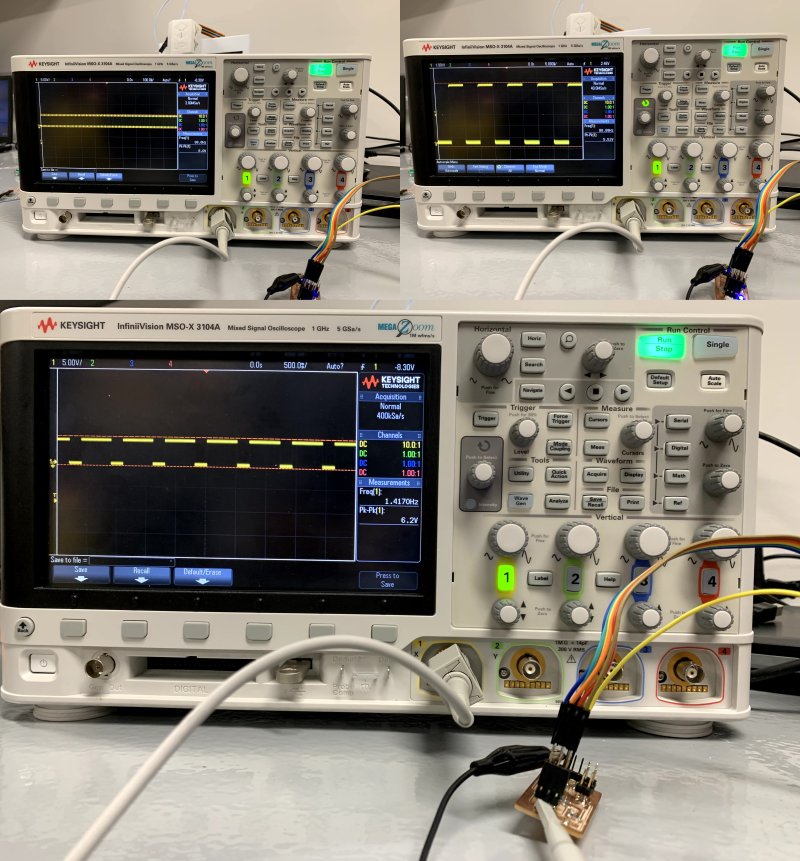
Finally, we sent an asynchronous signal to the LED so the on/off times are different.
We used the Arduino IDE fade example, which dims in and out the LED with a pwm signal (pulse width modulation)
The pwm switches the supply voltage on and off quickly, variating the average power sent to the led. This gives the appearance of dimming.
It can be seen that as the lower line of voltage (0 V) gets bigger, the led dims out. As the upper line grows, the led shines brighter.