Intro
This week I was encouraged to try Processing, which is described as a "flexible software sketchbook and a language for learning how to code within the context of the visual arts".
Our local instructor of the week, Ivan explained to me that the main processing principles are:
- The draw method: it is called periodically and updates the screen content
- The setup method: It is executed only once, when the app starts.
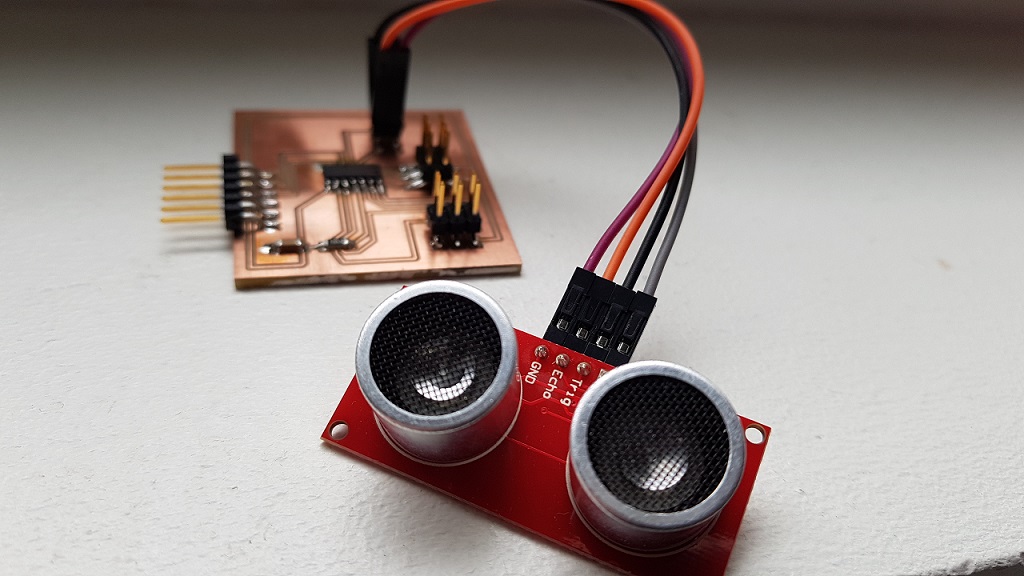
I am building a simple wall avoiding robot for my final project at FabAcademy, and had previously gotten my input board (a sonar) to work on week11, and tested it with Neil's Hello.HC-SR04 python code which worked just fine. Because of this, I decided to use my sonar board also for this task continue with trying to visualize the same values.
In my sonar board, I have the following code uploaded:
- Sonar for Attiny44 .c code
First try - The pulse sonar with processing
I started by searching the fabacademy site for others that have worked with sonars and visualizing the sensor data from them. I found out Ivan had done something similar for his project with Processing. I decided to download his code and start with it as the basis, just to modify it a bit to see how processing works.
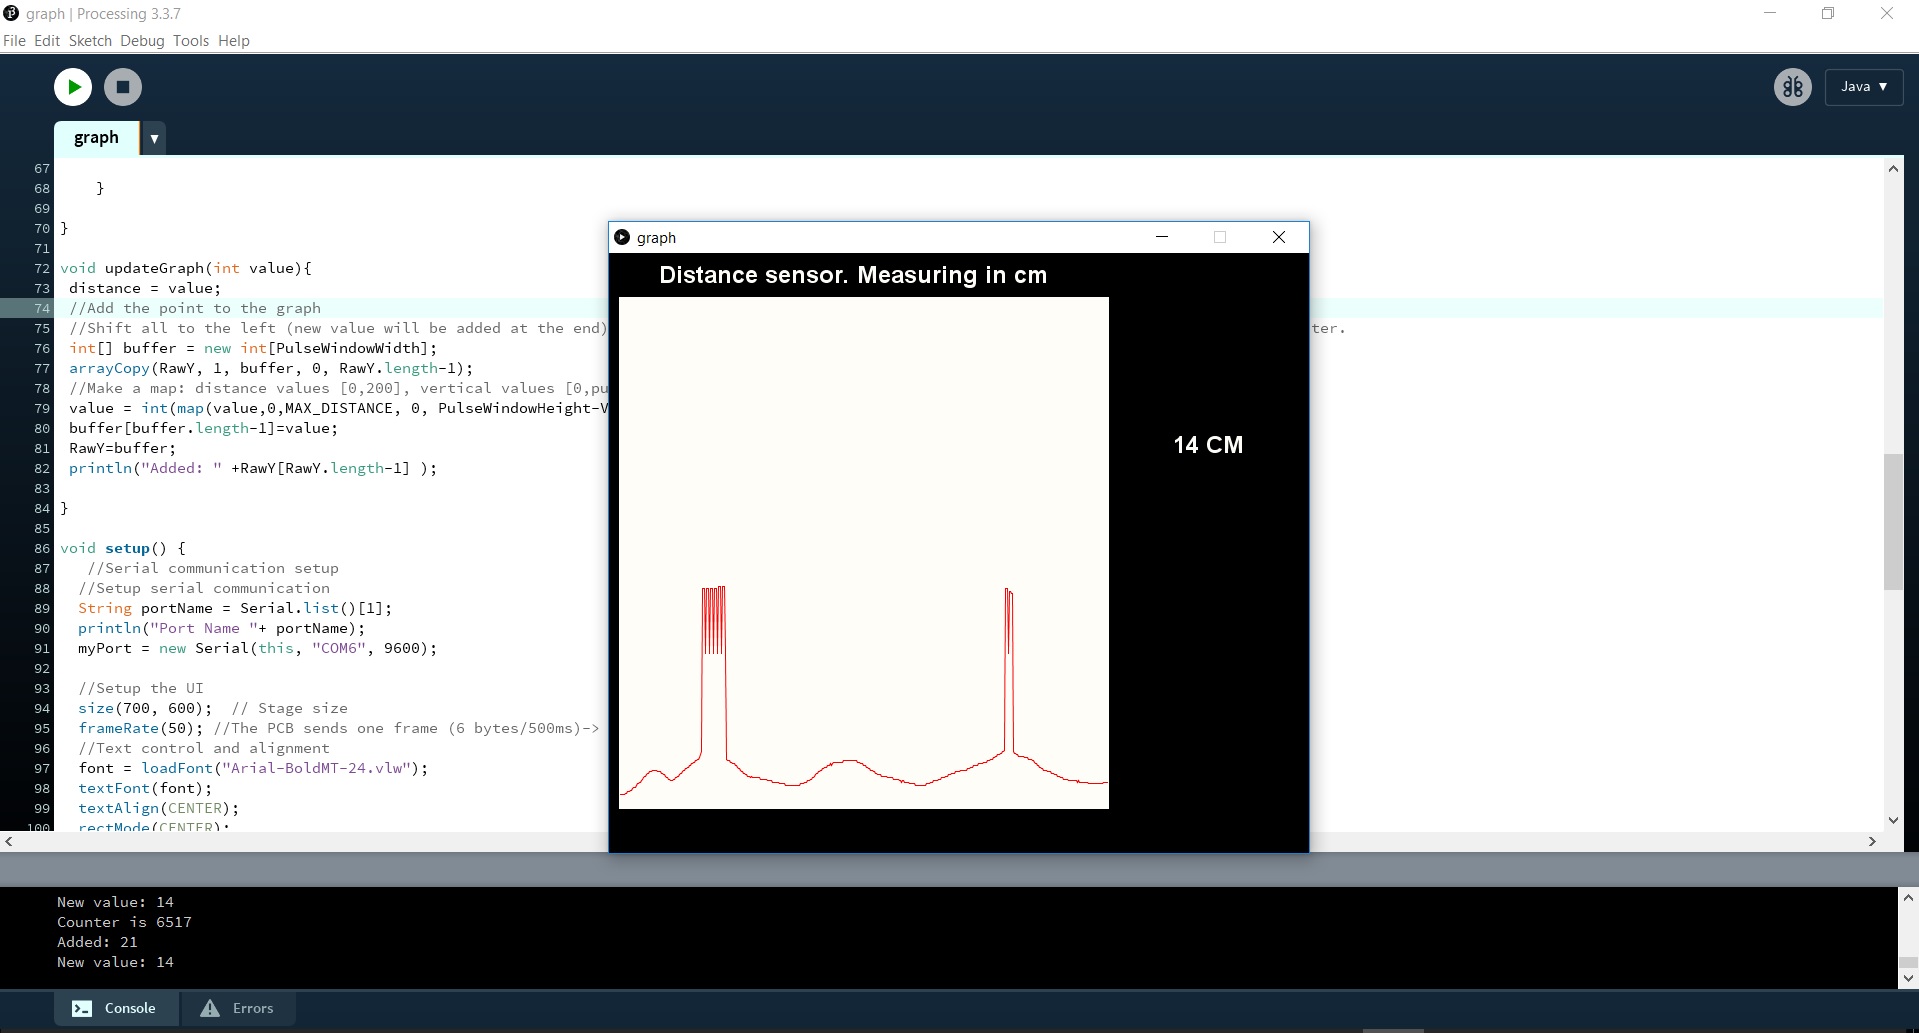
Ivan had found a heart rate monitor/graph code from Instructables, that he saw could be also used to represent sonar data. I downloaded it and was able to run it successfully. Below you can see Ivan's processing program showing data from my sonar.
I studied from Ivan's documentation how the code works. I am trying to break it to smaller pieces below, while also making my own small changes to the code:
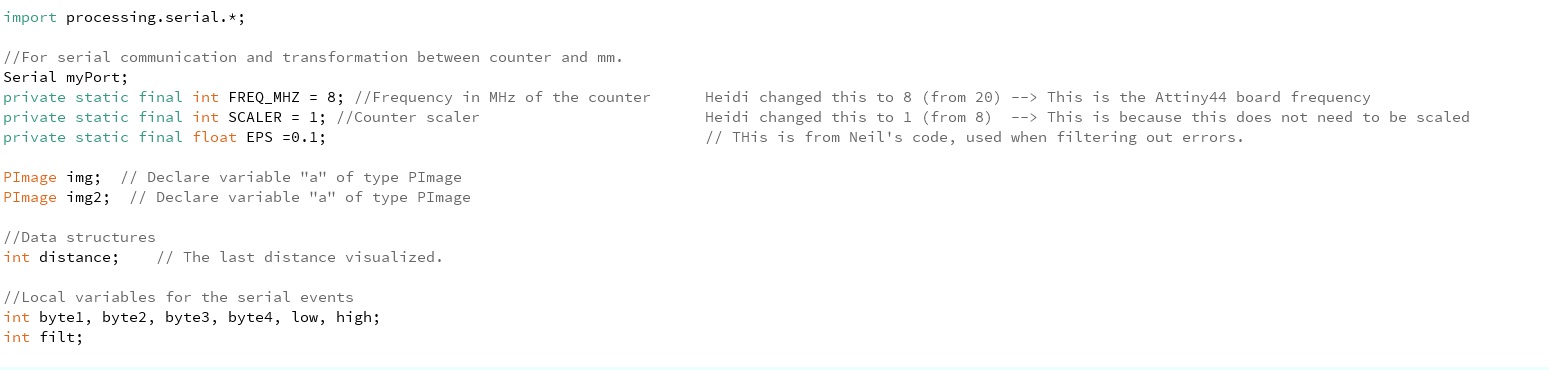
First we include the serial library. It reads and writes data to and from external devices one byte at a time (in other words it allows two computers to send and receive data) and can be used to communicate with custom microcontroller devices and to use them as the input or output to Processing programs (Processing, 2018).
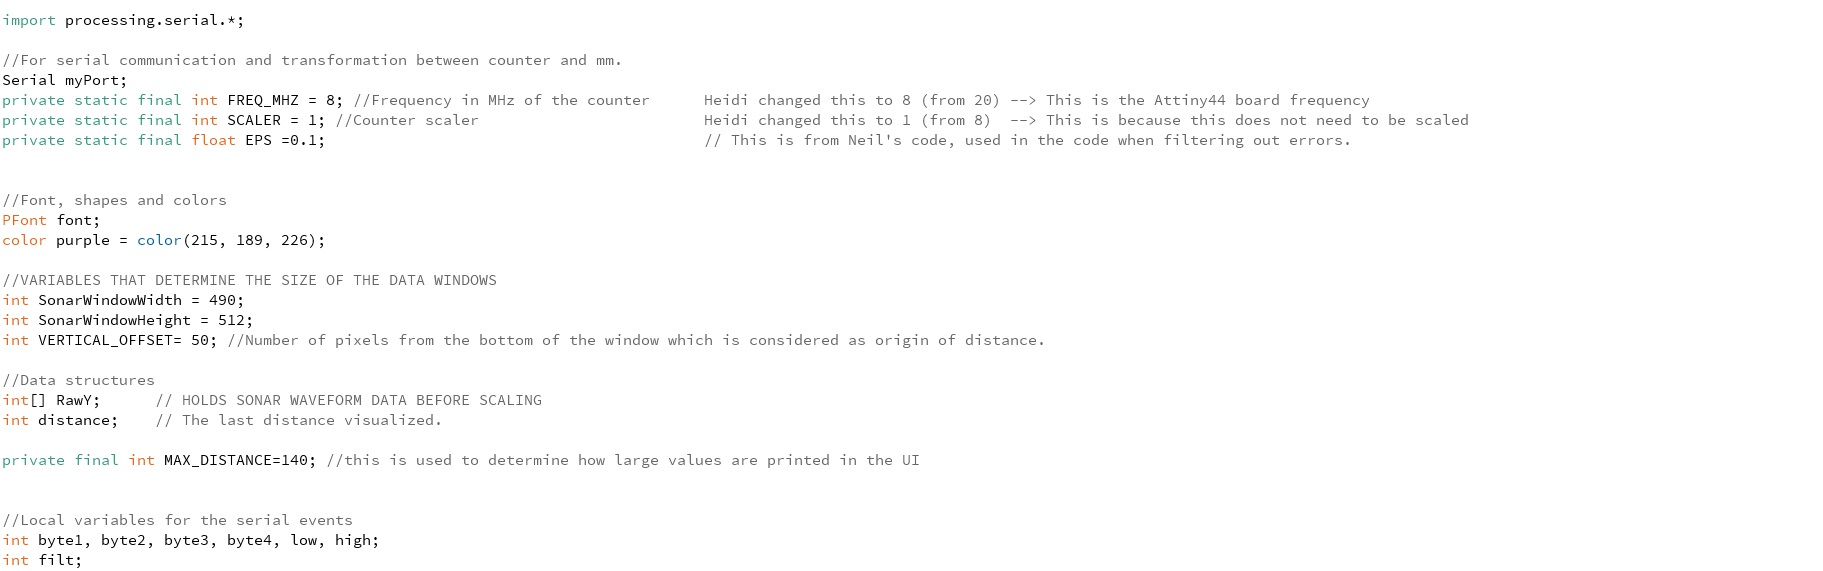
Then we define variables used in the code:
- for serial communication
- for transformation between counter and cm
- for fonts and colours used in the data window
- for the size of the data window
- for data structures
- for local variables
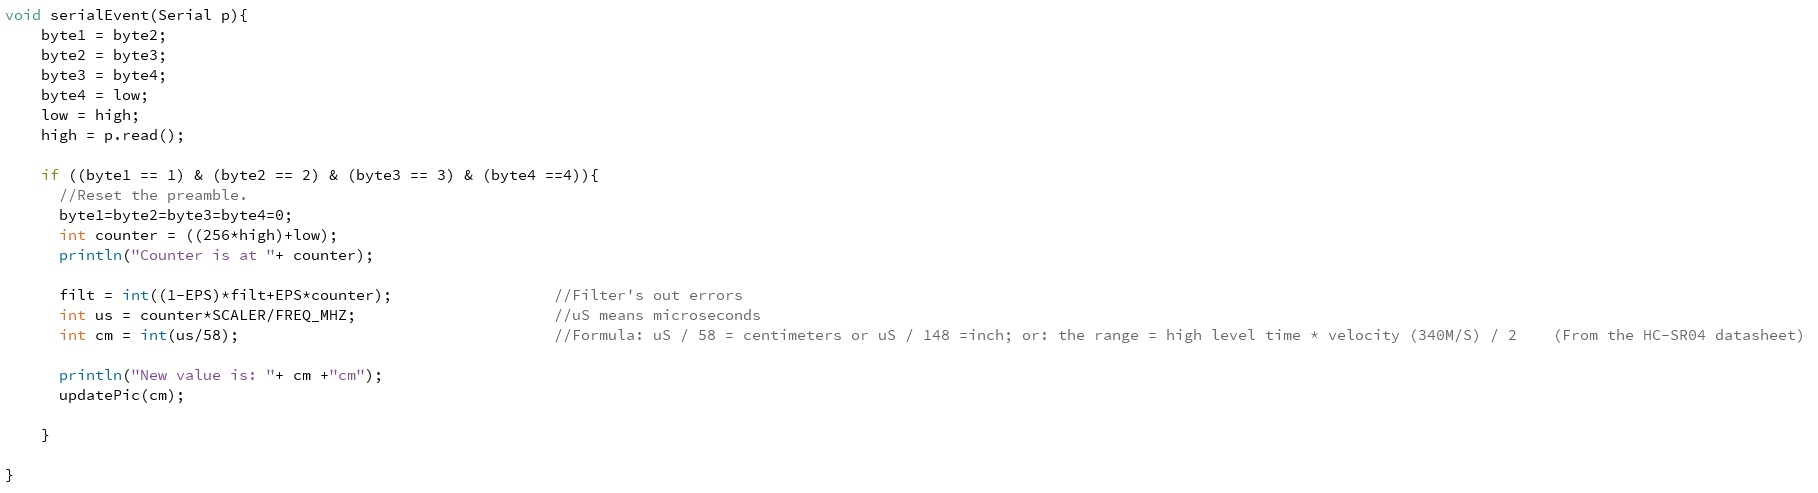
SerialEvent is used to receive data from the serial port.
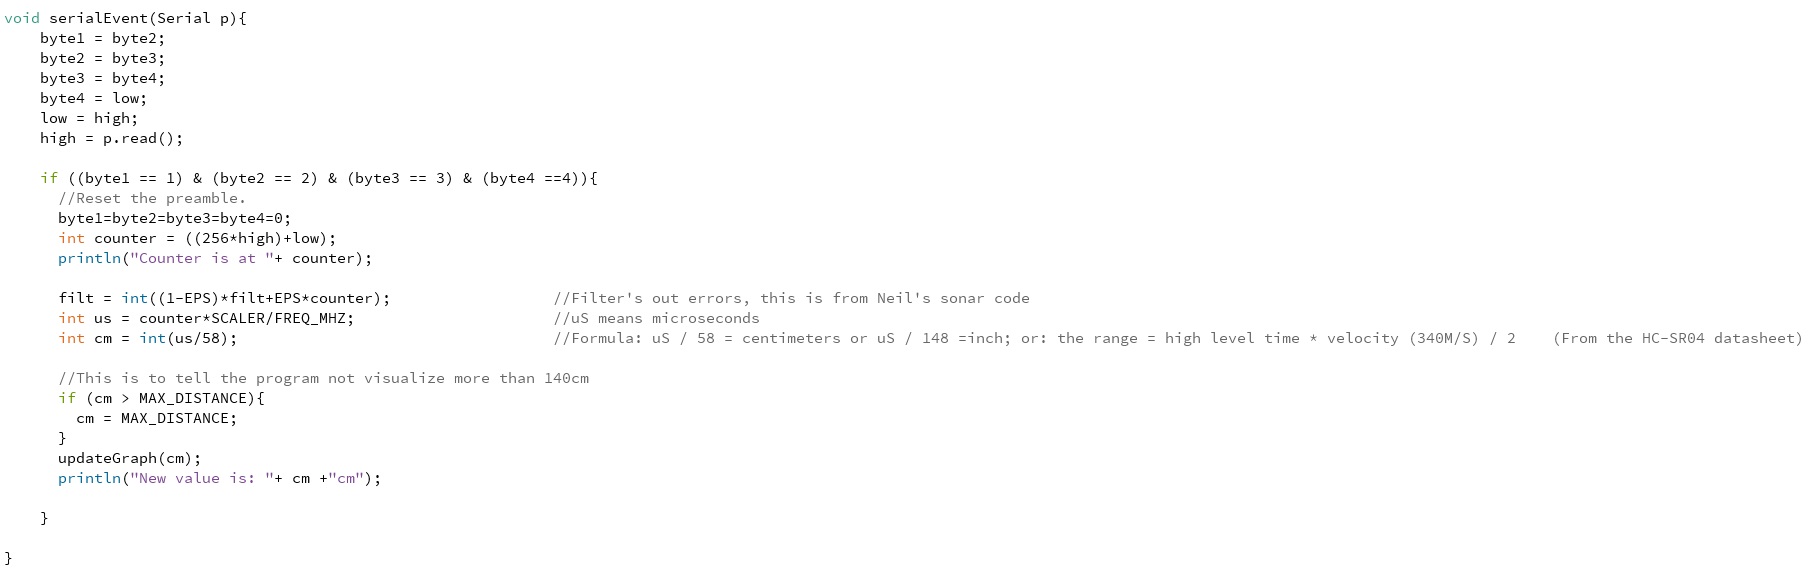
- When it is executed, it checks if there are bytes available in the serial port --> If there are bytes available, they are stored in temporal variables (high, low, byte4, byte3, byte2, byte1).
- If those bytes contain the frame structure defined in the PCB: (byte1 == 1) && (byte2 == 2) && (byte3 == 3) && (byte4 == 4) --> then the program goes on to process the data.
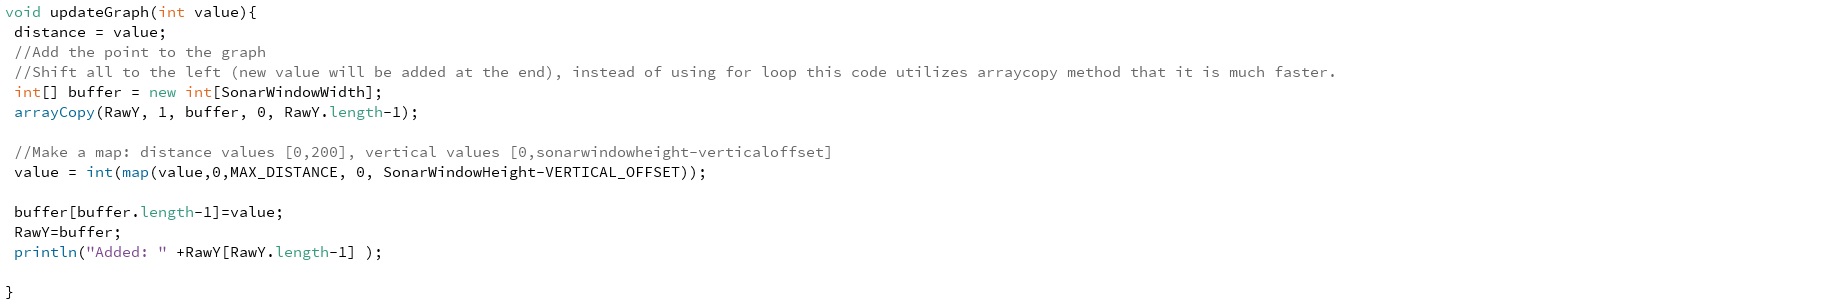
-- First the counter values received from the sensor are turned into cm
-- Then the cm value is passed to the method updateGraph(int value)
updateGraph method, like the name says, draws the new point into the graph and updates it whenever new data is received from the sensor.
setup
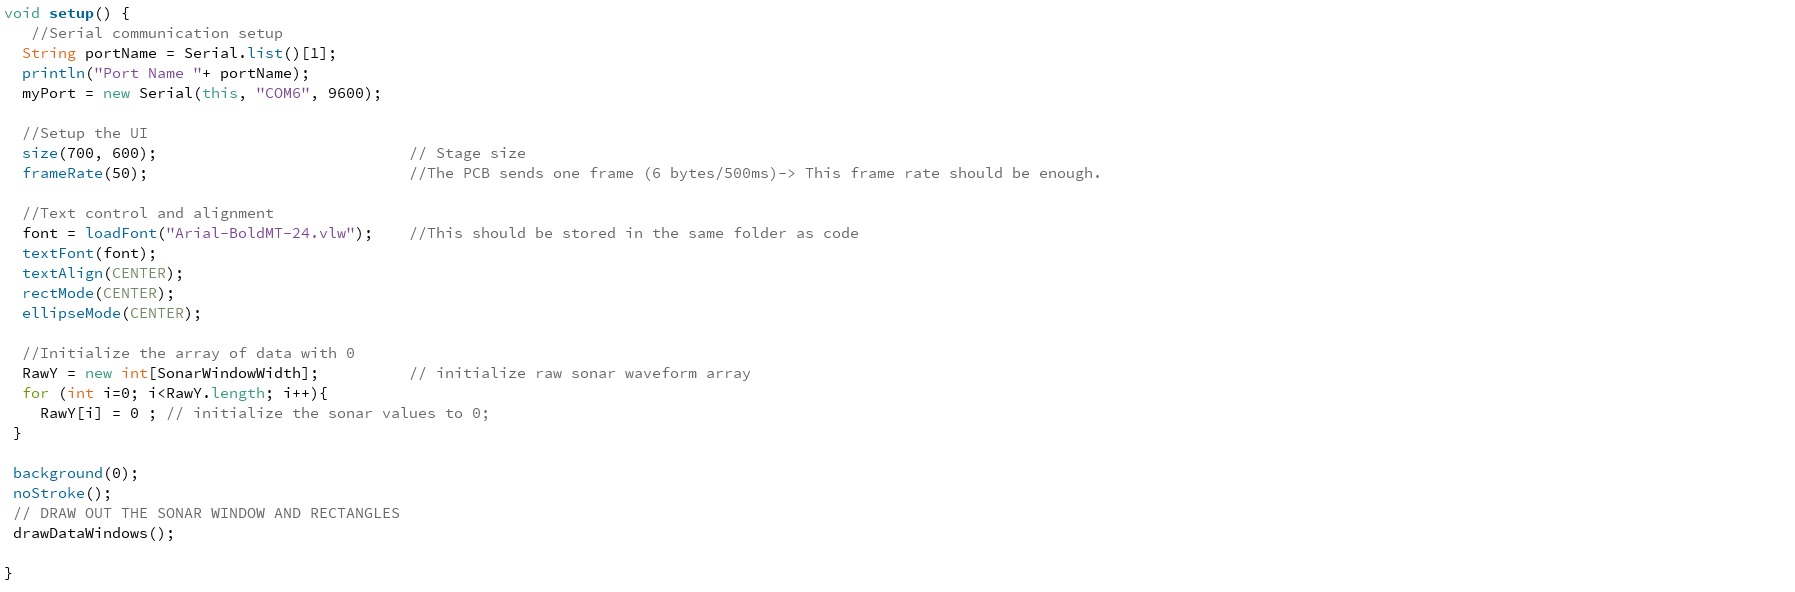
- Opens the correct port
- Sets up the user interface
- loads the font, and aligns text
- initializes array of 512 elements that holds the values reveived from the sonar to 0.
- And calls drawDataWindows
drawDataWindows does just that - Draws out the data window.

Lastly the draw method
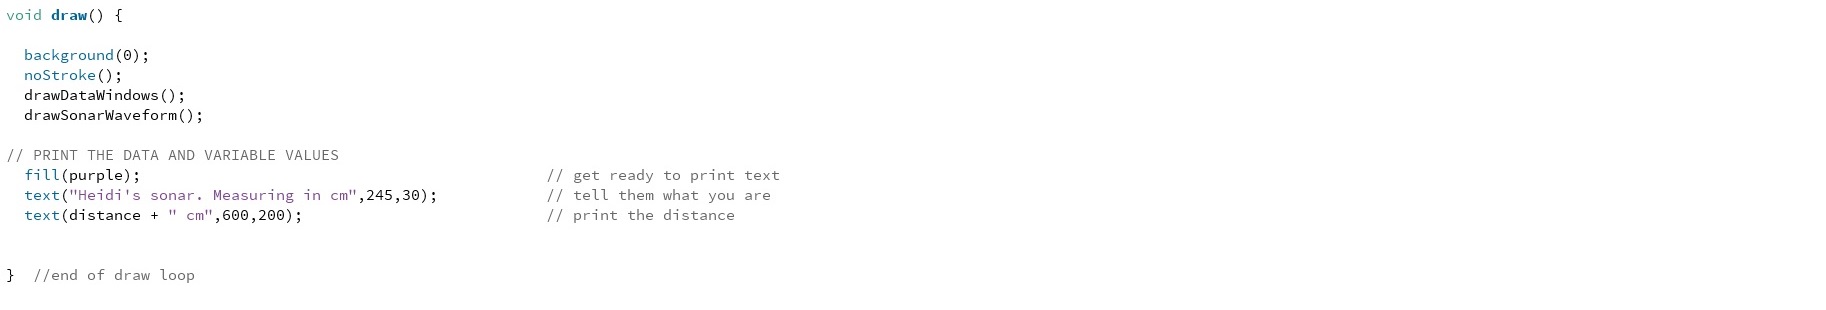
- erases the current screen by using the drawDataWindows() we saw before
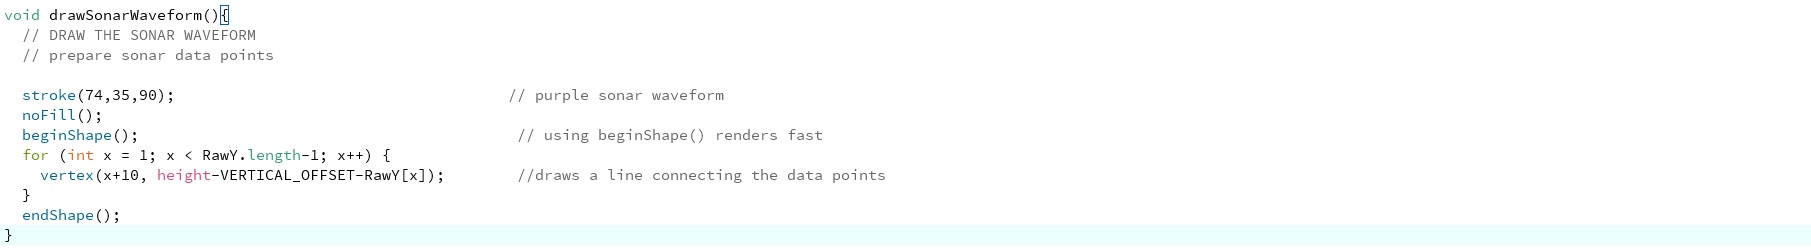
- draws the graph again using the drawSonarWaveForm()
What I changed: I modified the code Ivan had modded to suit an Attiny44 with 8MhZ clock. As for functionality I did not change anything. I only changed the look and feel of the program so the end result is still heavily relied on the original code. I also tried to add my small clarifications to the code to make it easier to modify later.
Here is the final result
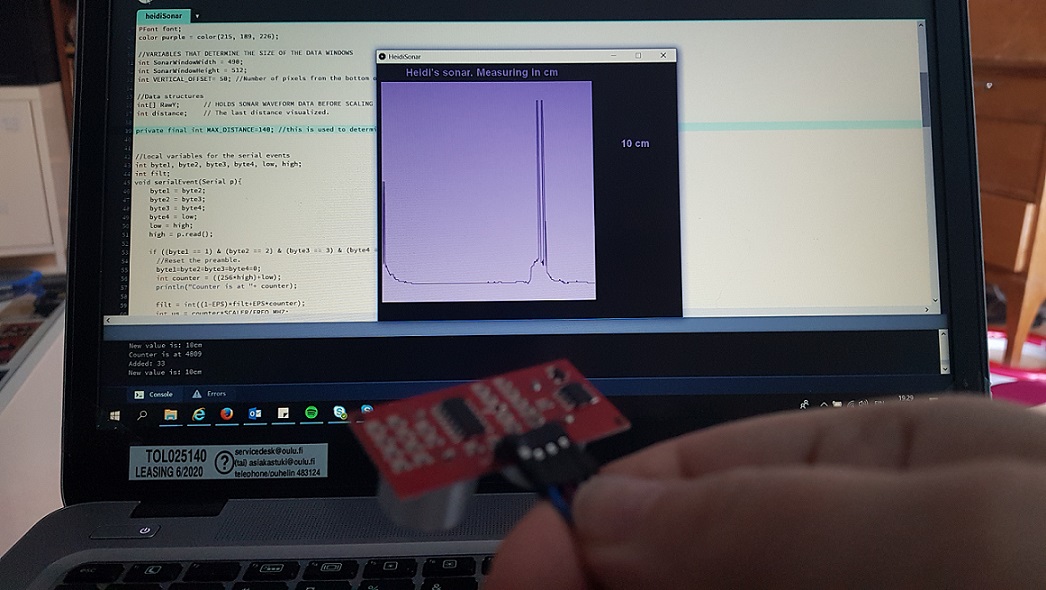
Changes I made to the outlook:
- Made the background, the text and the sonar graph purple
- Displayed the name Heidi's sonar
Here are the files for the Sonar
- The modified sonar waveform code for Processing
- The font that is used (should be placed in the same folder as the code)
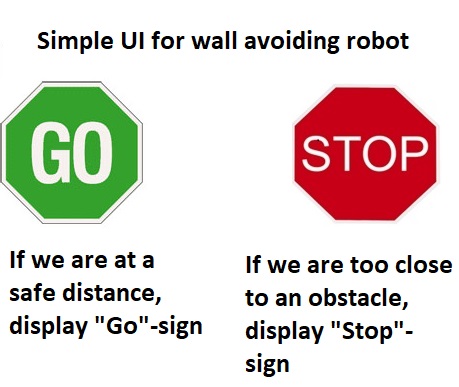
Second try - Display "stop" or "go" pics on the screen
Now that I had seen how processing works, and had inspected the code a bit, I had my own idea how to use the values we obtain from the sonar. I wanted to try and display on the screen different pictures based on sonar values received: If the sonar sends a value that indicates that we are too close to an obstacle, the program would display a stop sign. Otherwise it would always show a go sign. Handy for a wall avoiding robot, right?
I figured that for this code, I could use parts of the sonar waveform code above, mainly the parts for serial communication and for receiving and handling the sonar values and build an if - else statement for displaying the pictures. To help me with this, I found a helpful example in the Processing website
I started by including the serial library and defining the variables, now adding the two pictures there
SerialEvent is again used to receive data from the serial port.
- First the counter values received from the sensor are turned into cm
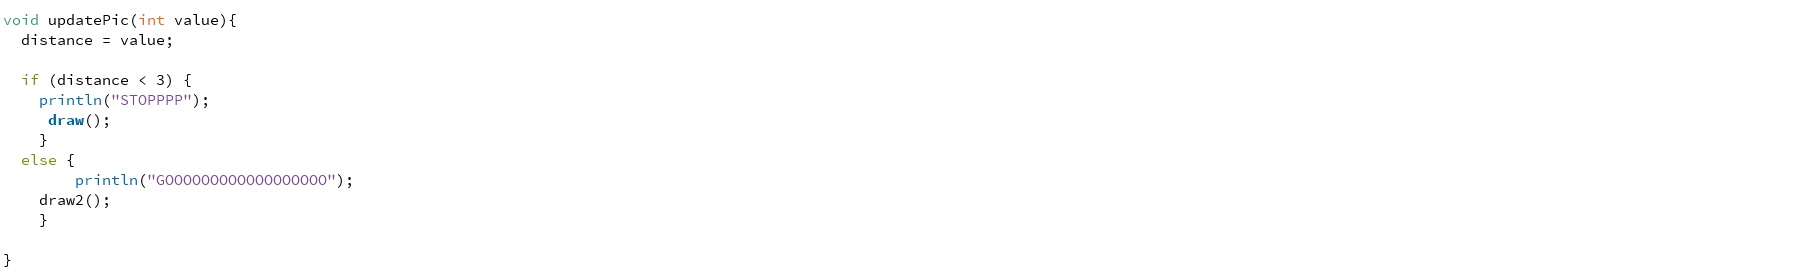
- Then the cm value is passed to the method updatePic(int value)
updatePic method receives the cm the sonar sends
- if the cm measure is smaller than 3, it calls to draw,
- else it calls draw2
setup
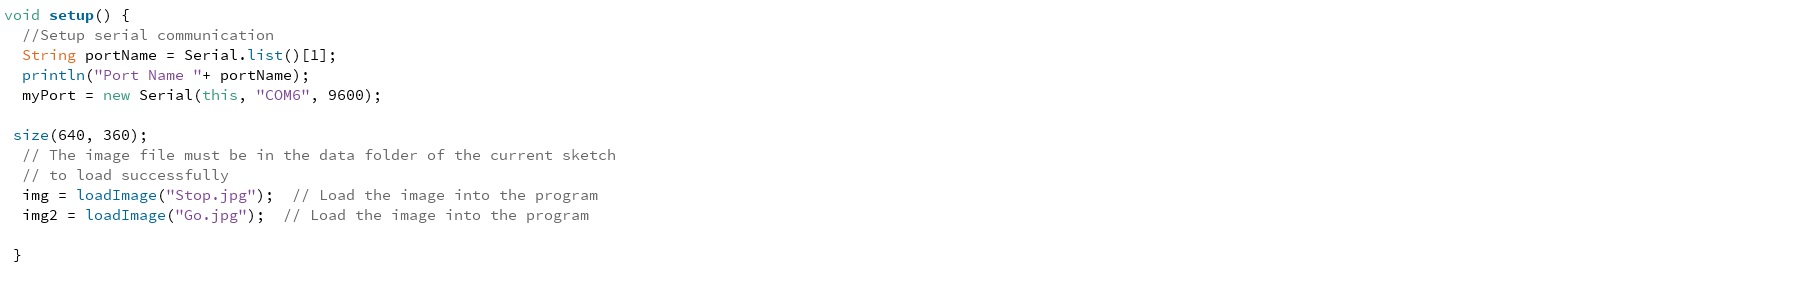
- Opens the correct port
- Sets up the user interface
- And loads the stop and go images to the program.
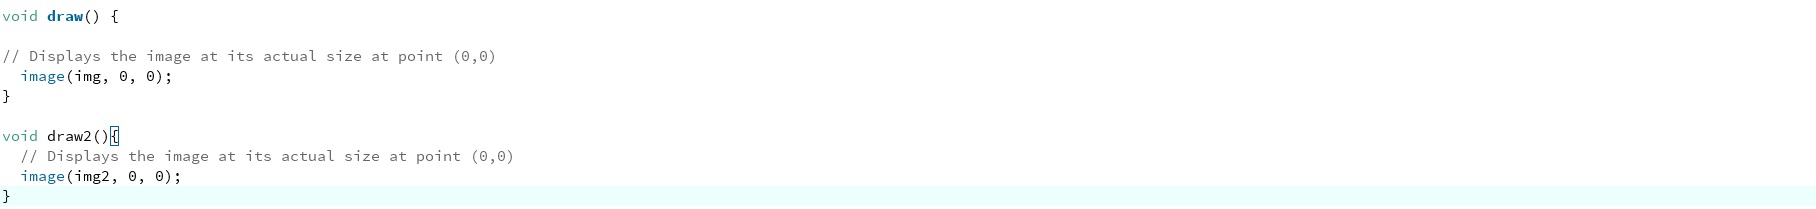
Finally, the draw and draw2 methods, that are simply supposed to show a specified image
This did not work.
It shows the "stop" -image when it is supposed to (when cm is smaller than 3), but the sonar value is not updated after the first value, instead I get a serial error and the program stops working.
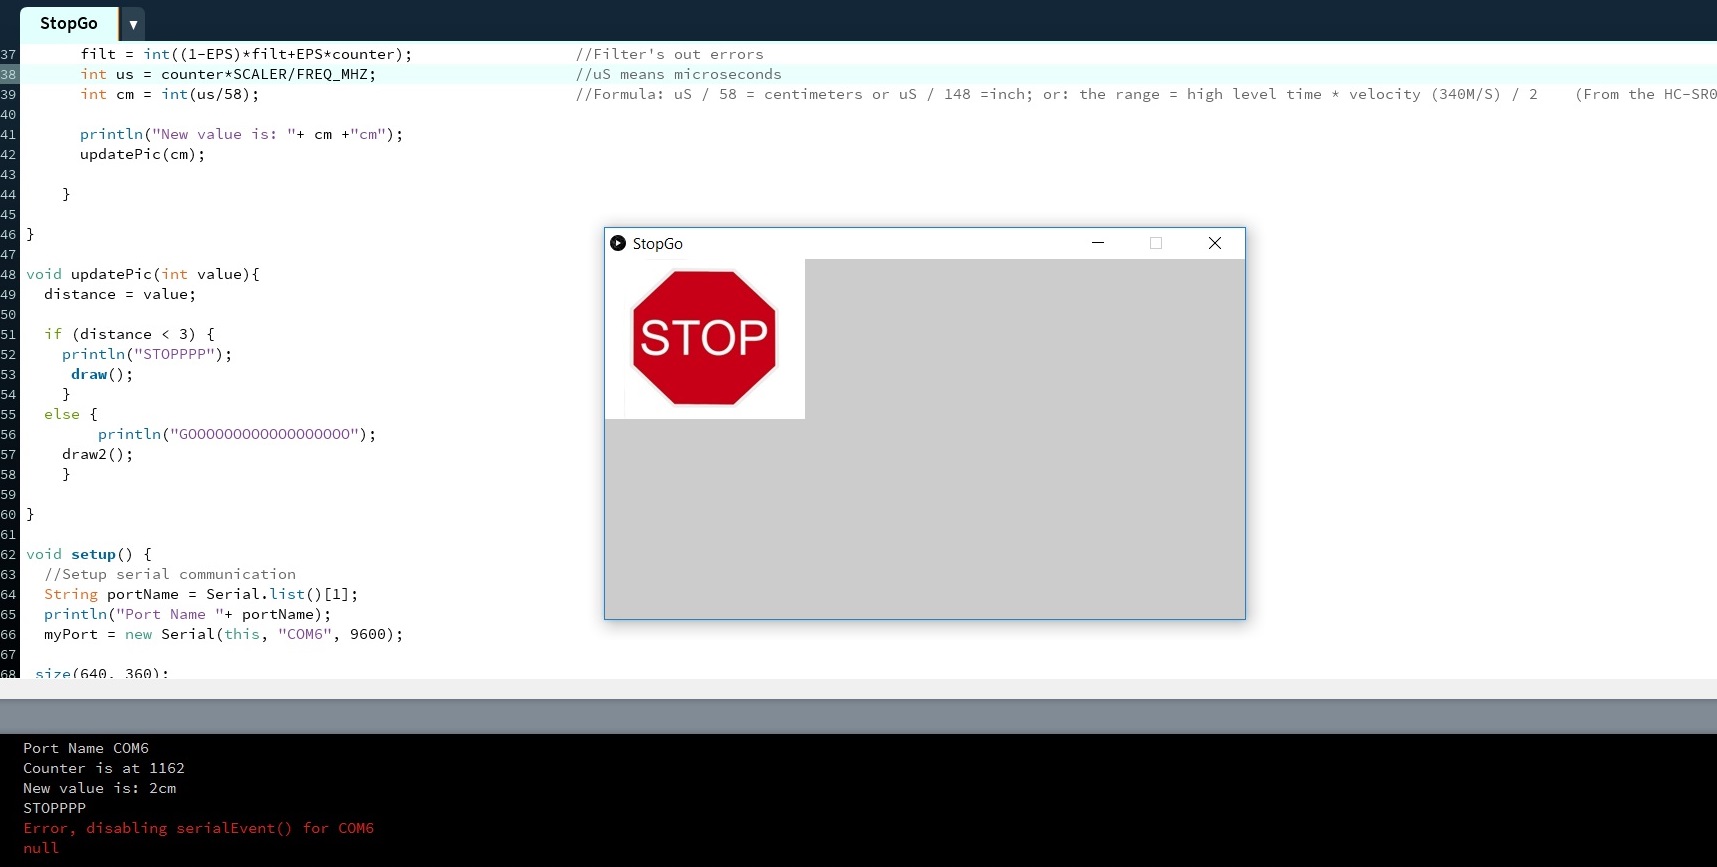
It also shows the "stop" -image when it is not supposed to (when the cm is larger than 3), here again the sonar value is is not updated after the first value, instead I get a serial error and the program stops working

So it seems I have 2 separate problems:
- My if-else statement is not working properly, it always goes straight to the draw() to display the stop sign even when it is supposed to show a go sign. I found a helpful section from the processing examples on draw method. It basically explains why my code always ended up showing the stop picture: It is because draw method is always automatically called after setup, and should never be called in the code separately. So basically I should just try to build my "if-else"-statement inside that draw method.
- The sonar value does not seem to be updating, instead the program crashes. My local instructor Ivan later explained to me that I might get the serial error because I am trying to call draw() from the SerialEvent
I tried playing with this for a great deal of one weekend, but was not succesful. so I present to you the crappy original code that nobody in any circumstances should ever use.
Here are the files for the not working StopGo interface
- StopGo interface processing code
- Go sign from wikimedia commons (should be placed in the same folder as code)
- Stop sign from wikimedia commons (should be placed in the same folder as code)
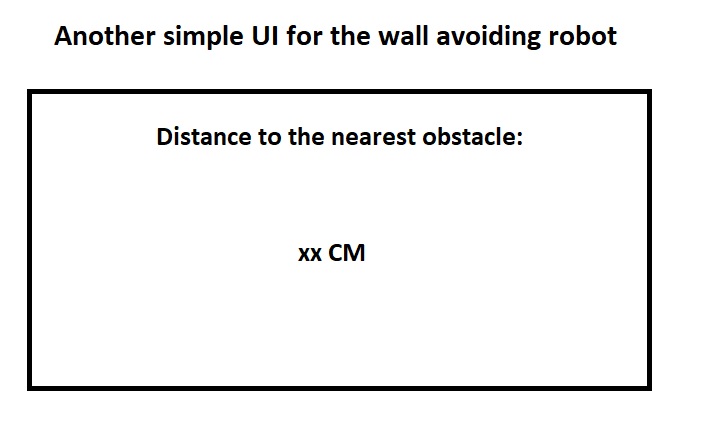
Third try the charm - Displaying the sonar value and pic on the screen
After struggling a couple of days and not getting anywehere with my Stop/Go picture idea, I decided I would just try and display the values that come from the sonar on the screen to indicate how close we are to an obstacle.
For this purpose I decided to try the g4p tool for building graphical user interfaces in processing as was suggested by our local instructor Ivan. I downloaded it to Processing by selecting tools --> Add tool from the top menu in processing, and then using the search funtion to locate the correct one.
I clicked on file --> new and then before doing anything else I selected the just installed G4P GUI builder from tools --> g4p gui builder. The tool opens up a new design window.
From there I and added a label for Heidi's sonar, and a text field for displaying the values from the sonar, then I clicked on the X to close the design tool.
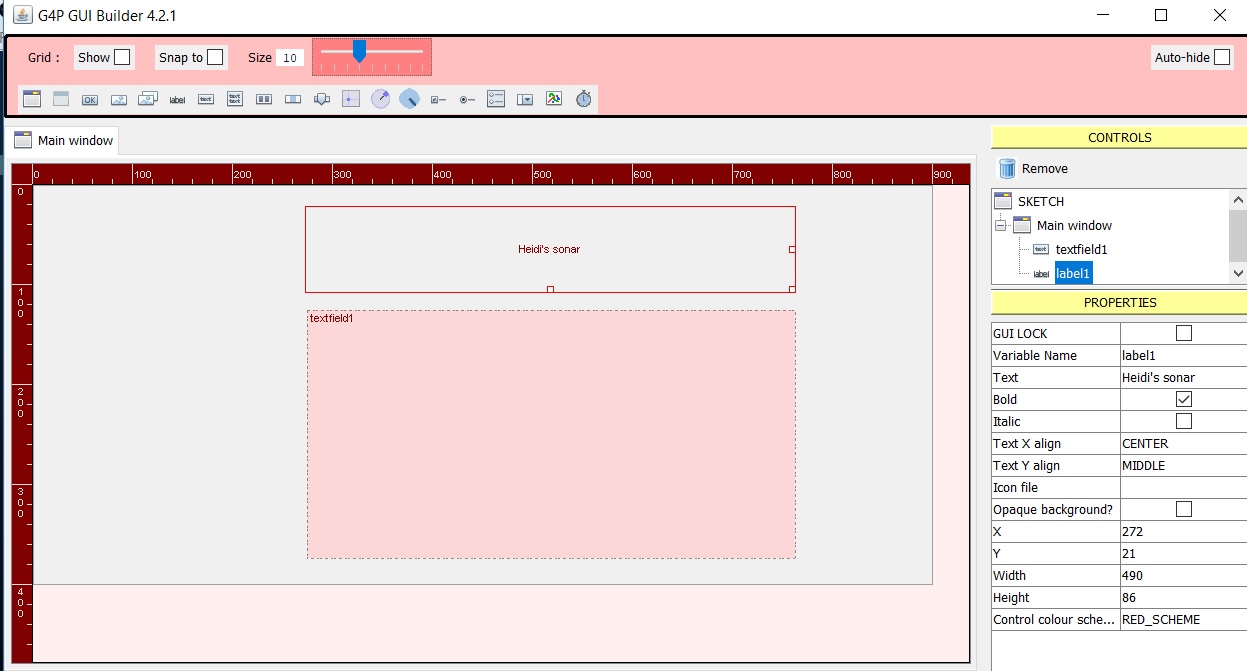
The G4P GUI builder had now automatically created some code for the outlook of the GUI. I did not edit this in any way.
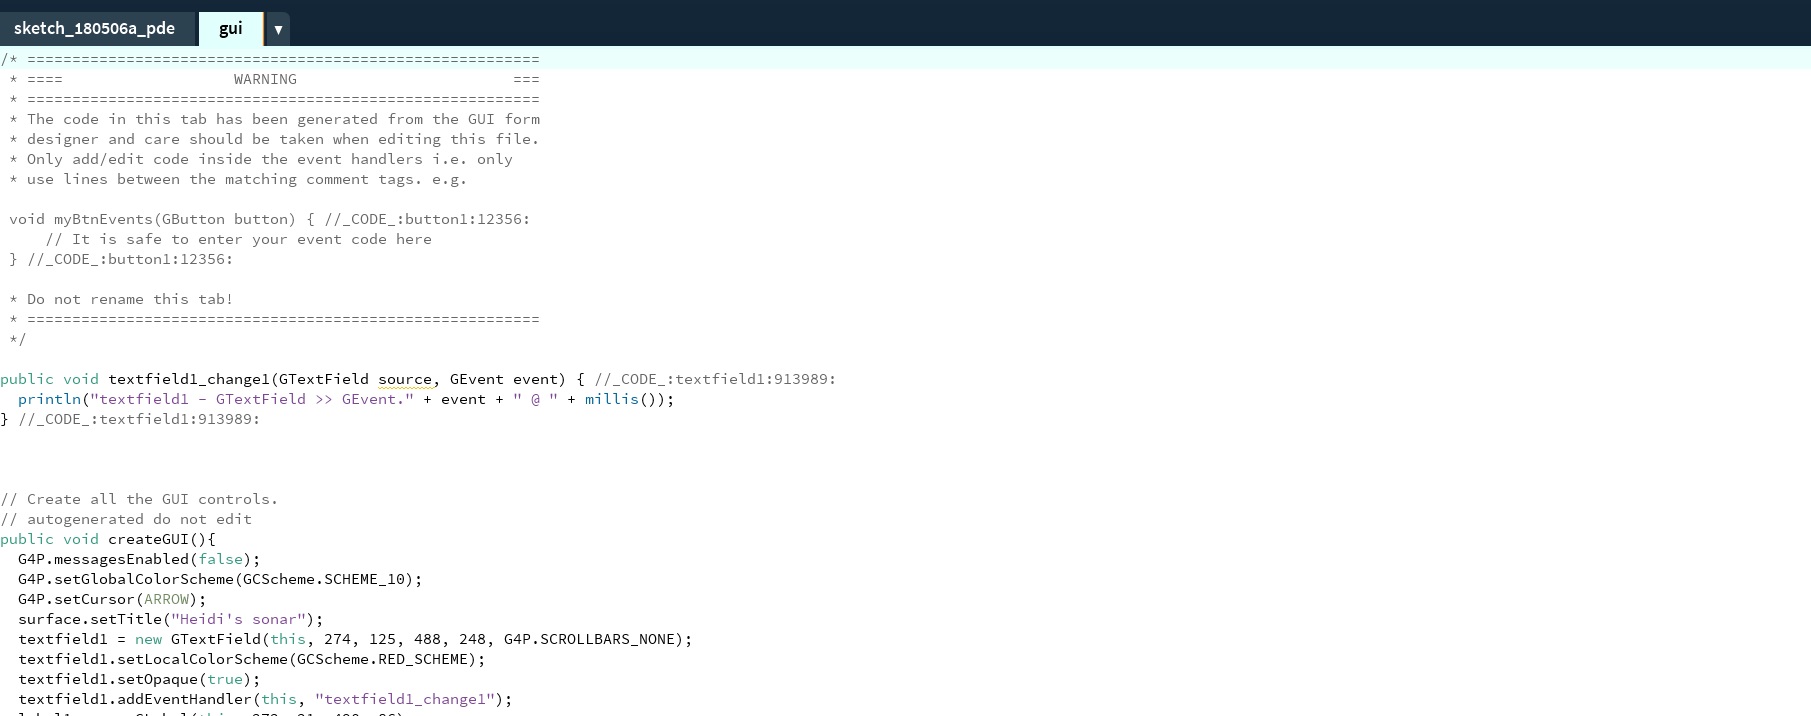
Instead I started to work on the functionality of the program, using Ivan's/Instructables code explained in example 1 as the basis for serial communication and reading the sonar values. I also took a look of Ivan's other examples of working with G4P
I started with importing needed libraries and defining the variables again.
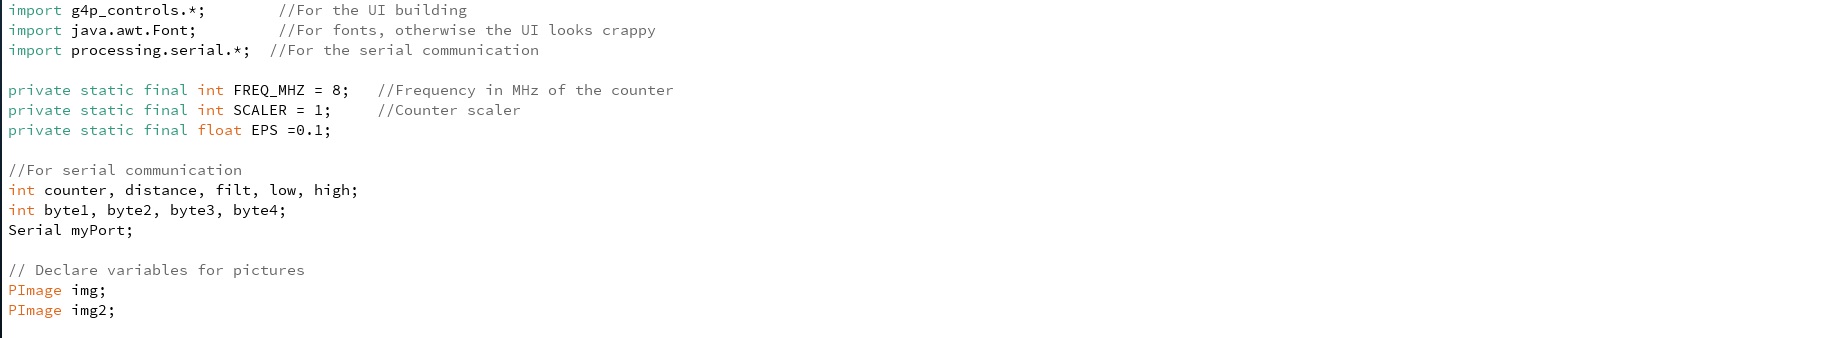
- I includes the libraries for G4P controls, fonts and serial communications
- I defined variables for conversion between couter and mm and for serial communication,
-I also define the variables for the pictures here again, hoping to find a way on how to get them working.
Next I moved to the setup
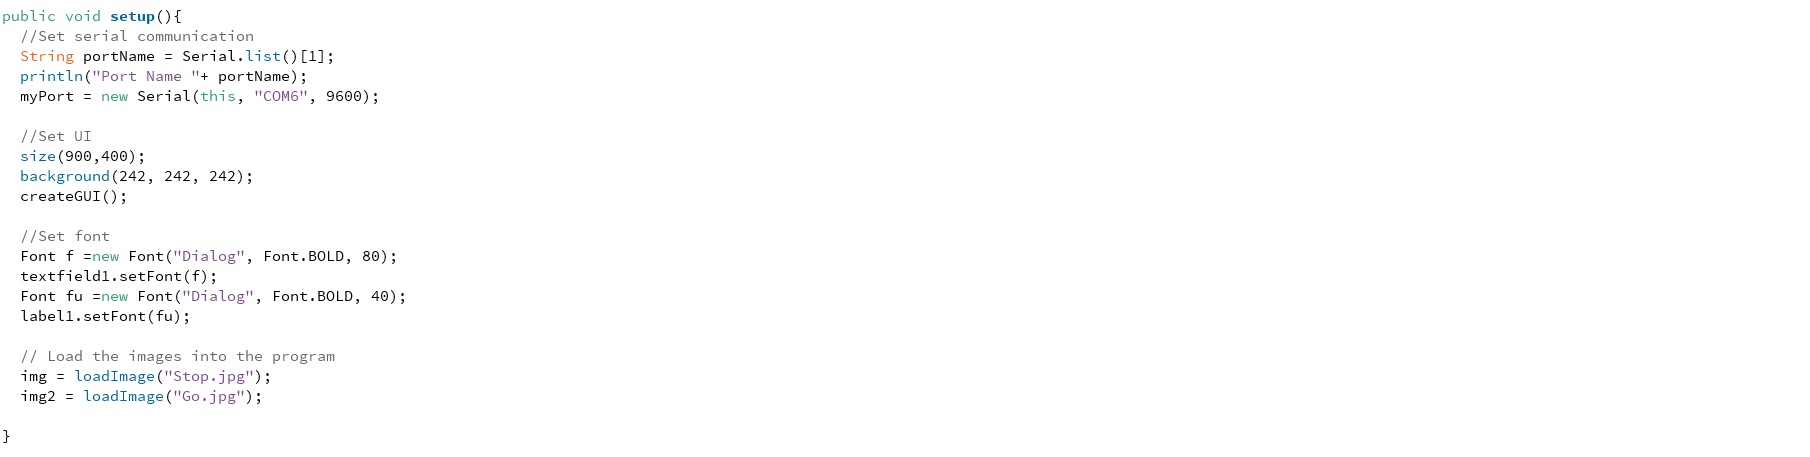
- I set serial communication
- I set UI
- I set fonts used
- And I load the images to the program
And as we learned from our mistake earlier, after setup comes draw, there is no need to call it separately.
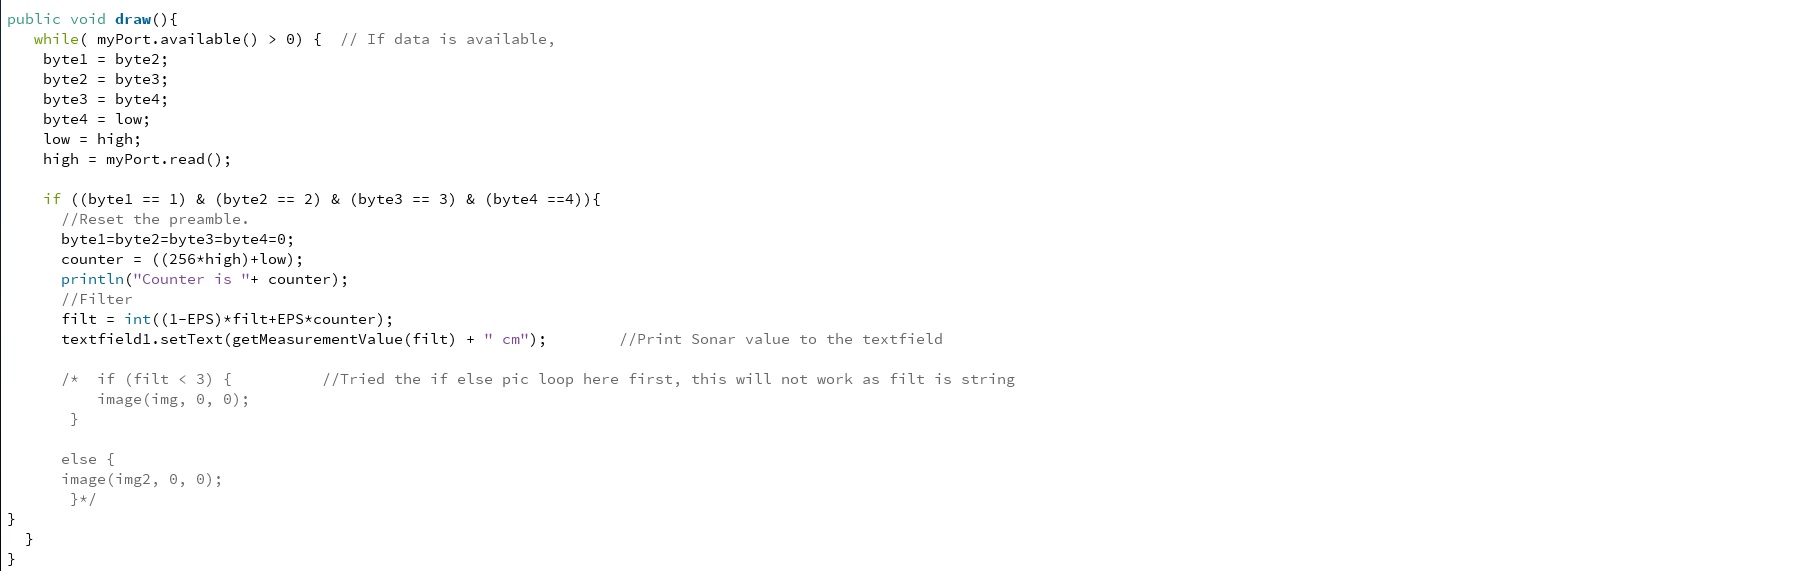
- Here I read port data
- Reset the preamble
- Filter our errors
- And then call for getmeasurementvalue to input text to the textfield
- I also tried to unsuccessfully include here the code to display the stop and go signs. I am not sure why it did not work, but I am assuming because te getmeasurementvalue(filt) returns a string to display in the textfield - And one can not see if string is smaller than 3cm. So I just proceeded to pick up my if- else statement and moved it with me to the getmeasurementvalue () to try it there
Here I should also mention that I had carried the "preamble" thing with me from Ivan's code - and had to finally look up what it actually means. According to techtarget: "The role of the preamble is to define a specific series of transmission criteria that is understood to mean "someone is about to transmit data". Proper timing is required to ensure that all systems are interpreting the start of the information transfer correctly."
Getmeasurementvalue
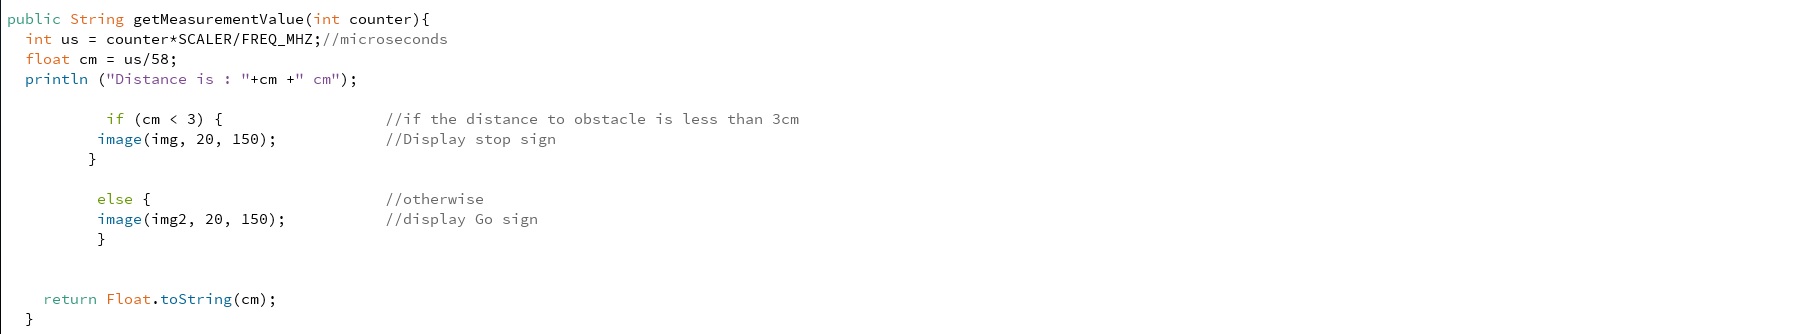
- Does the conversion from counter to cm
- Tries to print out the pictures again - If cm value is smaller than 3 it displays stop, otherwise it displays go.
- Lastly it returns the cm value as string to the draw so it can be included in the text field
Lo and behold! It worked!
Here are the files for the "display sonar + stop & go pics" interface
- A zipped file that contains a) the automatically generated GUI code, b) My code for the functionality and c) the stop and go files
Problems had and lessons learned
- This week it became evident how long it has been since I did any programming. I have behind me the intro to Java, intro to C++, intro to PHP, ASP etc. But that was all over a decade ago during my polytechnic years. As I have not used them since, I very much sucked this week. I should have done some intro to processing perhaps, she said in hindsight.
- For me starting this task was very much struggle. I tend to get lost in the small details: I need to be able to understand what happens in the code each row, otherwise I can not move forward or modify the code. I can not just look at the big picture, or the code as building blocks whose functionality you need not worry about. And this halts me from moving fast enough for rapid prototyping.
- Programming is nothing mystical, I know - it is just passing on simple instructions to a machine in a logical order so that it can do what you want it to do. There is a need to KISS and move forward.
Copyright © Heidi Hartikainen 2018
Template copyright ©Blackrock Digital LLC 2013-2018

This work is licensed under a Creative Commons Attribution-NonCommercial-ShareAlike 4.0 International License.