This week we have to experiment some comunication and programming lenguage with computer and microcontroller
For this week i try to create a connection and a data visualization using a satshakit and processing
Processing is a programming language for making some graphical things using simple instruction and can interact with the arduino like board ( or all things with serial communication).
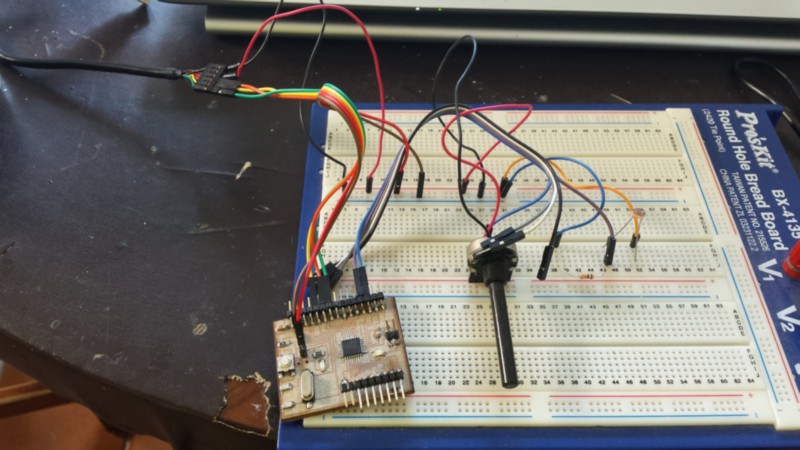
Fist of all I have to create a circuit and a firmware to collect some data and send it in packet to the pc via serial communication(using the atmega serial port and a ftdi cable to convert from uart to usb protocol)
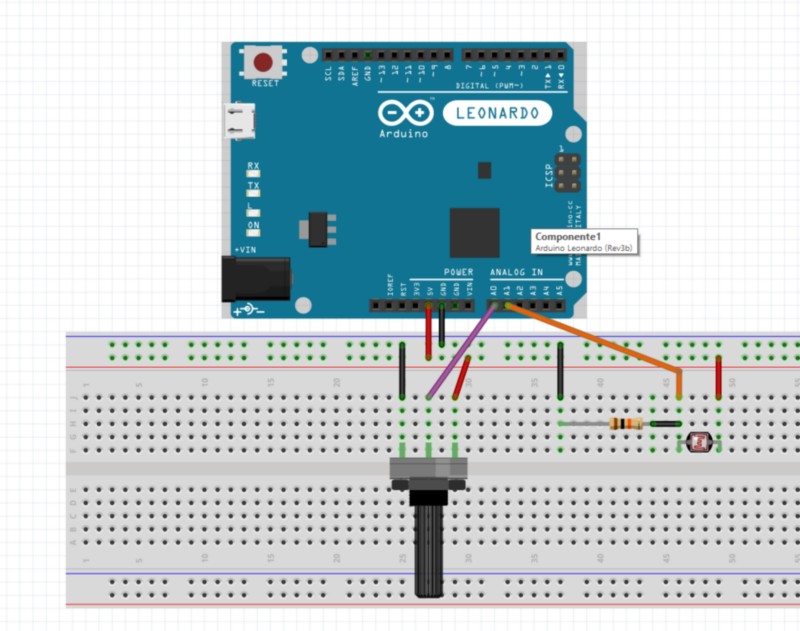
i use a satshakit that will read the analog value from an LDR (light dependant resistor) and a potentiometer, convert it to digital, make a string of the data and send it trough the UART.
in the picture you can see the fritzing diagram of the connection (i use a base for explain the connection the arduino board for be quick but in the next picture you can see I use a fabbed board).
For the firmware side I use a simple arduino sketch I made, posted below.
here the code from arduino IDE
 // pin assignments
 int LDR = 1;
 int TRM=0;

 // initialize the serial port
 // and declare inputs
 void setup() {
   pinMode(LDR, INPUT);
   pinMode(TRM, INPUT);
   Serial.begin(57600);
 }


 void loop() {
   int L = analogRead(LDR);
   int T = analogRead(TRM);
   Serial.print(L);
   Serial.print(" ");
   Serial.println(T); // send the 2 data divided by a space and newline at the end
   delay(100);
 }
i found all the information i use to build the processing interface on the processing main site and in general on the web
I use the serial library imported at the beginning of the sketch, that implement the protocol needed to read the data from the USB ( the COM port on windows),
it will also read the first COM that will send data and assign it to the program.
here the code from Processing
import processing.serial.*;
PFont font;
Serial serial;

int x = 0;
int L= 550;
int T = 450;

int lastX = 0;
int lastL = 550;
int lastT = 450;


void setup() {
  size(600, 600);
  serial = new Serial(this, Serial.list()[0], 57600);
  serial.bufferUntil('\n');
  background(#000000);
}

void draw() {}


void serialEvent(Serial serial) {
  String valueStr = serial.readStringUntil('\n'); //read serial data until new line
  if(valueStr != null) {                          //if strig is not null value
    valueStr = trim(valueStr);                    //trim the string from undesired char
    String[] data = split(valueStr, ' ');         //divide the string data
    L = int(data[0]);                        //L = first data of the array (LDR)
    T = int(data[1]);                      //T = second data Trimmer

    //refresh the high part of the window for make the rectagle to be redraw
    noStroke();
    fill(#000000);
    rect(0,0,600,400);
    strokeWeight(2);

//LDR Data rappresentation
    stroke(#AF0000); //border red
    fill(#FF0000);//fill light red
    textSize(20);
    text("LDR",130,25);
    //point(x,((L/11)+500));
    rect(50, 30, 200, (L/3), 5);
    line(lastX, lastL, x,L=((L/11)+500));

//trimmer data rappresentation
    stroke(#134CAE); // border blue
    fill(#137CAE); //fill light blue
    text("Potentiometer",380,25);
    //point(x,((T/11)+400));
    rect(350, 30, 200, (T/3), 5);
    line(lastX, lastT, x, T=((T/11)+400));

    stroke(#FFFFFF);
    lastT = T;
    lastL = L;
    lastX = x;
    if(x++ >= width) {
      lastX = 0;
      lastL = 550;
      lastT = 450;
      x=0;

      background(#000000); //refresh all the window to background
    }
  }
}
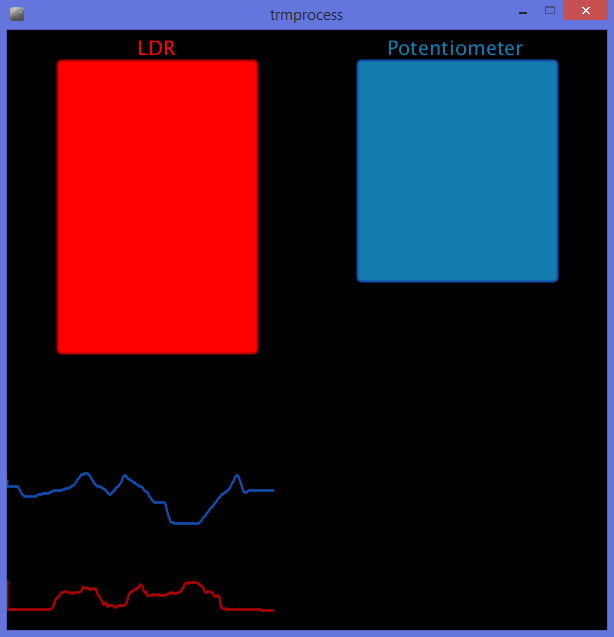
i want to make a instantaneous visualization of the data (so only the current value is displayed) and a history of the variation.
for this purpose i use the high part of the window with two rectangle to display the current value of the readings and the lowest part of the window to make a 1 minute story board like a graphs using the line drawings.
every serial event( data revived) I clean the upper side and re-draw the rectangle, in the down side I reload the background only when I reach the end of the window.
i also used the text function for give a name at the rectangle part