
Our assignment for this week was to " write an application that interfaces with an input &/or output device". I decided to write a python application (using python Tkinter) that would work like arduino therminal with some visualisation features. Processing looks quite attractive too, but trying it isn't my highest priority for now.
I found basic information on python here . I am not a big fan of read-all-the-books-possible-befor-to-start approach, so let's just keep this link in mind in case we need some reference. The best way to understand the programming language (in case it's now your first programming experience) is just to dive into coding.
First we need to ubderstand what functional parts our application consist of (to implement them):
Now we need to find a way to implement all those features!
To communicate with the serial port I used the Pyserial (the simple program example can be found here. It gives us an opportunity to get the data from the serial port and print it into the console (just like serial-port monitor in arduino IDE!):
|
|
That's nice for the first step! We have the information incoming, we can have the text output. It's time to have our GUI!
It appears that there is a lot of ways to make the GUI on python, but I decided to start from Tkinter. There were some reasons for this:
|
The script for this example is:
#!/usr/bin/python |
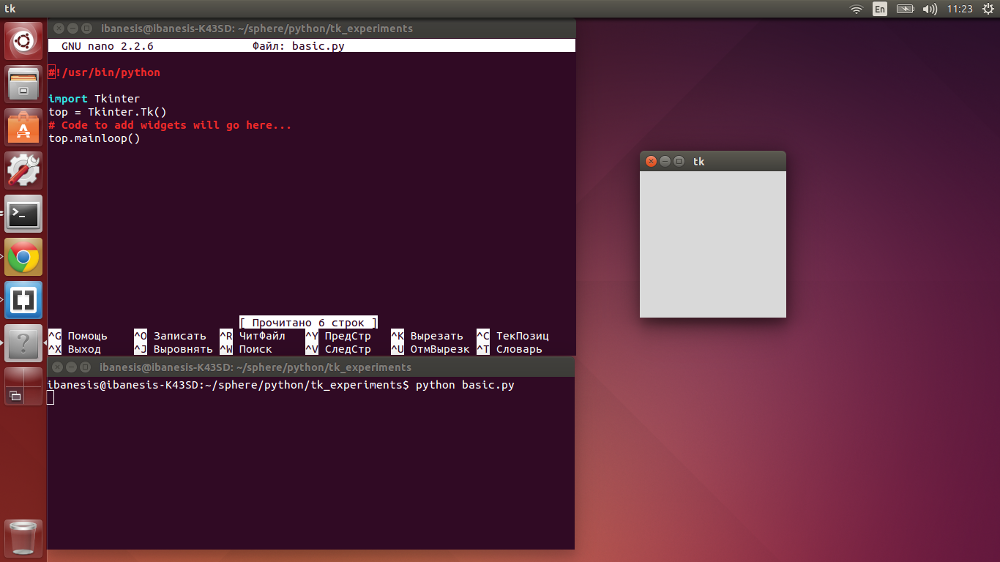
|
It works! In general... Now let's try to add some features!
Let's try to learn something from Neils example for interacting the hello-temperature board! Here's the source code.
First, let's add some elements to the basic window (borrowing them from Neil's example). Lets try to...
Add the name for our app by adding top.title('hello-app')
initialise the variable to contain the window size be adding win_size = 600 (Oh python... SO COOL in data-typing!)
and right after that we can try to work with graphical primitives by adding
1. canvas = Tkinter.Canvas(top, width=win_size, height=.25*win_size, background='white')
NB! The way I made this object differs from Neil's example because the import differs too. As far as I understand, his way of importing gives an opportunity not to mention from where the method used is taken. Still, I am just a beginner in python yet and I am little too short of time to investigate the case in details right now.

You may find this script example here
At this point we have two scripts (one that allows us to get the strings from serial port and the other that gives us the power to visualise the data. What's left to do is to combine them!
Let's add the refresher (borrow it from wxample and change the names to fit our script):
top.after(100,idle,top,canvas)
There's one more thing we need to add to ousr script. We need o add the idle function where all the changes are calculated between the refreshments (see the result here). I borrowed some parts from Neil's example, but I did understand what were they used for. I cahnged some parameters and here how it woorks with my hello-temperature board:
Back to my main page