Week15Interface and Application Programming
José J. Lazarte R.


Assignment
   Write an application that interfaces with an input &/or output device

To make the interface I used the temperature measurement board implemented in the assignment 10.
The pictures below  shows the board and the cable used to connect to the PC through USB port. 
The implementation of the interface was developed in Python. I had  based in the program used to display the temperature in the assignment 10.  In this program only a slider was shown, now some changes have been made; to do so I made a reserch on how to work with the Python program, based on the info links presented in the references.
First I added text to the title of the chart.

canvas.create_text(.55*WINDOW,.1*WINDOW,text='Temperature Measurement',font=("Helvetica", 24),fill="green")

 I created two oval figures.

canvas.coords('radio1',.2*WINDOW,.25*WINDOW,1*x,.2*WINDOW)
canvas.coords('radio2',1*x,.25*WINDOW,0.9*WINDOW,.2*WINDOW)

canvas.create_oval(0,150,150,300,tags='radio1', fill="red")
canvas.create_oval(0,150,150,300,tags='radio2', fill="blue")

And two rectangular which dimensions vary laterally as
temperature changed.

canvas.coords('rect1',.2*WINDOW,.25*WINDOW,x,.2*WINDOW)
canvas.coords('rect2',x,.25*WINDOW,0.9*WINDOW,.2*WINDOW)

canvas.create_rectangle(.2*WINDOW,.25*WINDOW,.4*WINDOW,.4*WINDOW, tags='rect1', fill='yellow')
canvas.create_rectangle(.3*WINDOW,.05*WINDOW,.9*WINDOW,.2*WINDOW, tags='rect2', fill='green')


This makes more attractive the viewing of values changing in the temperature measurement scale.
I used commands in Python which enabled us to scroll the text of the temperature measurement simultaneously with the variation in the figures of the increase and decrease of temperature.

canvas.coords('pos',1*x,.35*WINDOW)
canvas.create_text(.4*WINDOW,.35*WINDOW,text='Temperature',font=("Helvetica", 24),tags=("pos","text"),fill="yellow")

Below is the code used in Python, and an image of the application window.
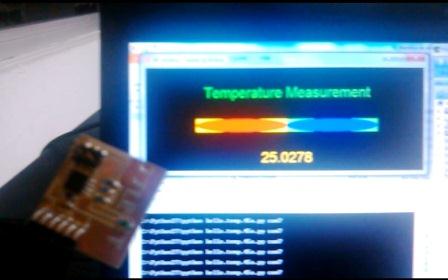
from Tkinter import *
from numpy import log
import serial

WINDOW = 600 # window size
eps = 0.5 # filter time constant
filter = 0.0 # filtered value

def idle(parent,canvas):
   global filter, eps
   #
   # idle routine
   #
   byte2 = 0
   byte3 = 0
   byte4 = 0
   ser.flush()
   while 1:
      #
      # find framing
      #
      byte1 = byte2
      byte2 = byte3
      byte3 = byte4
      byte4 = ord(ser.read())
      if ((byte1 == 1) & (byte2 == 2) & (byte3 == 3) & (byte4 == 4)):
         break
   low = ord(ser.read())
   high = ord(ser.read())
   value = 256*high + low
   if (value > 511):
      value -= 1024
   V = 2.5 - value*5.0/(20.0*512.0)
   R = 10000.0/(5.0/V-1.0)
   B = 3750.0
   R25 =  10000.0
   T = 1.0/(log(R/R25)/B+(1/(25.0+273.15))) - 273.15

   filter =  (1-eps)*filter +eps*T
   x = int(.2*WINDOW + (.9-.2)*WINDOW*(filter-20.0)/10.0)
   canvas.itemconfigure("text",text="%.4f"%(filter))
   canvas.coords('rect1',.2*WINDOW,.25*WINDOW,x,.2*WINDOW)
   canvas.coords('rect2',x,.25*WINDOW,0.9*WINDOW,.2*WINDOW)
   canvas.coords('radio1',.2*WINDOW,.25*WINDOW,1*x,.2*WINDOW)
   canvas.coords('radio2',1*x,.25*WINDOW,0.9*WINDOW,.2*WINDOW)
   canvas.coords('pos',1*x,.35*WINDOW)
   canvas.update()
   parent.after_idle(idle,parent,canvas)

#
#  check command line arguments
#
if (len(sys.argv) != 2):
   print ("command line: hello.temp.45.py serial_port")
   sys.exit()
port = sys.argv[1]
#
# open serial port
#
ser = serial.Serial(port,9600)
ser.setDTR()
#
# start plotting
#
root = Tk()
root.title('Mi ventana J Lazarte (q to exit)')
root.bind('q','exit')
canvas = Canvas(root, width=WINDOW+50, height=.4*WINDOW, background='black')
canvas.create_text(.4*WINDOW,.35*WINDOW,text='Temperature',font=("Helvetica", 24),tags=("pos","text"),fill="yellow")
canvas.create_text(.55*WINDOW,.1*WINDOW,text='Temperature Measurement',font=("Helvetica", 24),fill="green")
canvas.create_rectangle(.2*WINDOW,.25*WINDOW,.4*WINDOW,.4*WINDOW, tags='rect1', fill='yellow')
canvas.create_rectangle(.3*WINDOW,.05*WINDOW,.9*WINDOW,.2*WINDOW, tags='rect2', fill='green')
canvas.create_oval(0,150,150,300,tags='radio1', fill="red")
canvas.create_oval(0,150,150,300,tags='radio2', fill="blue")
canvas.pack()
root.after(100,idle,root,canvas)
root.mainloop()
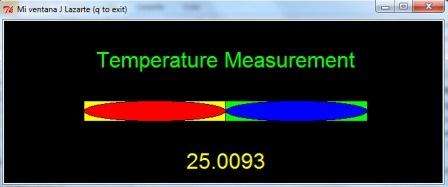


Application Window
To run application you must have connected the card temperature measurement, identify the COM port to which it is connected, after that I invoked the application program in Python.
The procedure and performance verification is presented in the following video.


References:
http://sebsauvage.net/python/gui/
http://programarcadegames.com/index.php?chapter=introduction_to_graphics
https://docs.python.org/2/library/turtle.html
https://wiki.python.org/moin/TkInter
http://effbot.org/tkinterbook/
https://docs.python.org/3/library/tkinter.html
https://docs.python.org/2/faq/gui.html
https://docs.python.org/2/library/tk.html
https://docs.python.org/3.1/library/tk.html
http://zetcode.com/gui/tkinter/