SUMMARY
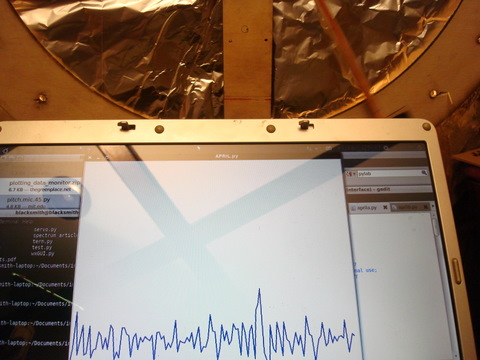
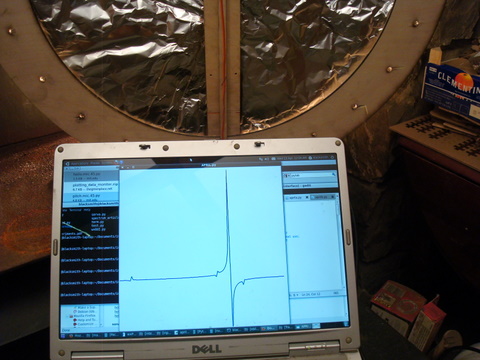
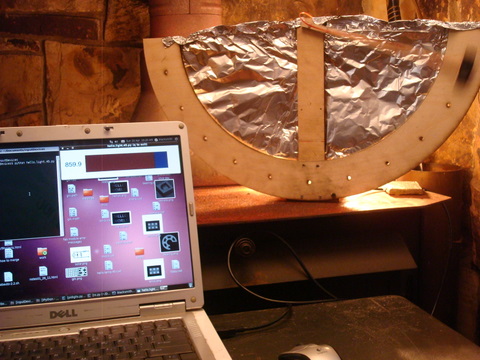
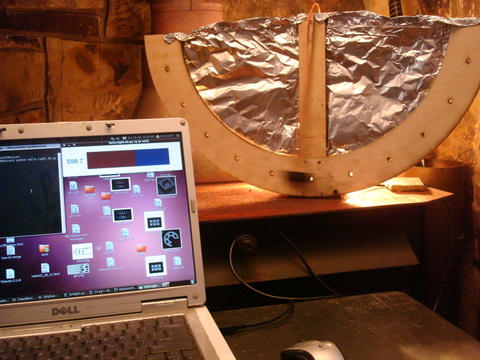
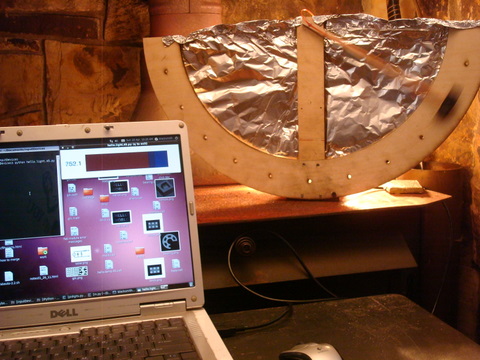
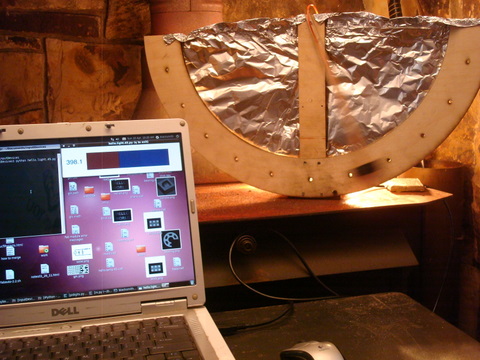
The first set of 4 pictures shows the output to the screen from the light sensor using hello.light.45.py, as provided in the input devices class notes. A heat lamp provided the source radiation to which the infrared detector responded. This was followed up by modifying the 2007 hello.mic.45.py file downloaded from the Internet. Although a response of some kind is evident in the last 2 pictures above, they do not seem capture the story I hoped to tell.
DISCUSSION
The pendulum assembly consists of a semi circle with a radius of approximately 11 inches, with 1/4" holes at 15 degree phasing. What I hoped to show was that the period from opposing point to point in the swing of the pendulum takes the same amount of time, and is independent of the amplitude. I hope to be able to demonstrate that graphically with sensor measurements output in matplotlib, once I get more familiar with that programming environment.
Neither the mass of the pendulum or the amplitude of its swing change the period of the swing in the ideal case. Local variations in gravity can produce a measureable effect, as will varying the length. Interestingly, a pendulum with a 2 second period is approximately 1 meter long, although variations in the local gravity field will give measureable variation in that length (which Newton termed a "Paris" foot, as opposed to a length in other parts of the world).