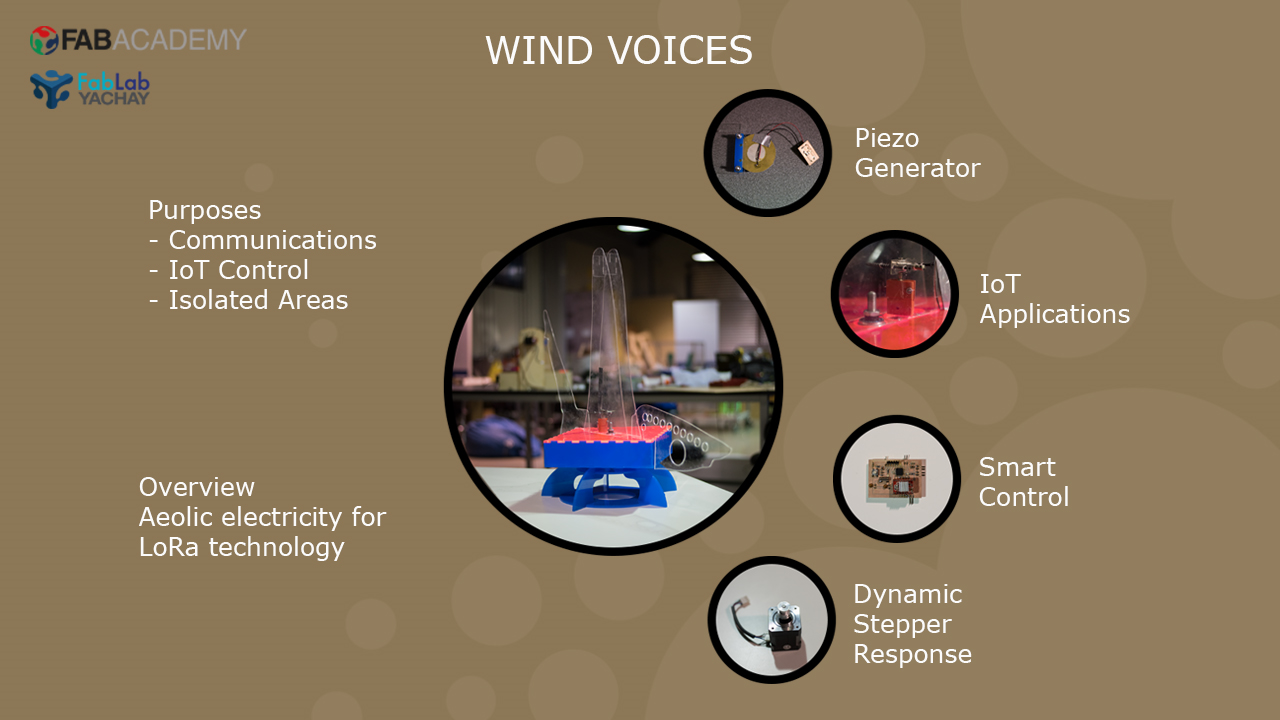
Final project. Harmonic Wind Harvester.
Index
- Introduction
- Problem and proposal
- Experimental research
- System description
- Materials, construction and design
- 2D/3D design and acrylic cutting
- Communications
- Microphone test
- Field system design
- Input, output and control
- Software
- Summary
- Files
Introduction
Problem and proposal
Fossil fuels, beside the environmental problems they cause, are condemned to depletion. Each time is harder and costlier to extract those dirty fuels from the ground. We need to find other means for our energy requirements.
We have been burning fossil fuels for two hundred years. For nature, the accumulation of energy in the covalent bonds of it's chemical structure took thousands of millions of years.
Energy harvesting is an alternative to change the trend.
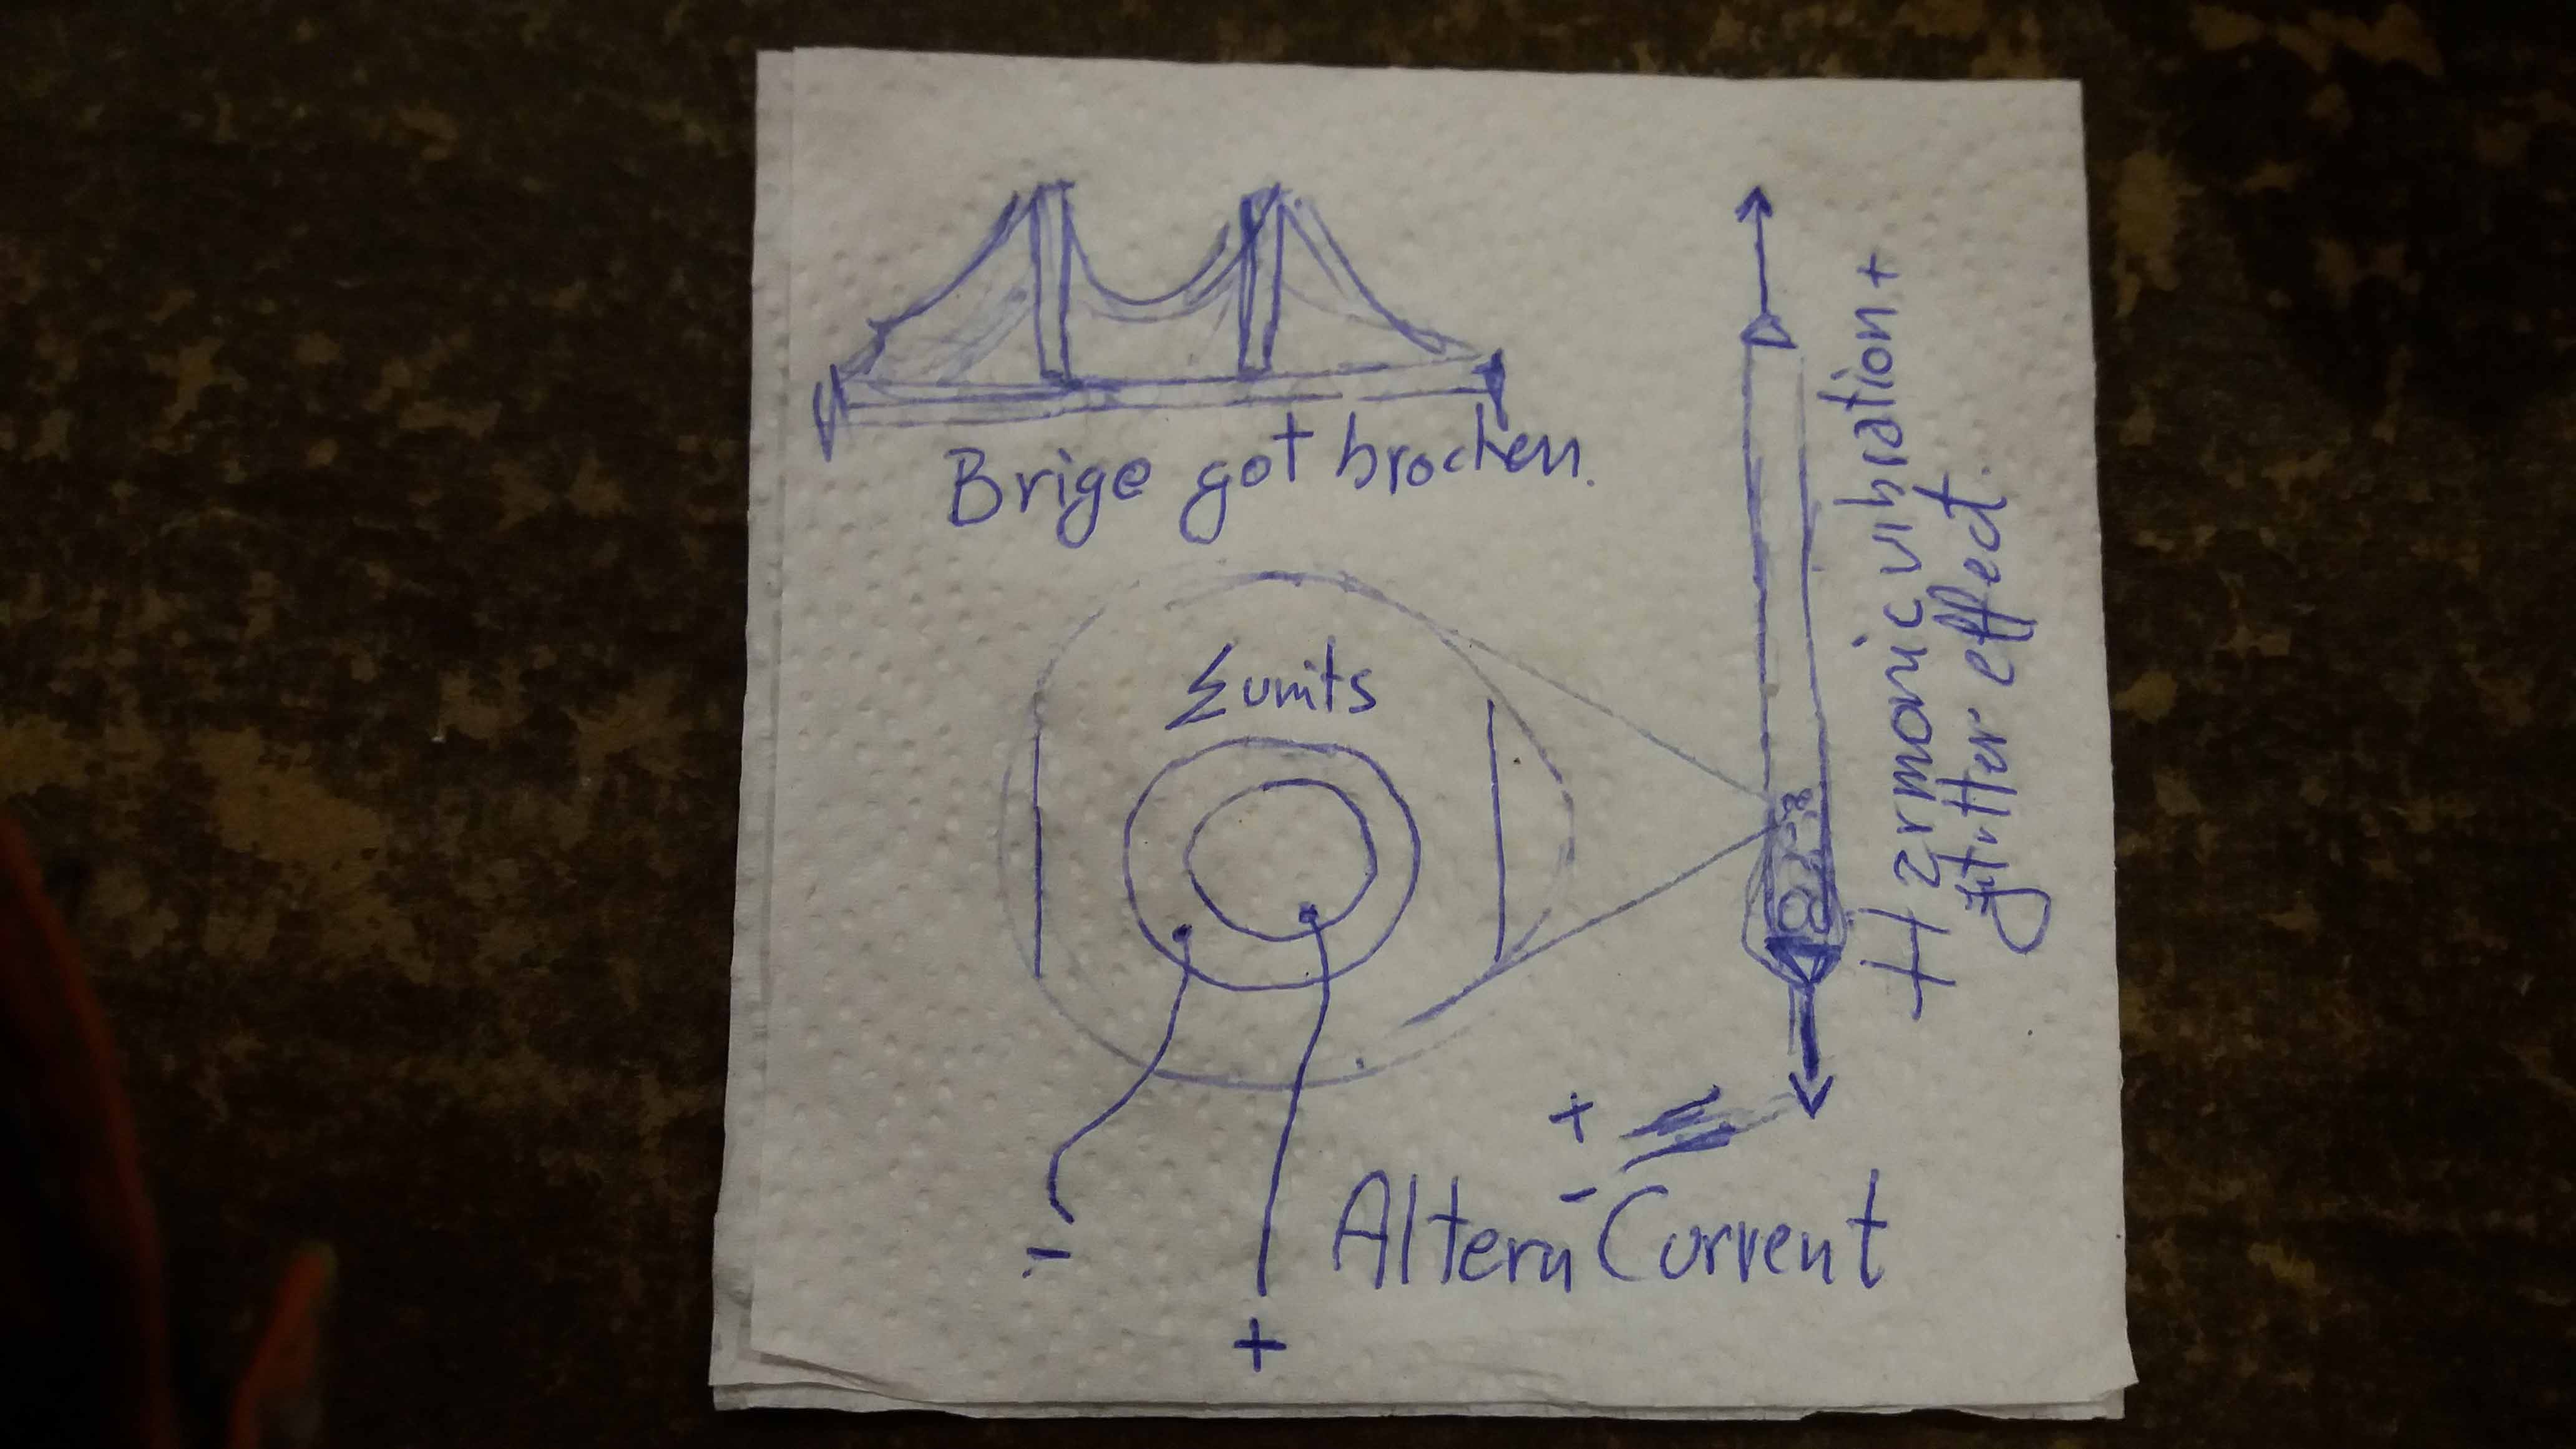
On November 7th, 1940, the Tacoma Narrows Bridge collapsed under a relative mild wind (40 mile-per-hour or 64 km/h).
The phenomena is still studied as an engineering example of harmonic motion and aeroelastic flutter effect.
The forces involved in this processes could be very destructive, and this have to be taken on account for infrastructure design, but also could be useful in the design of new forms of energy harvesting from moving fluids.
This sketch idea comes from a previous work of Shawn Fayne. He explored the harvesting of wind energy exploiting the aeroflutter effect.
In this system, the vibration of a membrane is used to induce an electric current in a coil through a movement of a magnet relative to a coil.
My proposal is a system that replaces the coil and magnet for a piezoelectric transducing system. The energy generated will be used to charge small appliances and communication devices.
The system is also thought to vary the tension of the membrane, and that way adapting dinamically to different wind speeds.
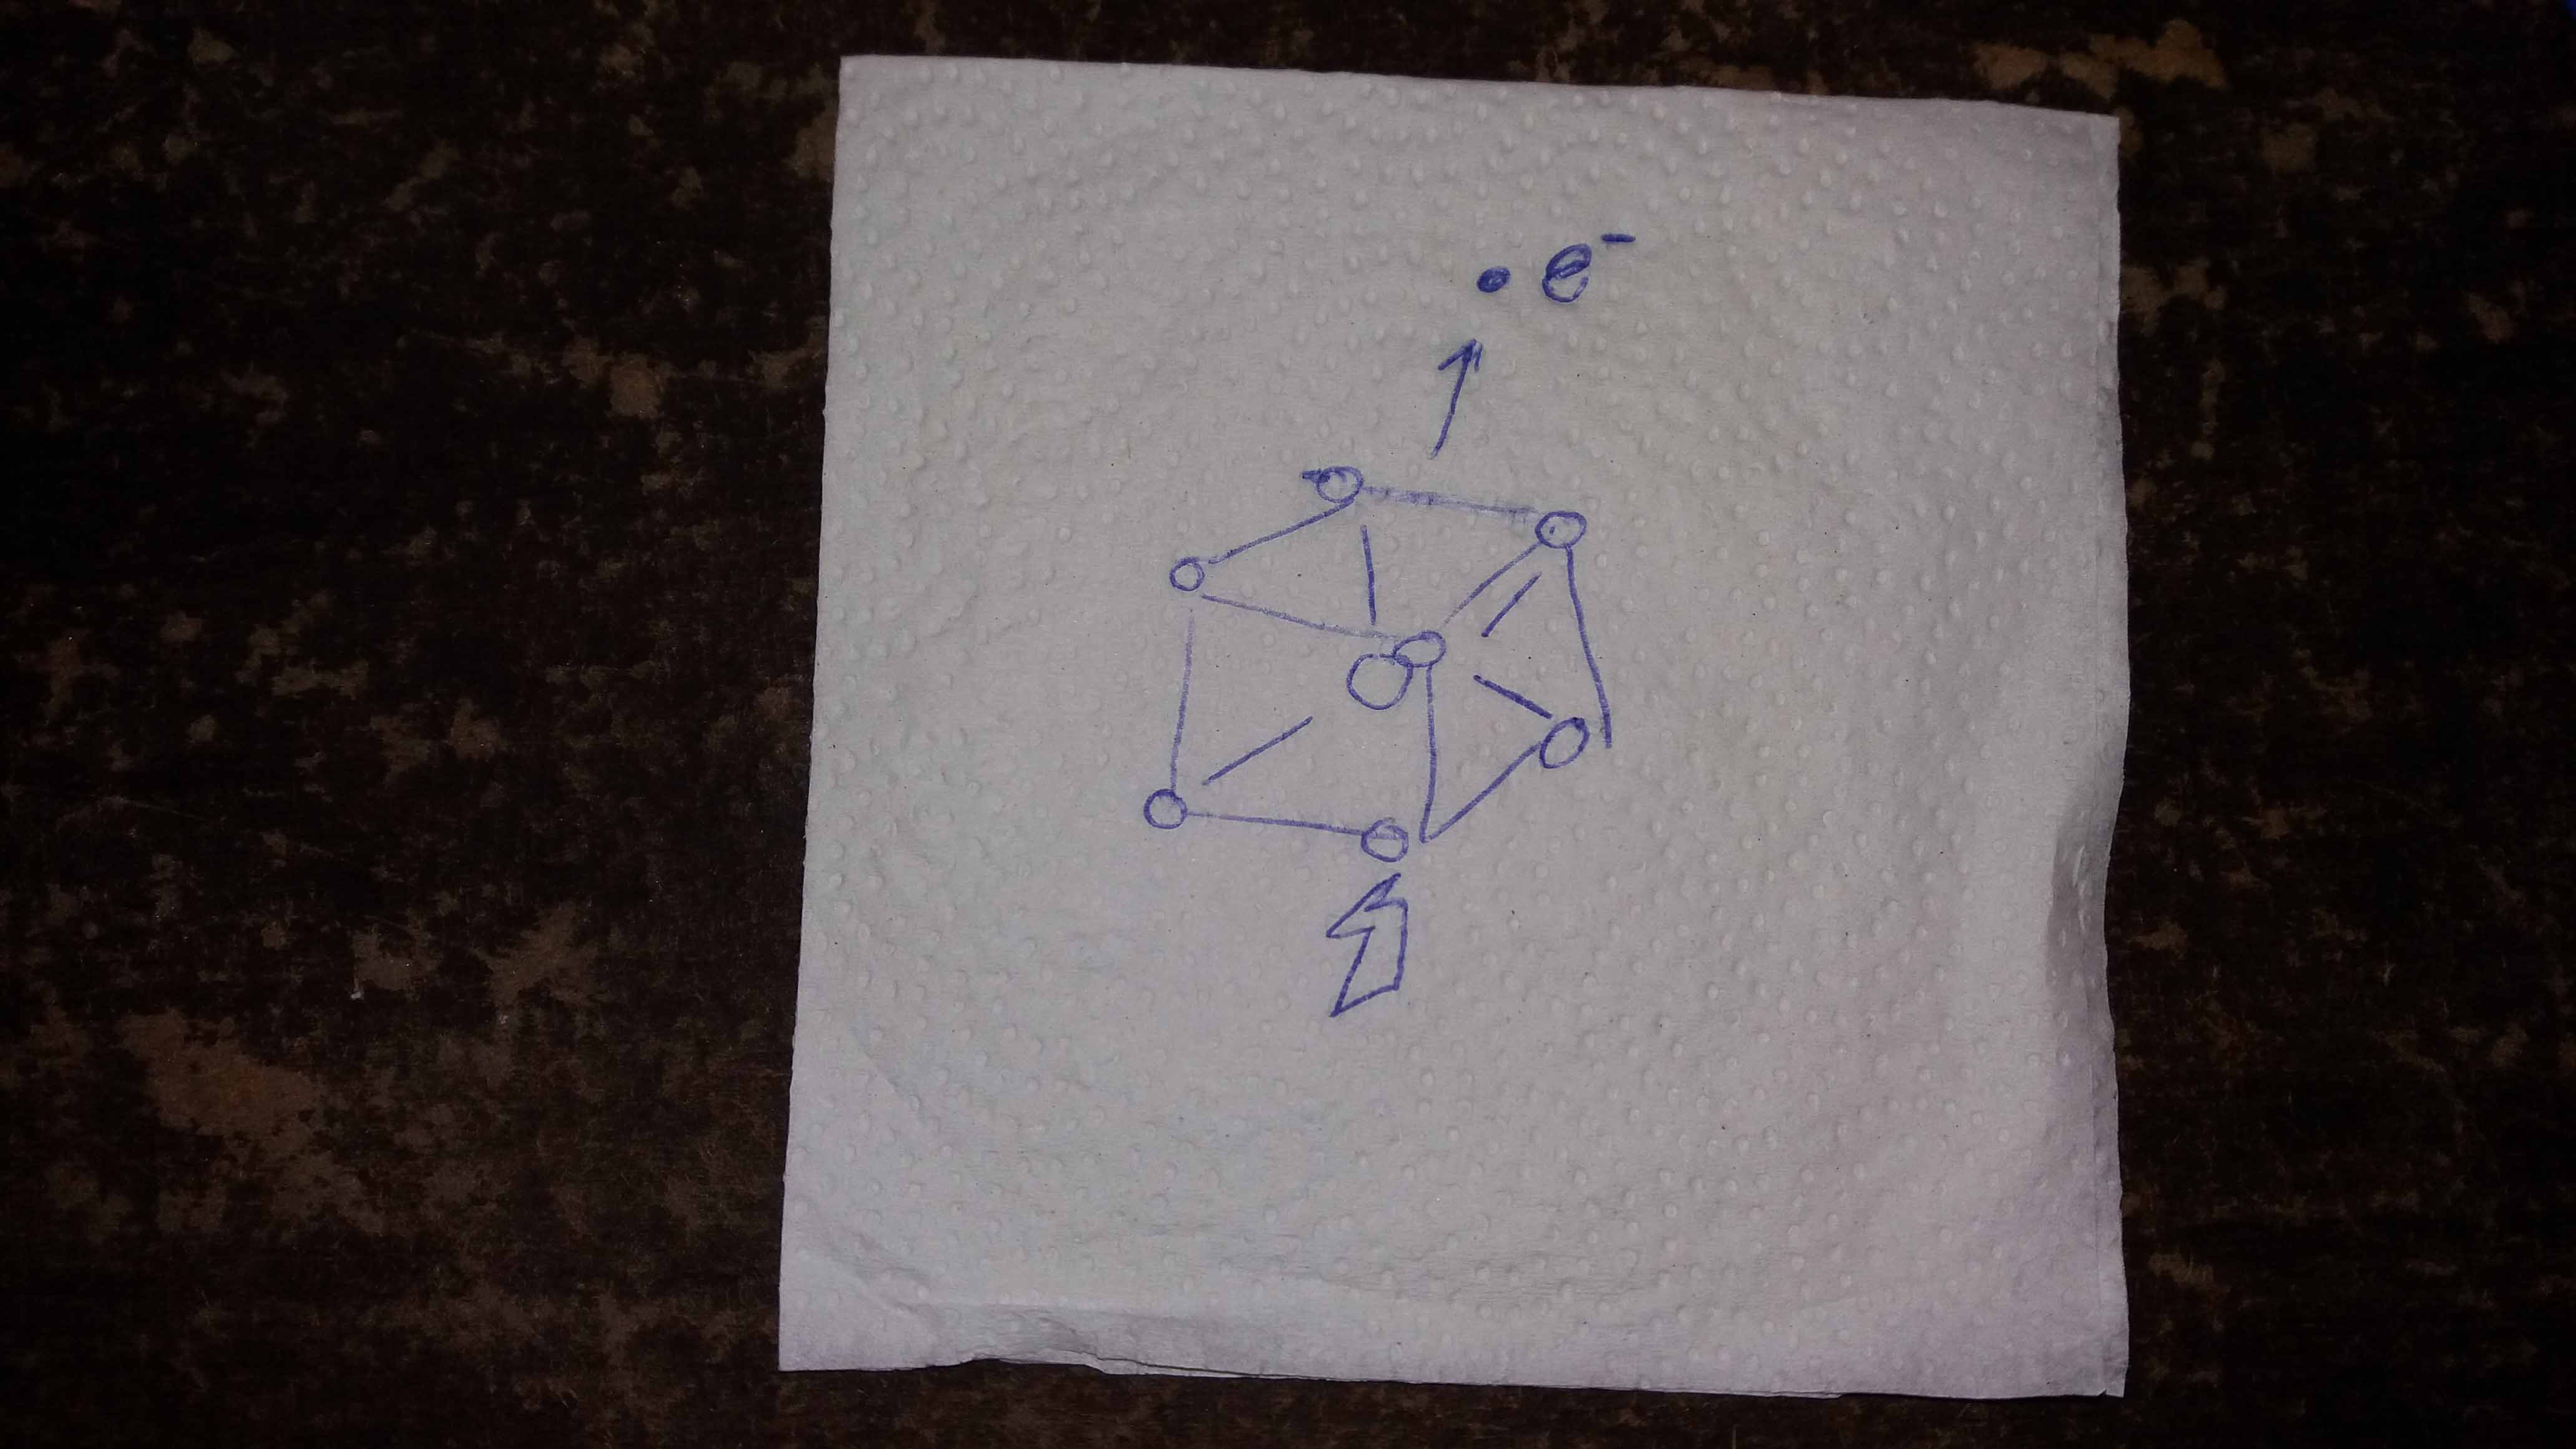
The crystal configuration of piezoelectric materials "kicks out" an electron when is subject to mechanical stress. These electrons are harvested, stored and used for electrical applications.
Here is a video of previous attempts of exploring this technology.
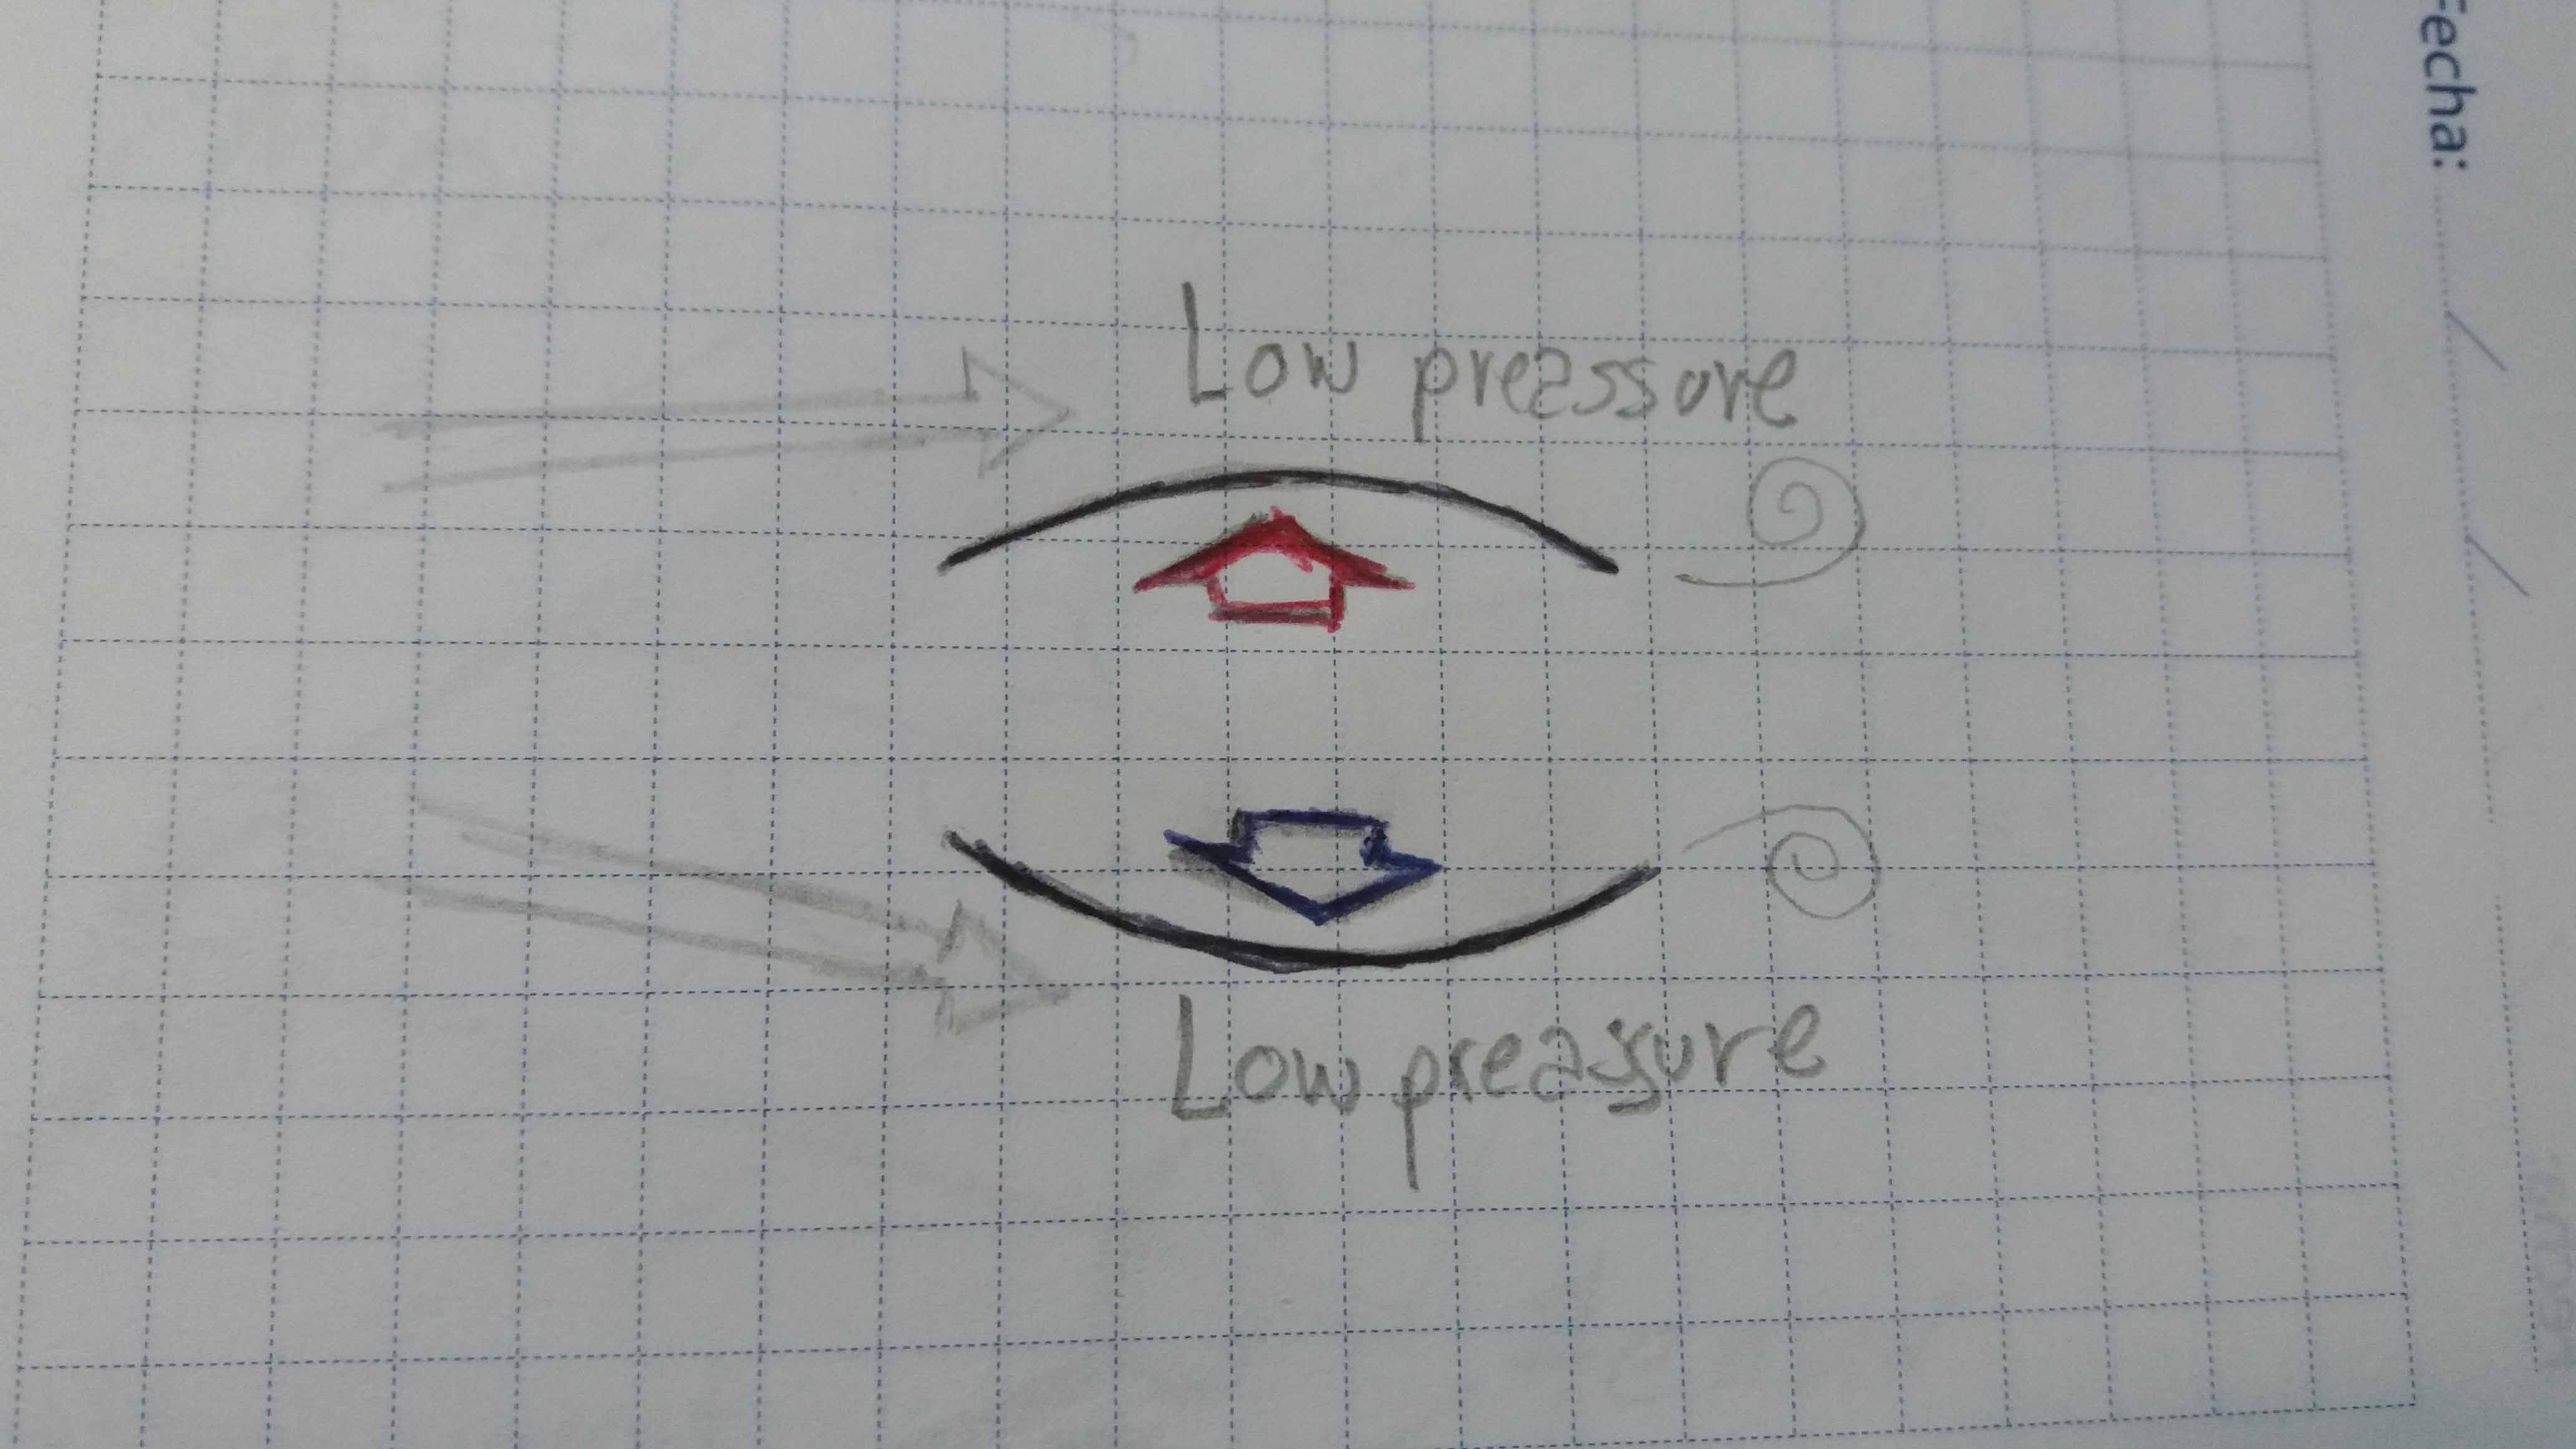
The wind creates alternativelly a high and low preassure in oposites sides of the membrane.
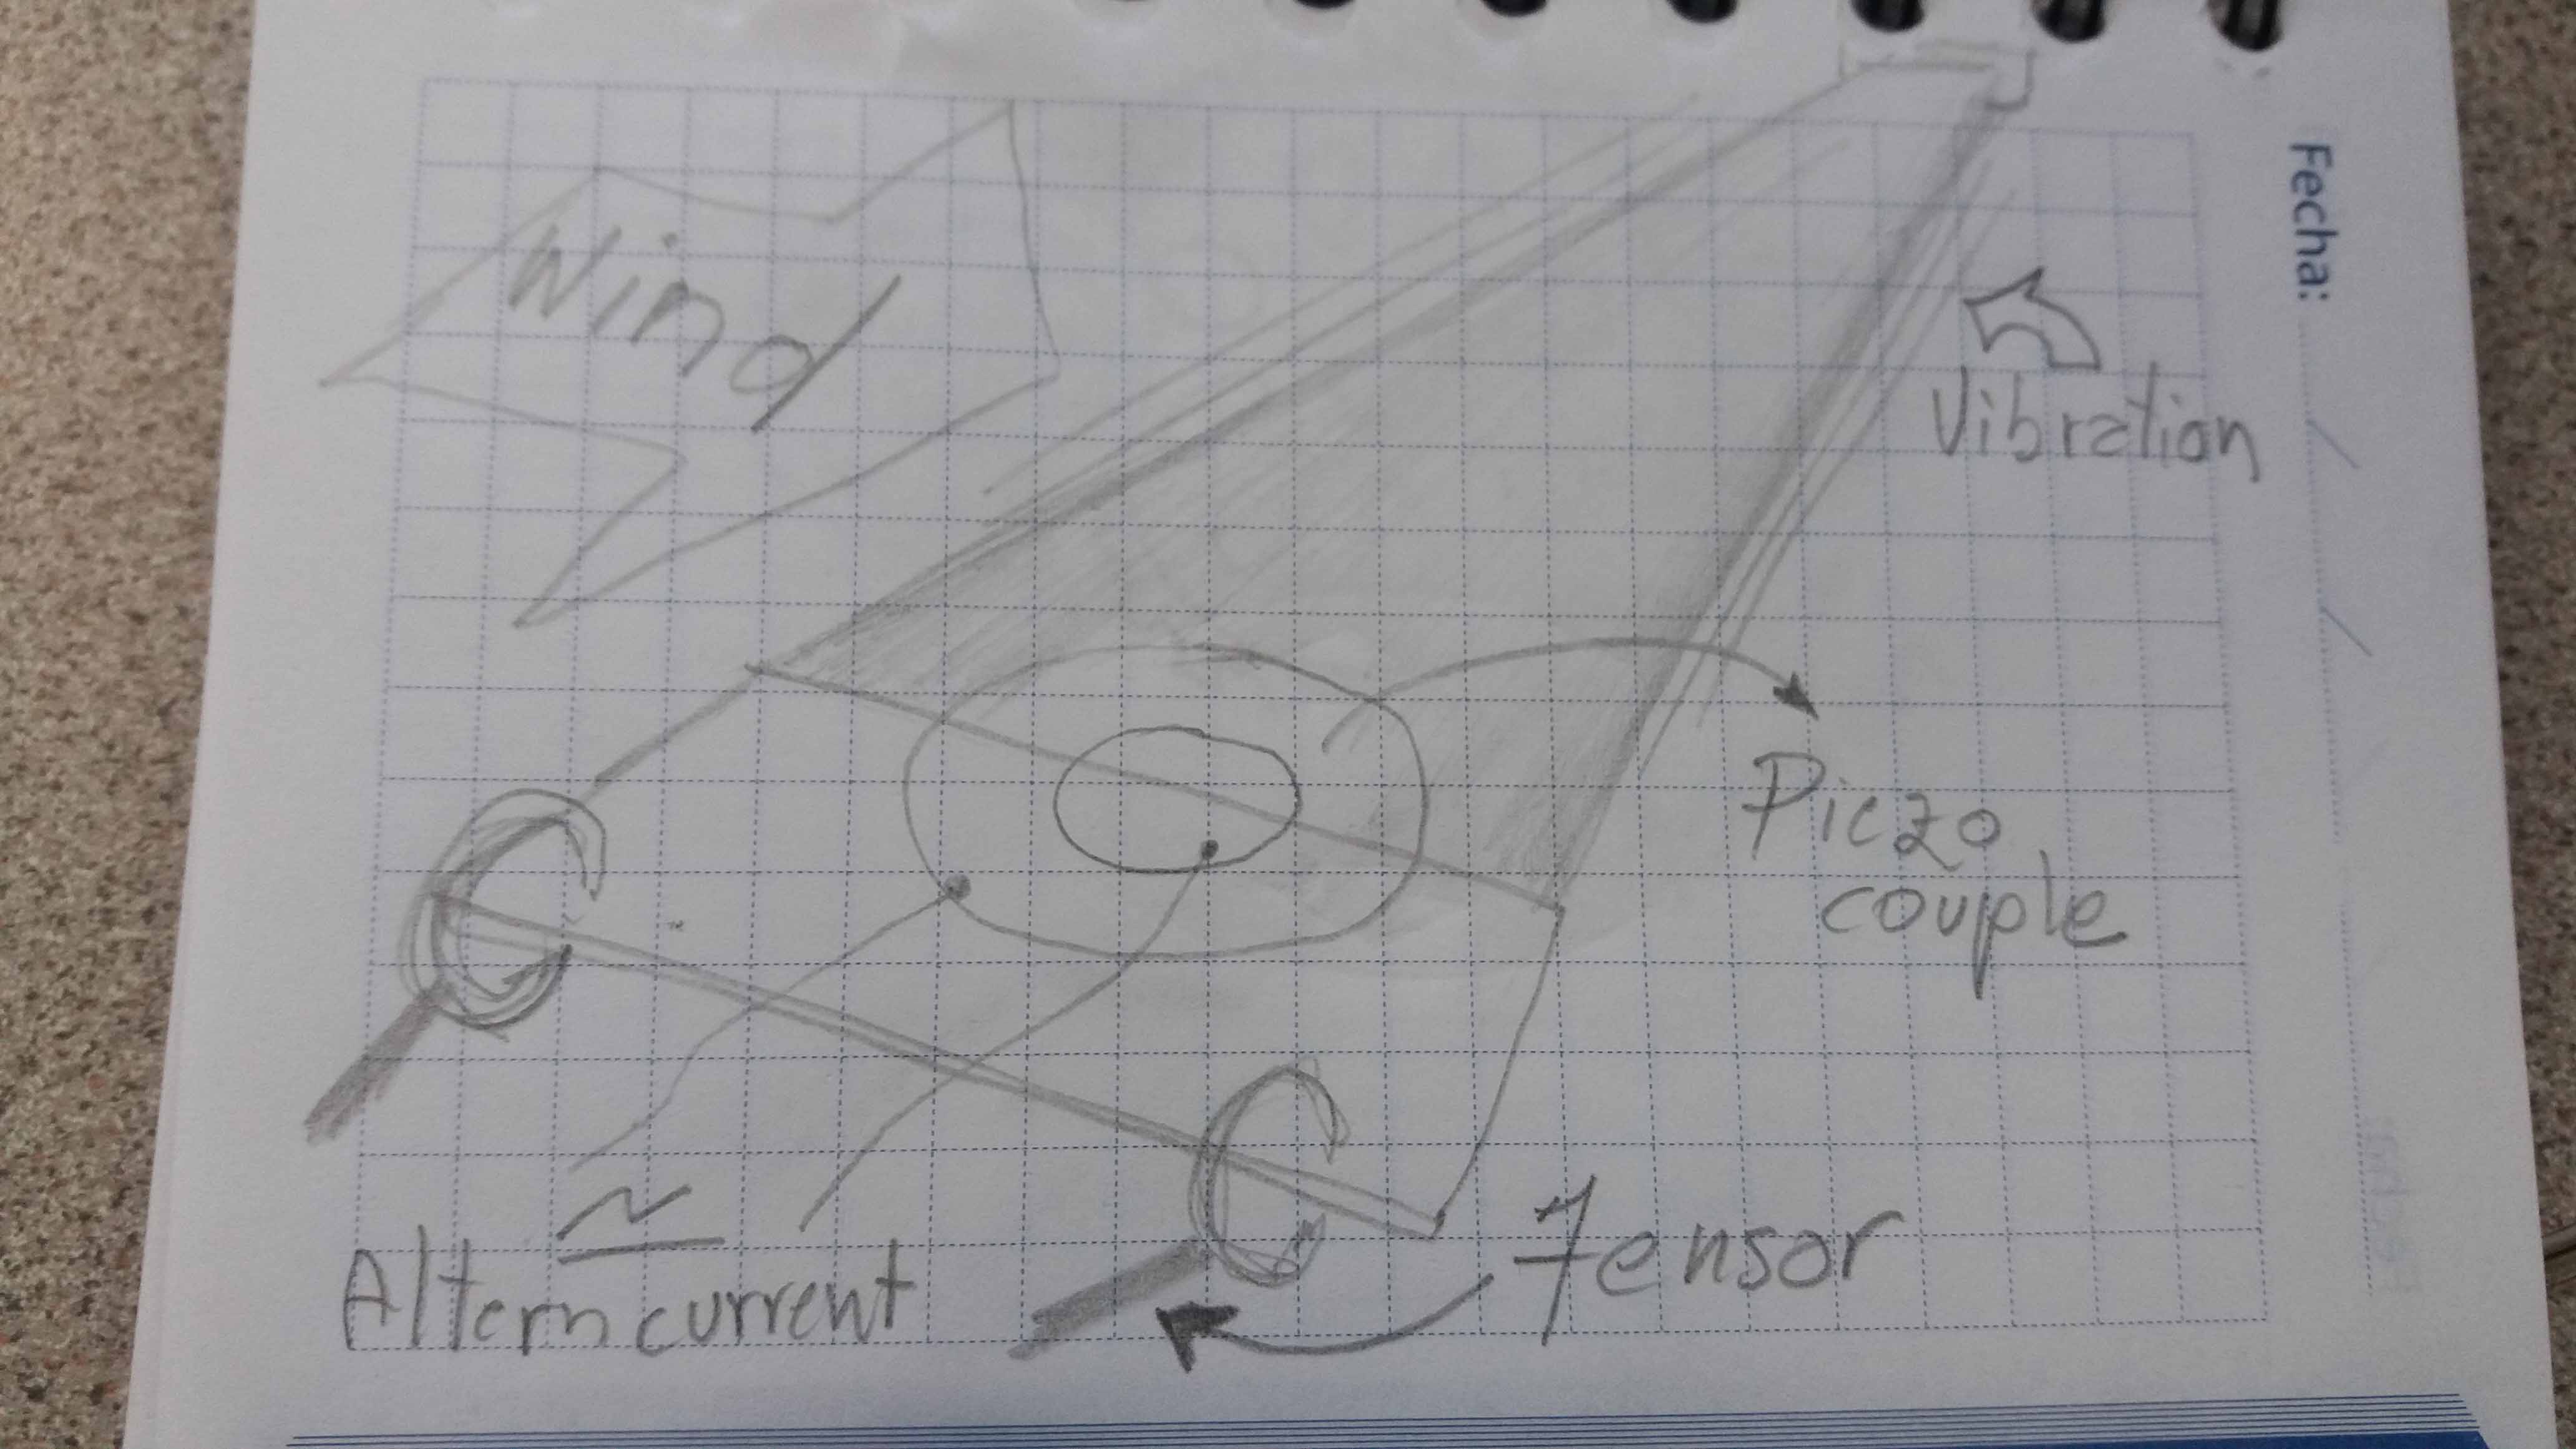
Energy is harvested using a piezo-electic couple. Alternate electricity is generated, what allow us to send it with relative low lost.
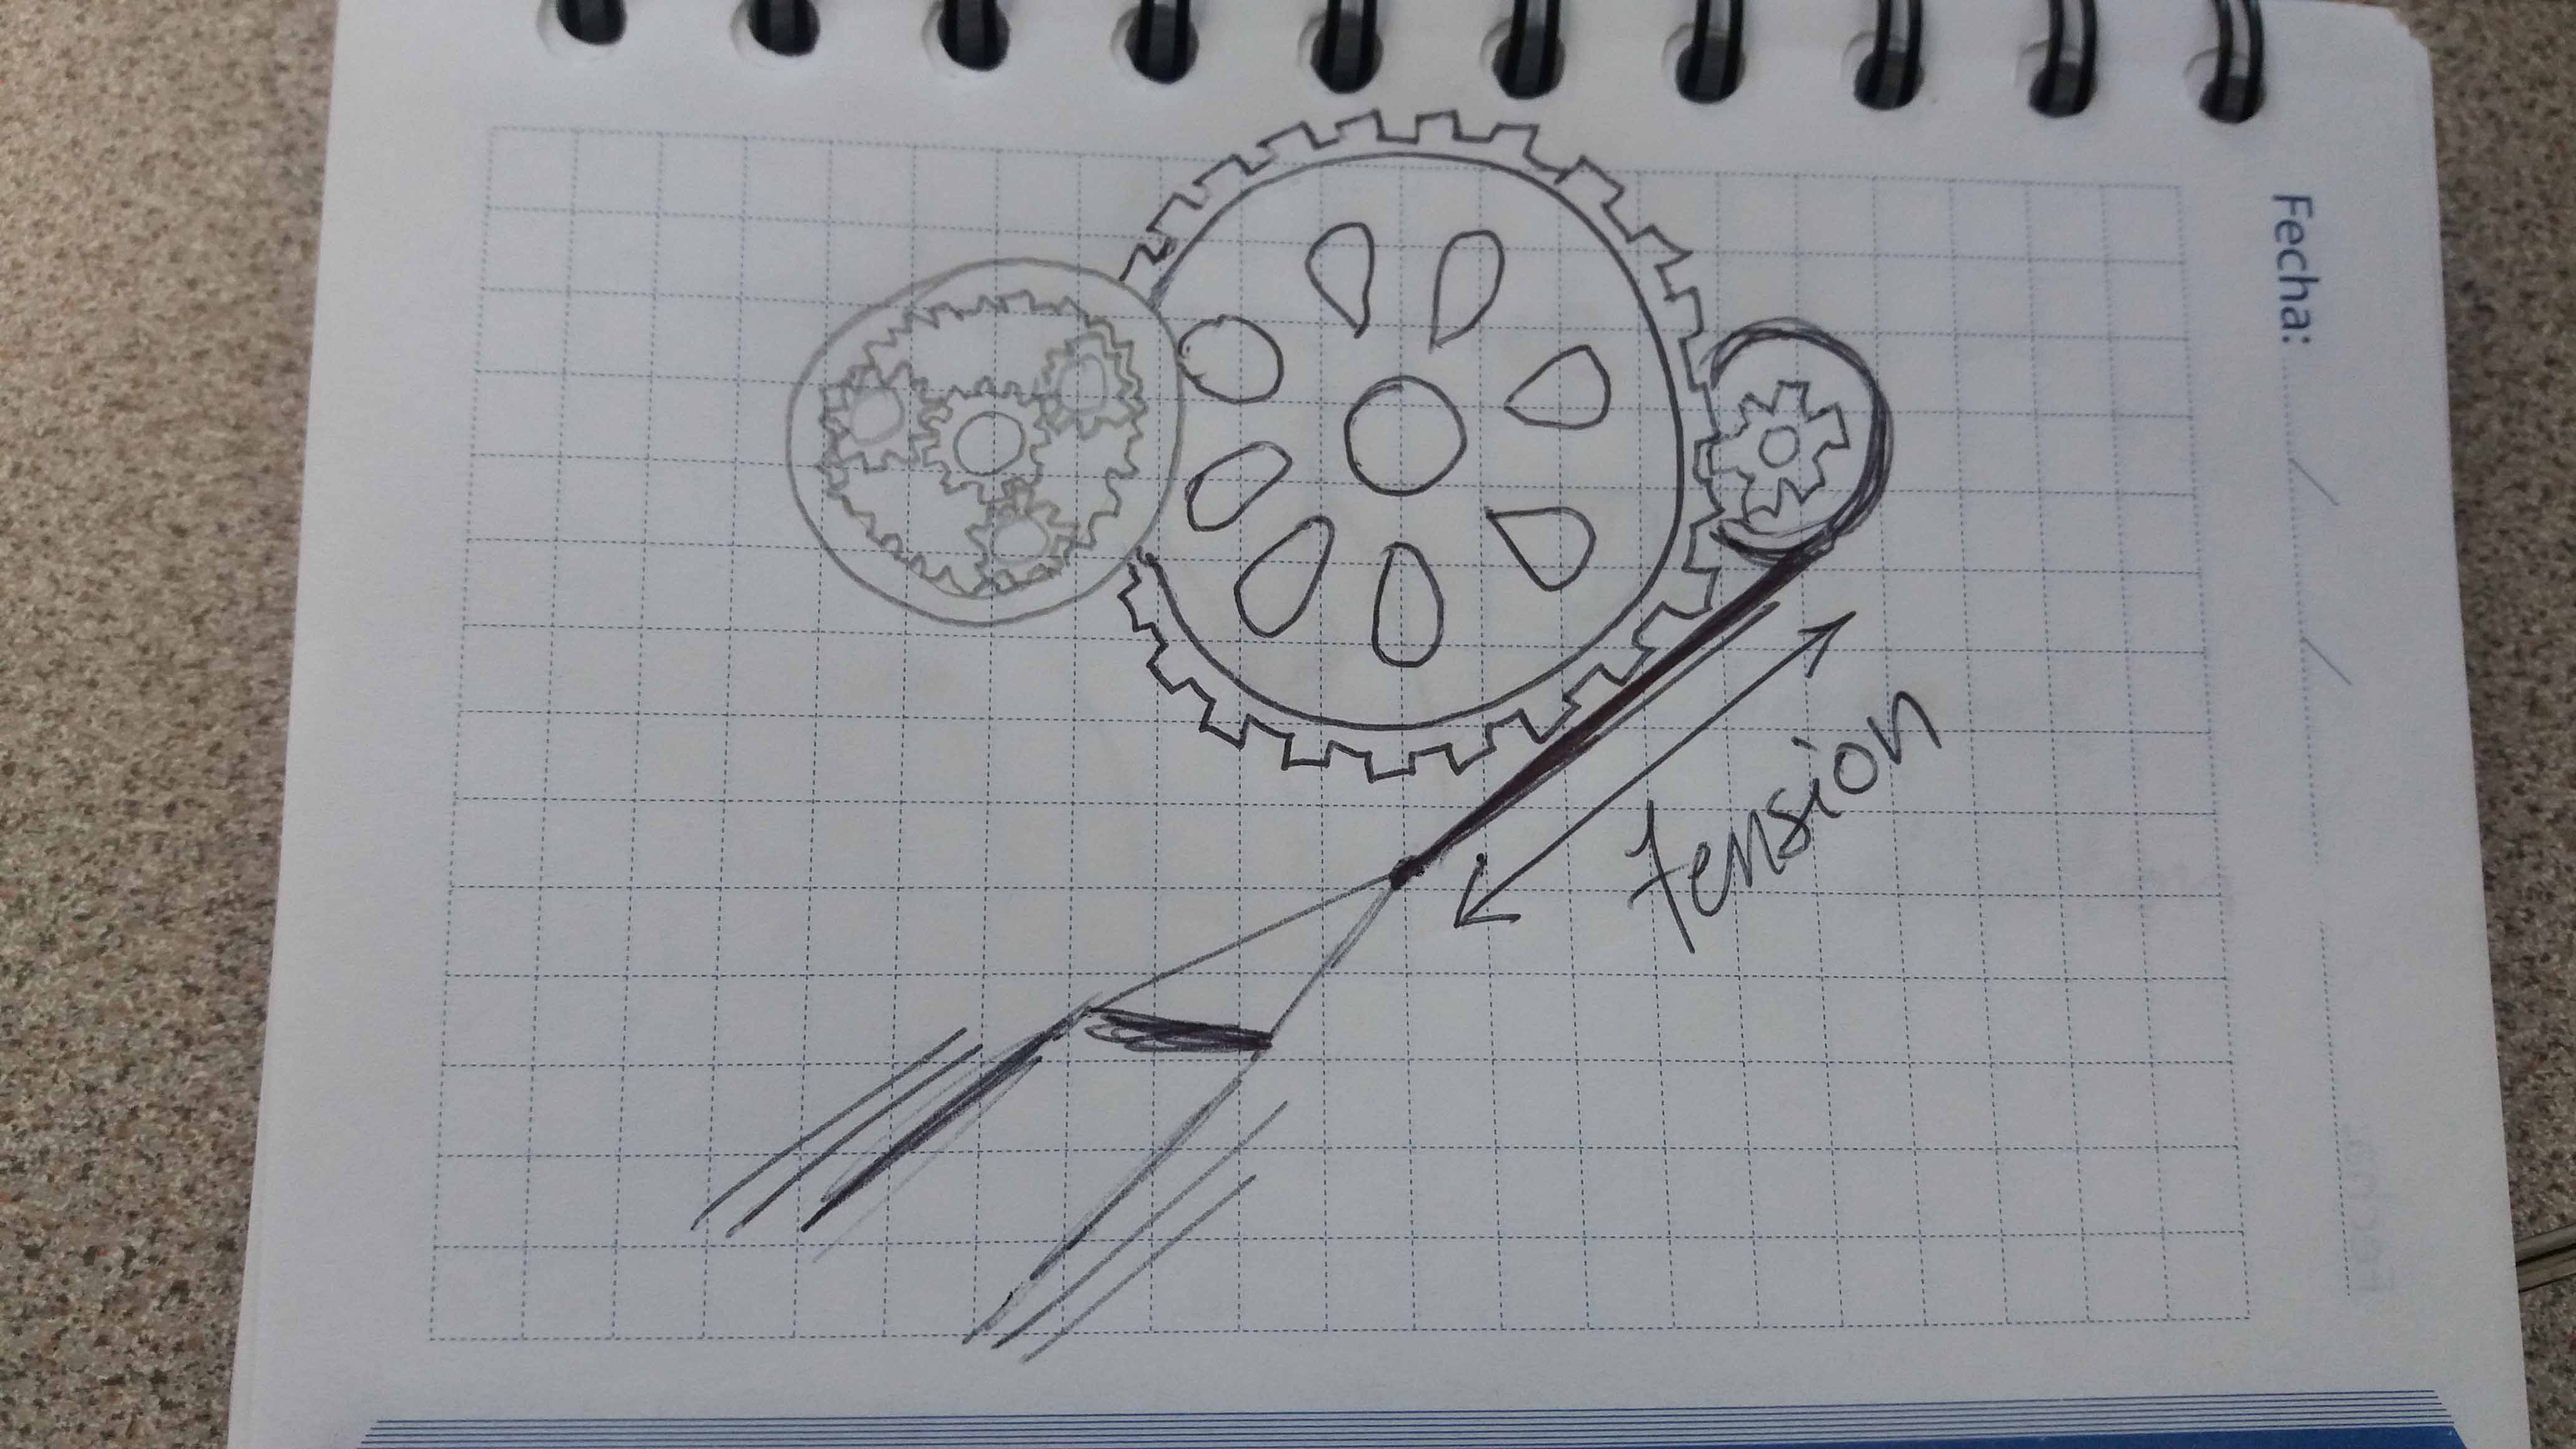
The tension of the system could be also controlled, maximizing the energy harvesting. This will be done using gears for mechanical advantage.
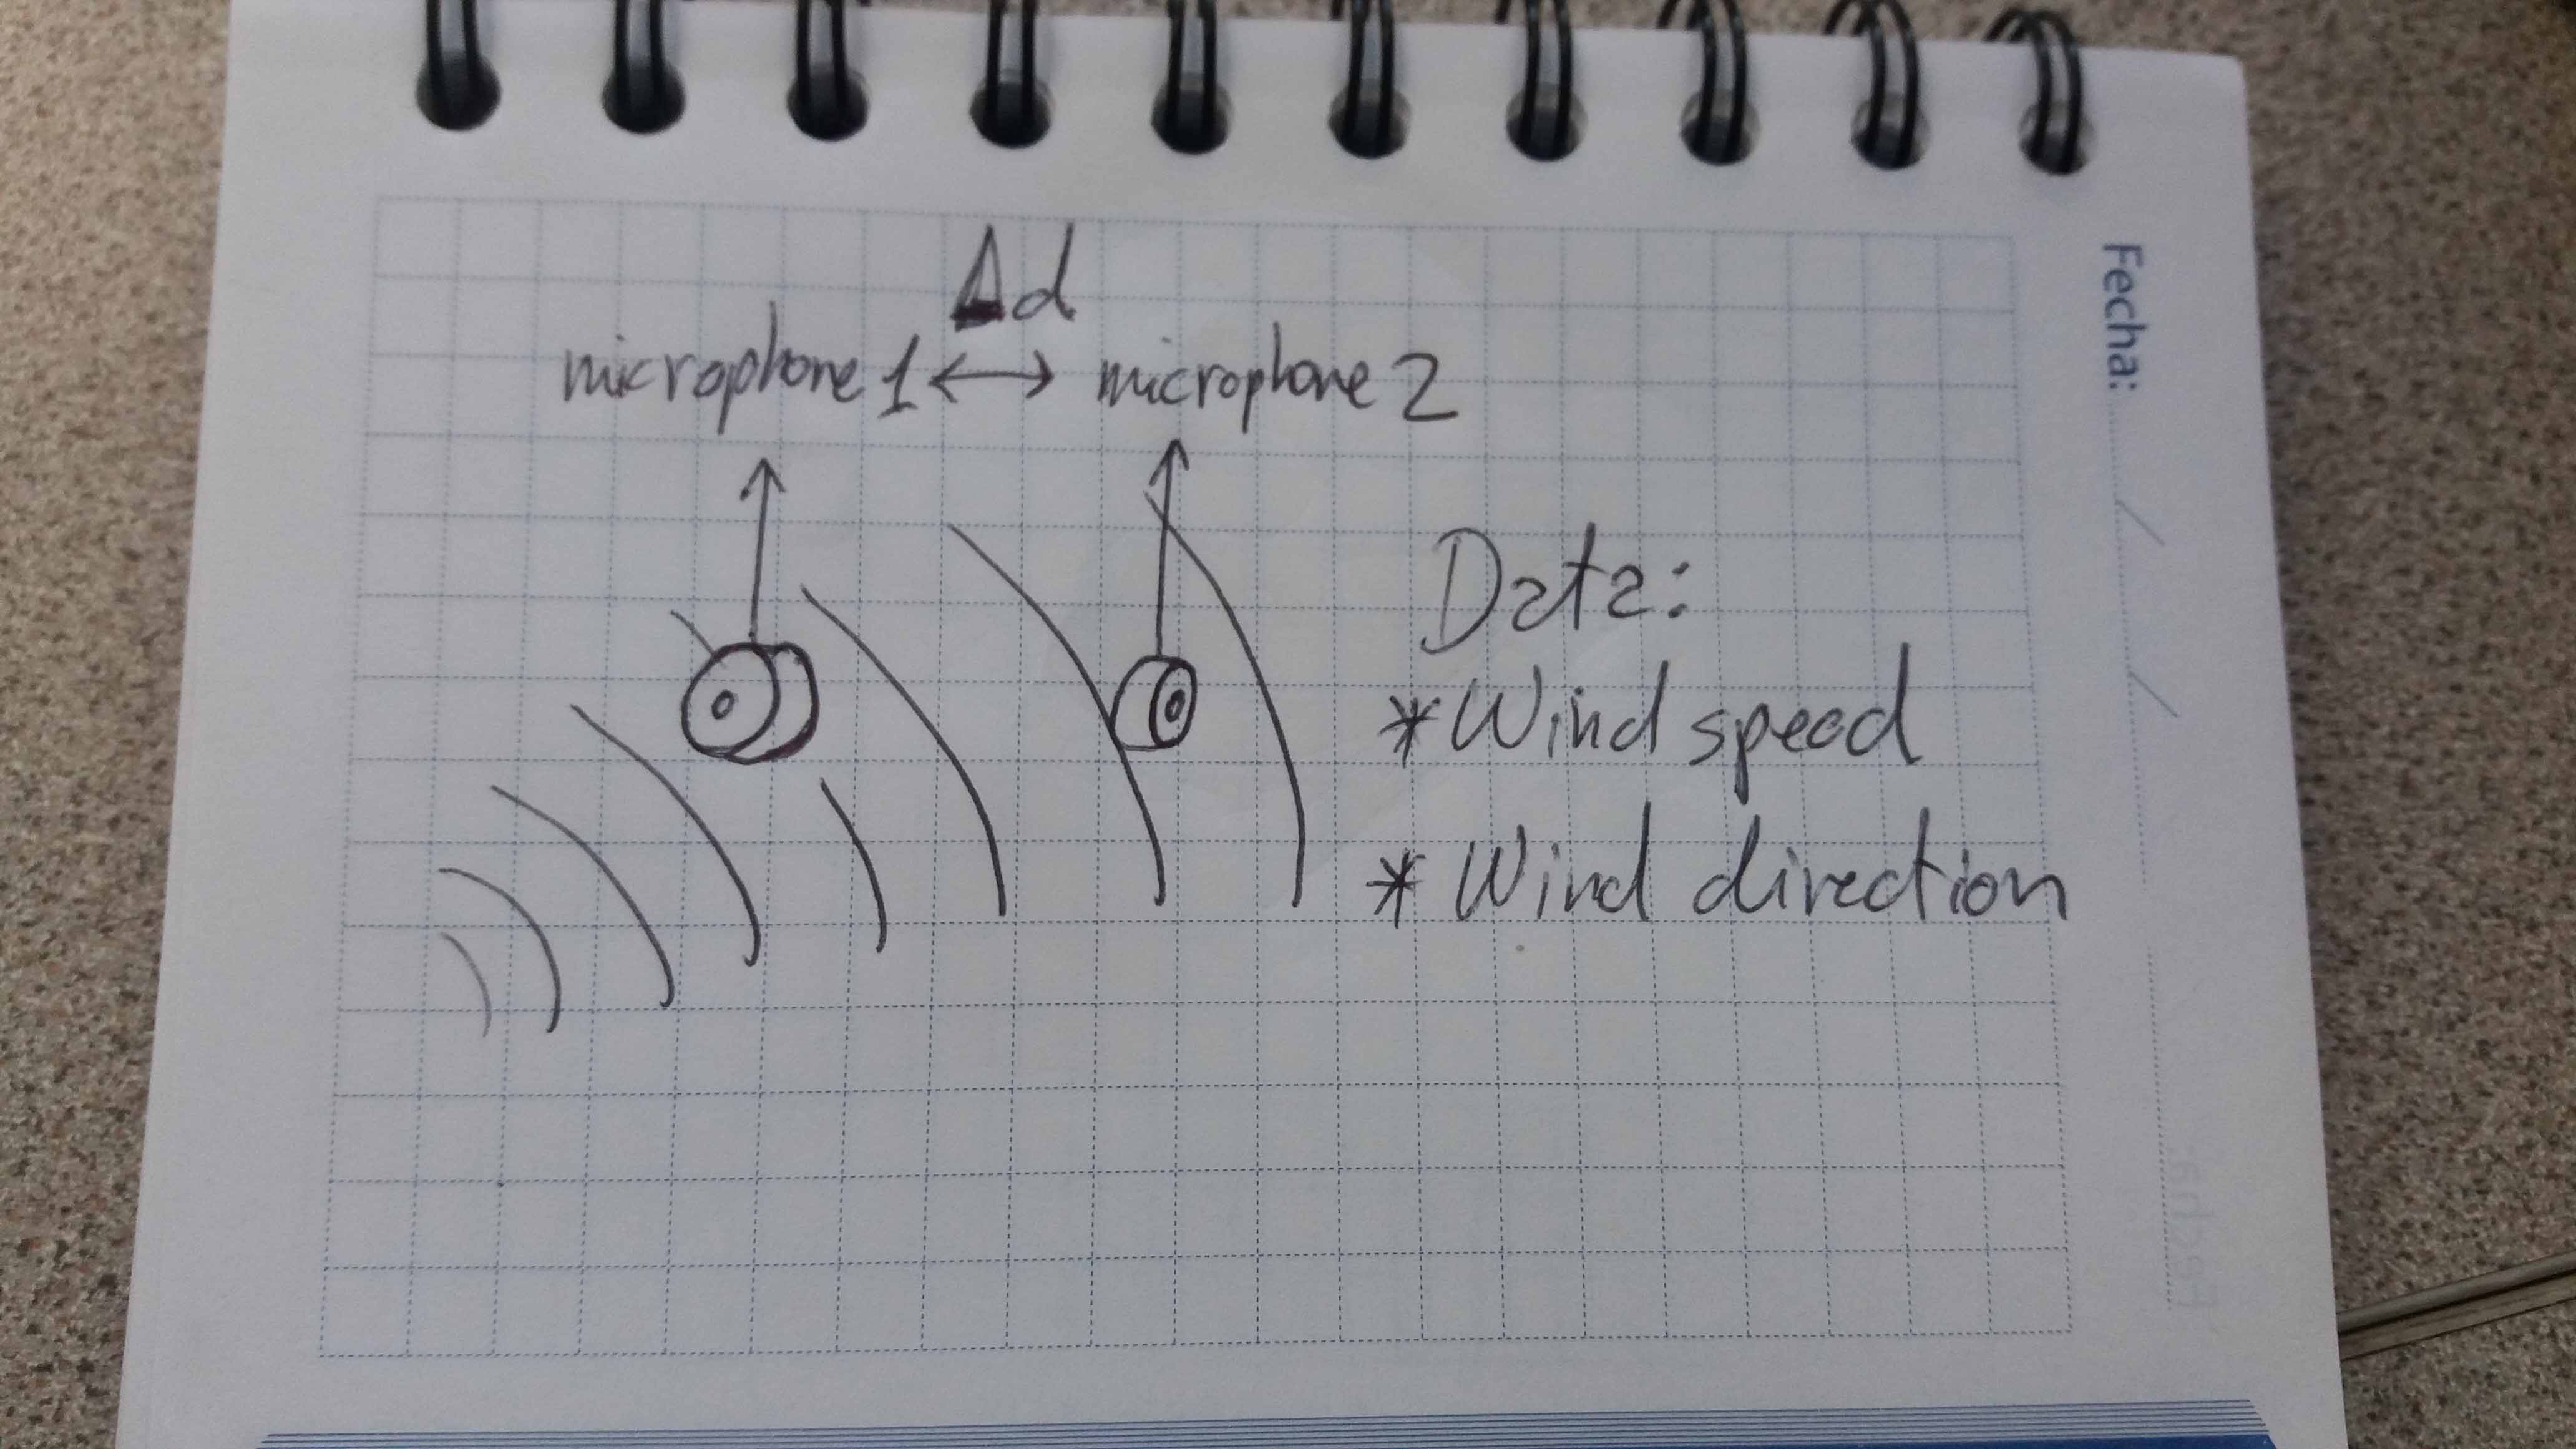
Microphones are going to be used for measure both the wind speed and direction. Two microphones will be used for direction, calculating the difference between the two values.
The objectives of the constructions where thougt to be a self-sustained communications spot. Originally it was imagined as a LoRa access point, but latter it was implemented as a WiFi IoT device. This desition was made because the number of LoRa nodes in my country are rare, and the implementation would become rather dificult. In any case, with the proof of concept provided by a WiFi communication could be extended to larger range applications, as LoRa.
Experimental research
For the development of this project, a simple setup was build. Here is a measurement of voltage generation using a relativelly short tape. The AC to DC conversion is not yet constructed.
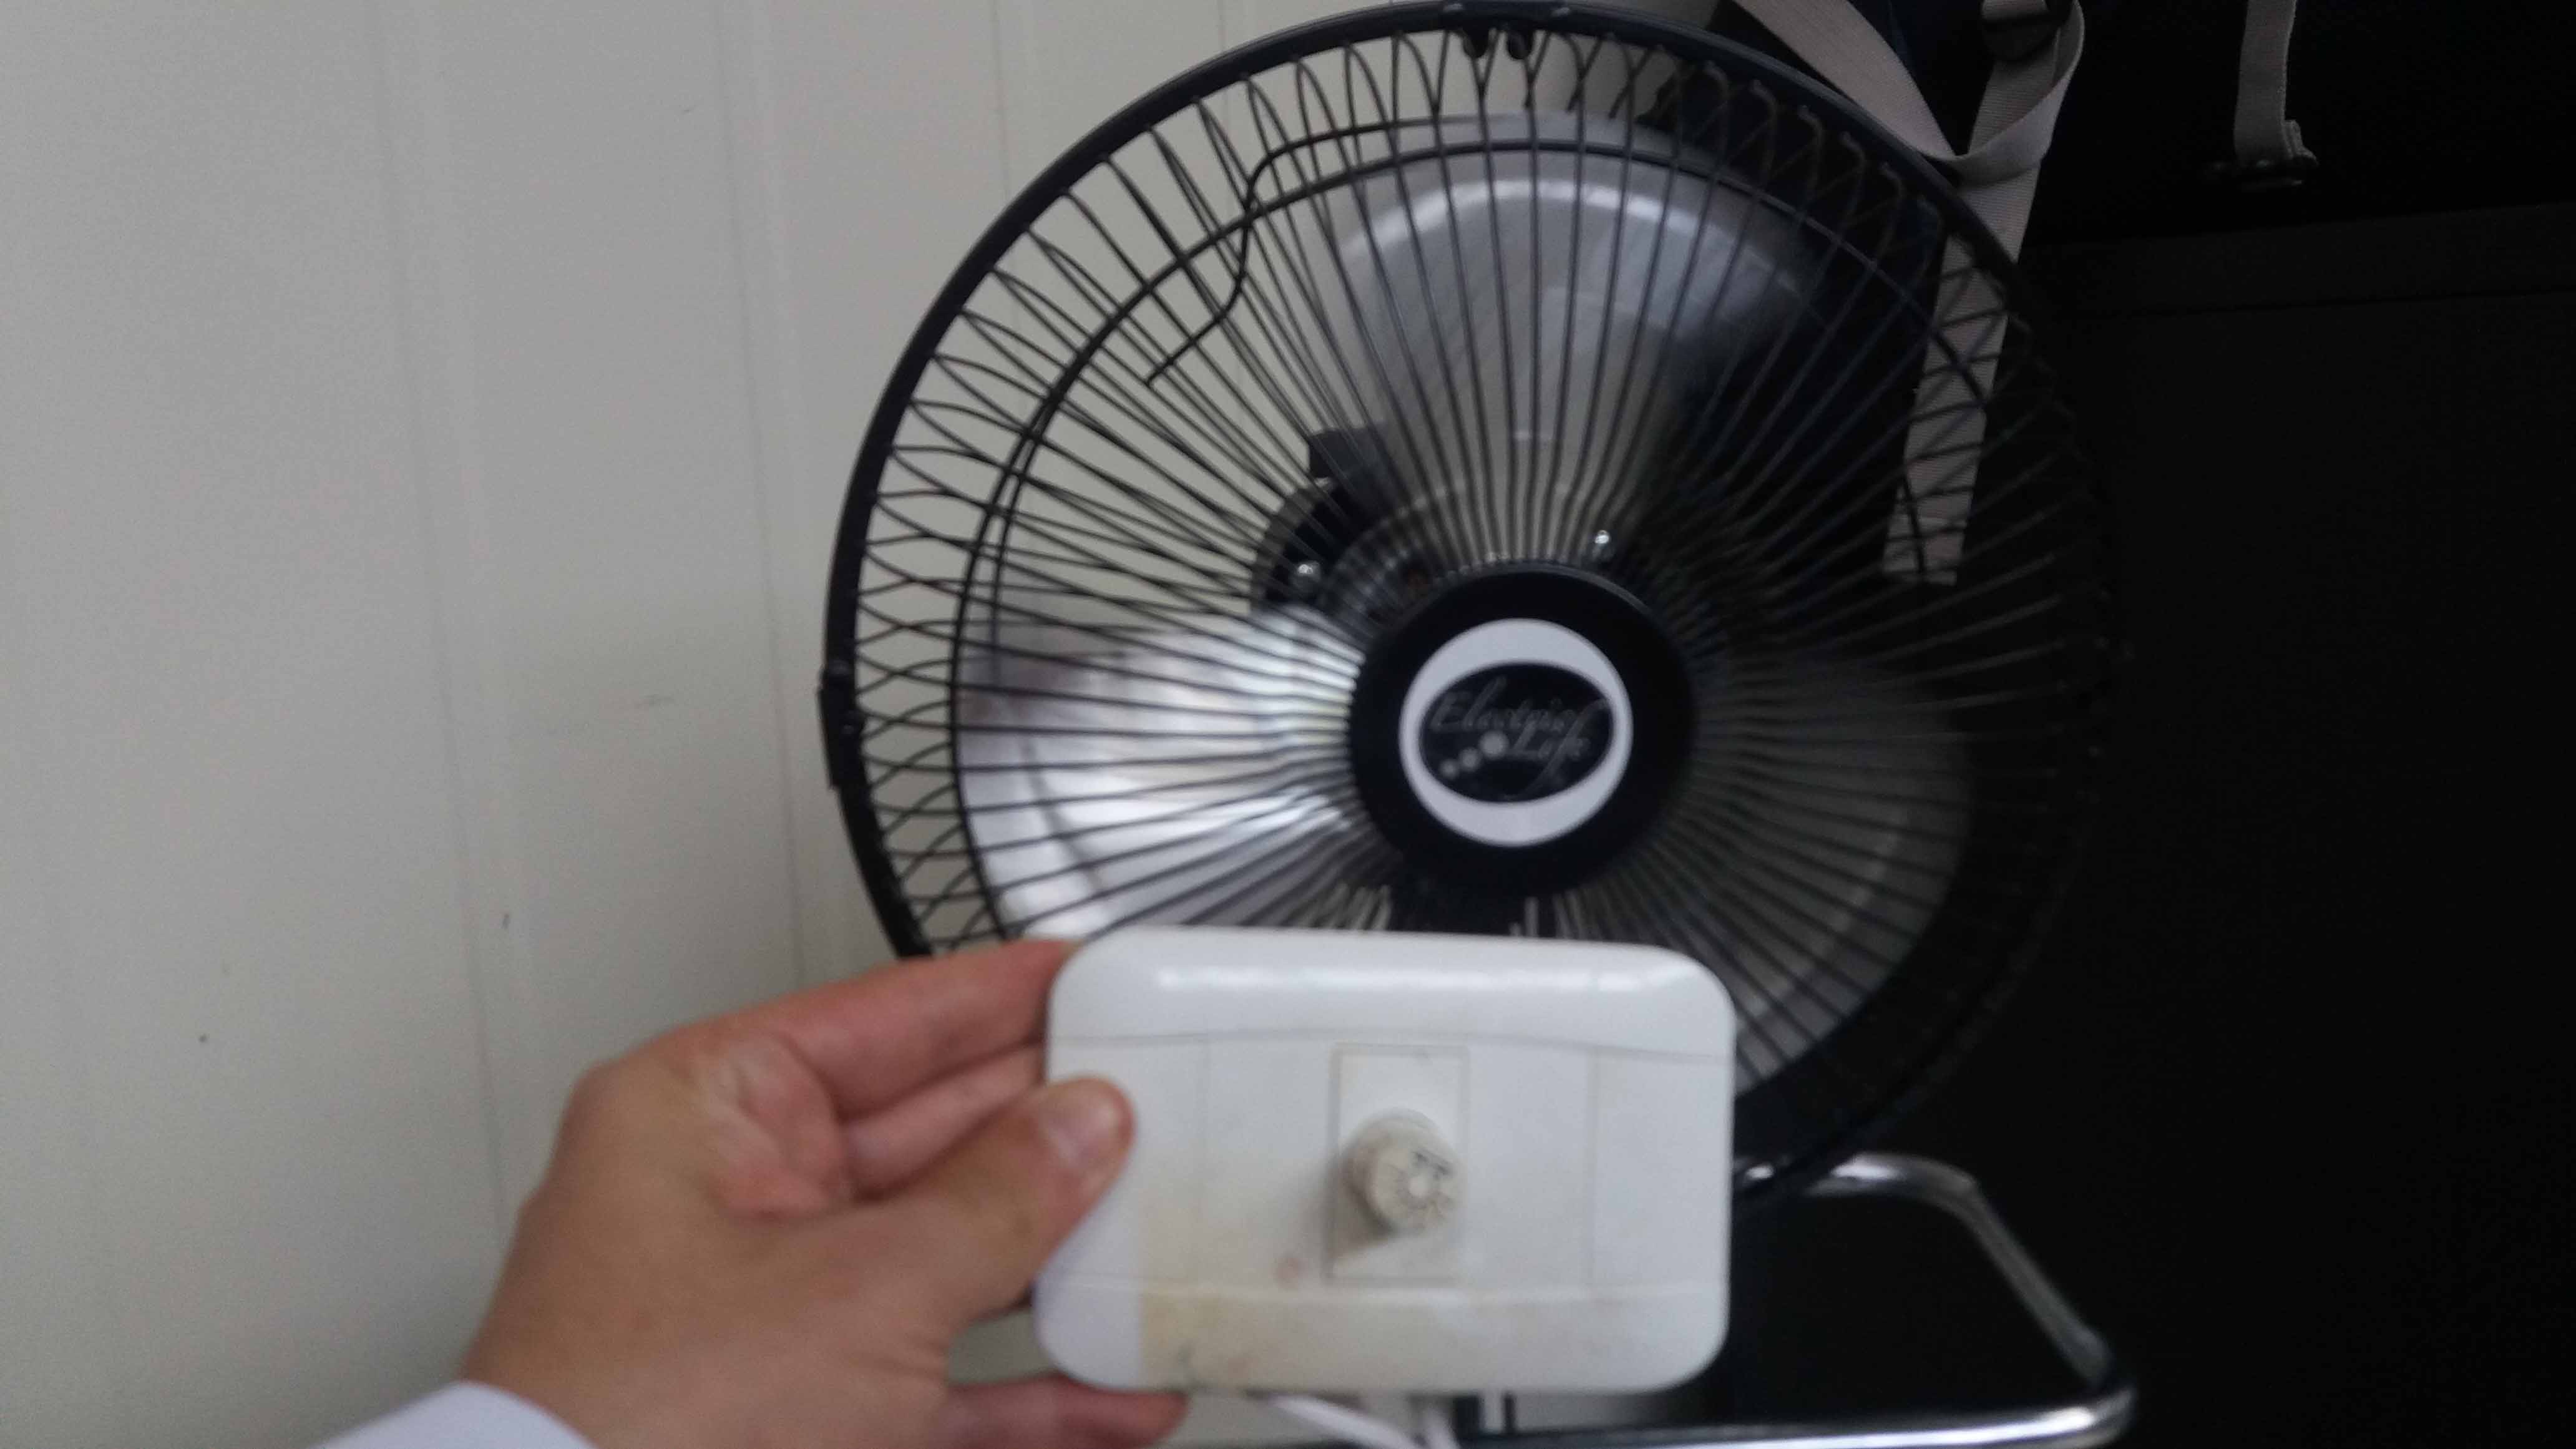
In order to measure the wind speed, I used a indirect method (through the cell phone microphone), using the app Zephyrus Basic Anemometer and changed the speed of the fan with a variable resitance device for 110V AC (comercial dimmer), connected in series in one of the lines of altern current.
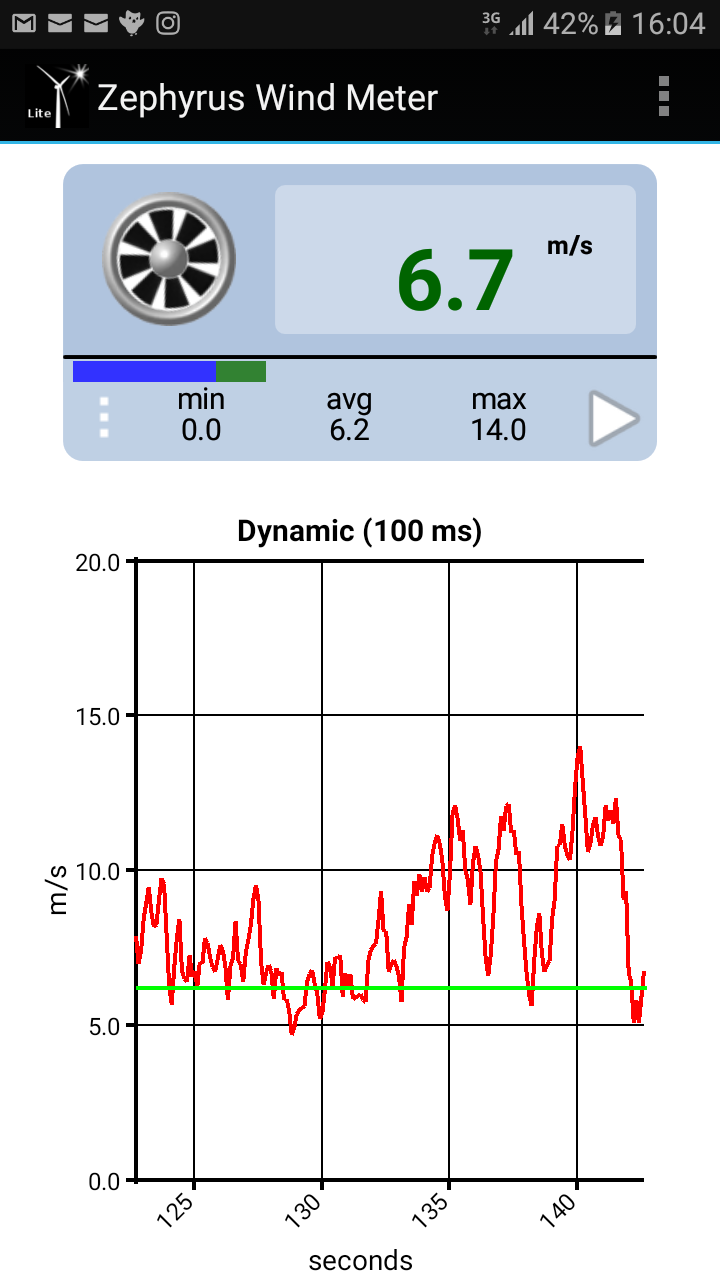
Using the applicarion, I measured the "natural" wind speed. We can see here the variations in wind flow. Here we can see, despite the variations, that the average speed is around 6.5 m/s (marked by the green line).
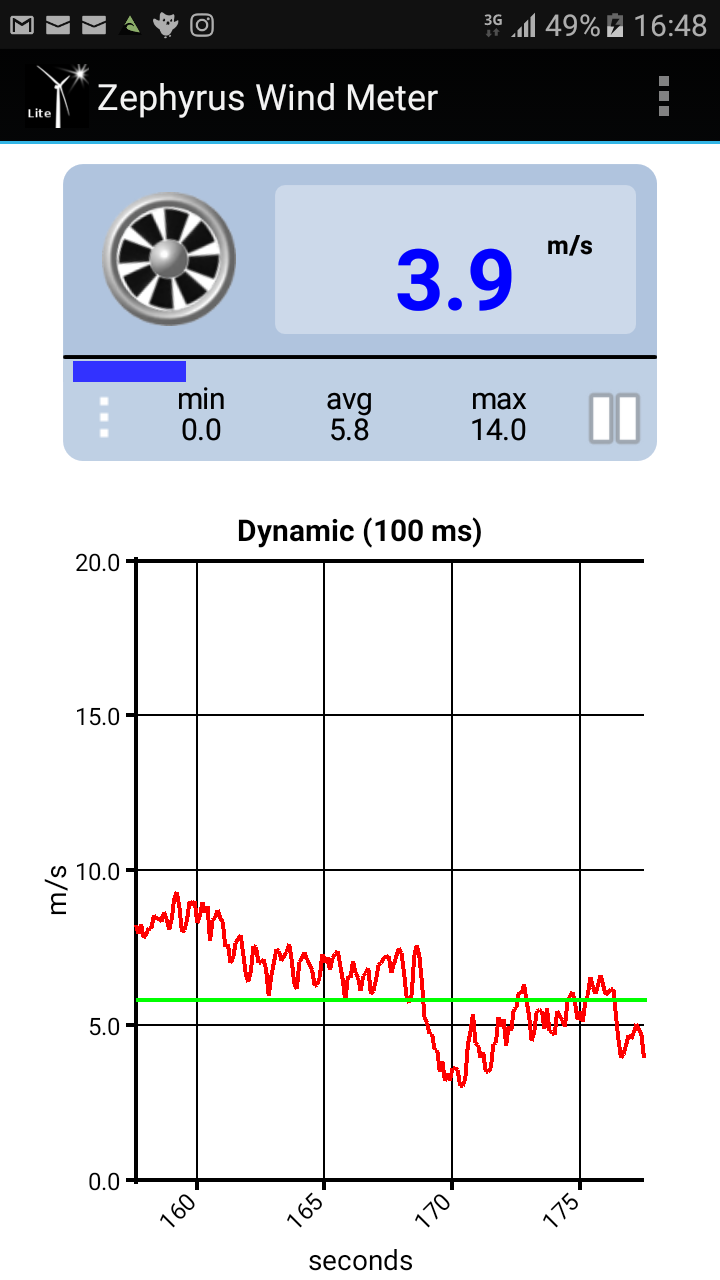
Using our variable speed fan, the records are more stable.
If we increase the voltage and accordingly the speed, we see the changes measured by the App.
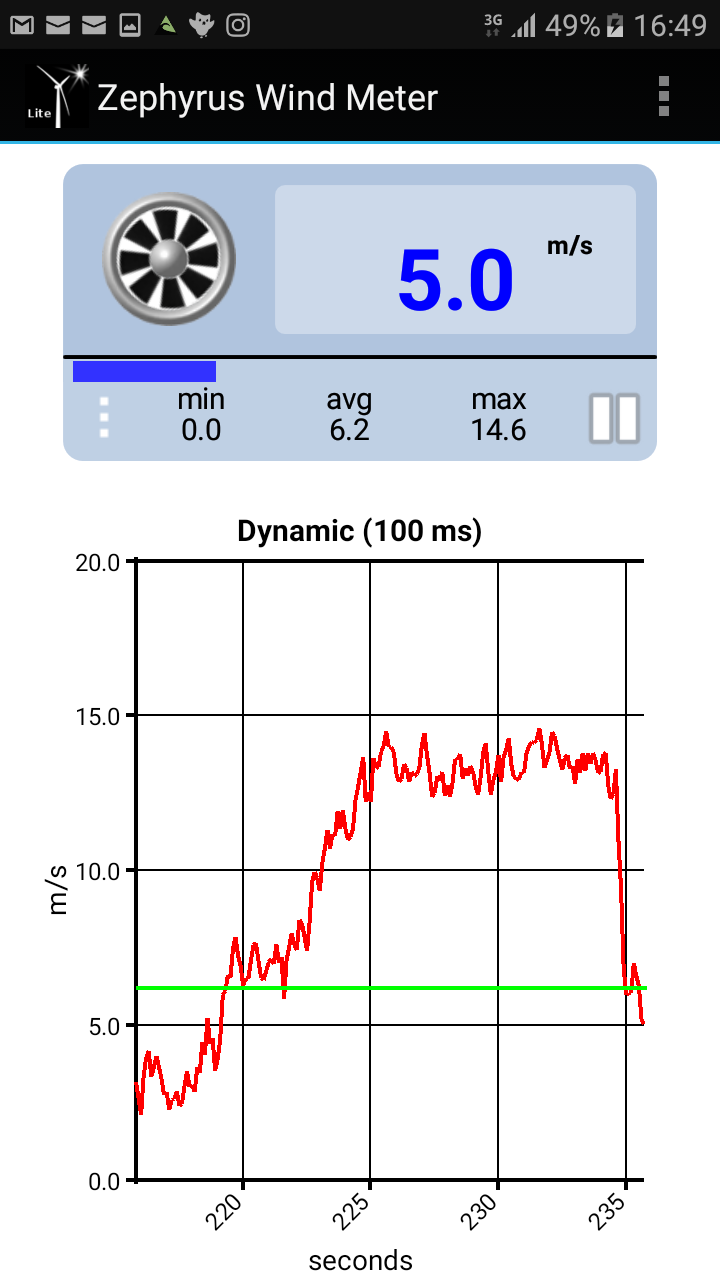
And mantain a maximal speed of 12 m/s. Generally, annual average wind speeds greater than four meters per second (m/s) (9 mph) are required for small wind electric turbines (less wind is required for water-pumping operations). Utility-scale wind power plants require minimum average wind speeds of 6 m/s (13 mph).
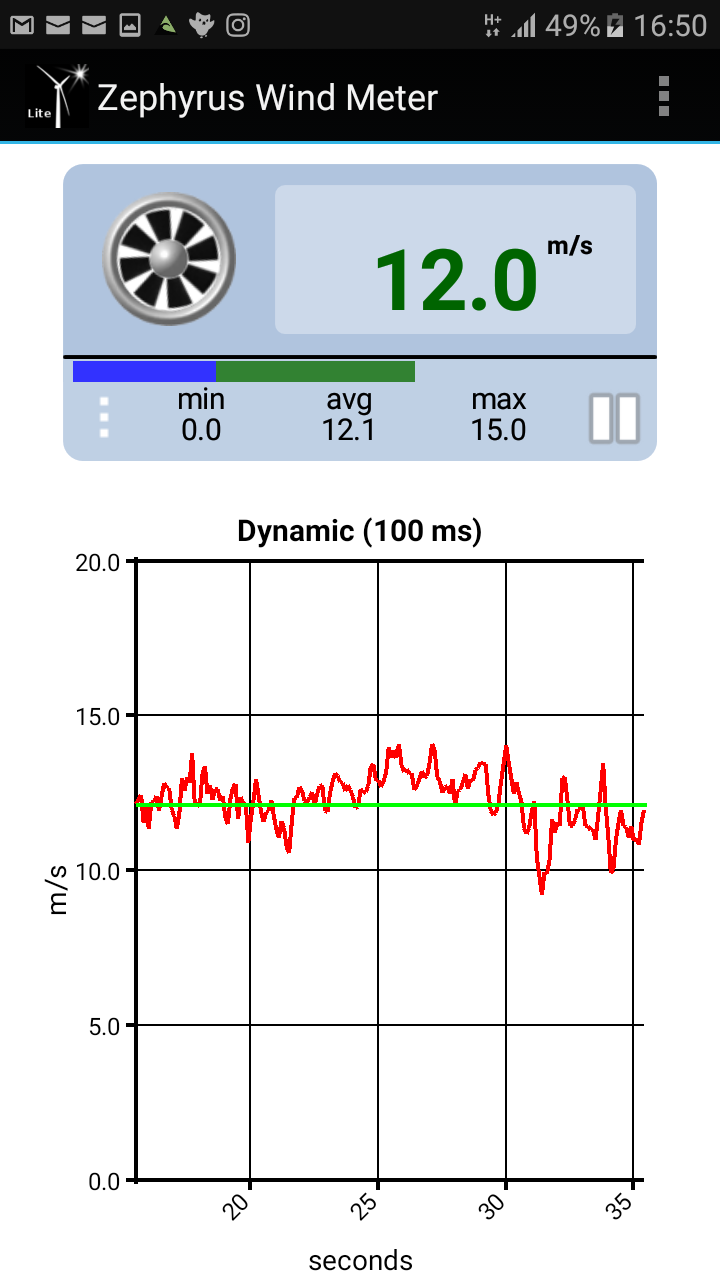
This results show that mild wind speeds can actually be used to genererate aeolic energy.
System description:
I designed the system to be a standalone, so it can collect the energy from the environment (wind force), to provide energy for its operation without the need of a grid connection.
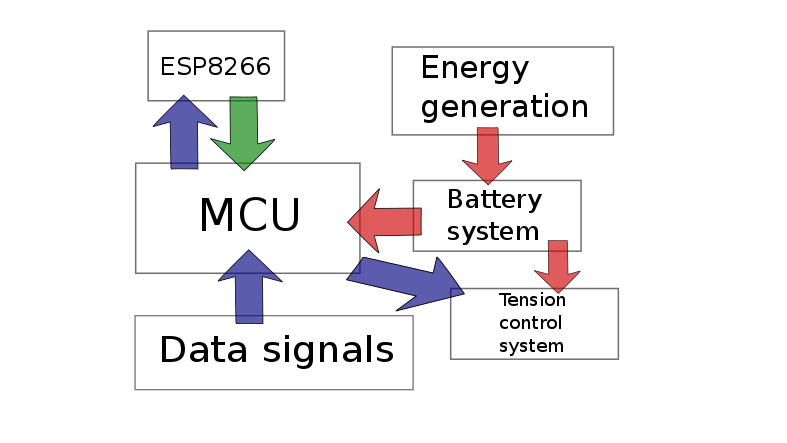
The system consists in MCU that controls its operation. MCU states for micro controller unit. In this case we use the microcontroller AT mega 328P. The information sent to the chip processes the data signals and send them to the WiFi module, the popular ESP 8266, 01 Series.
The data is also processed by the MCU to tell the actuator (tensor) to adapt to the wind speed (force), maximizing the energy harvest from the wind.
The goal for the system is to keep it working without it need to change batteries when depleted, or reach the device. The system is thought to be installed in a remote location where battery charge or replacement might be hard or impossible.
Flow of information
Here the flow of information is shown. The system starts at sleep mode (with very small energy consumption, in a "wait to wake up" state).
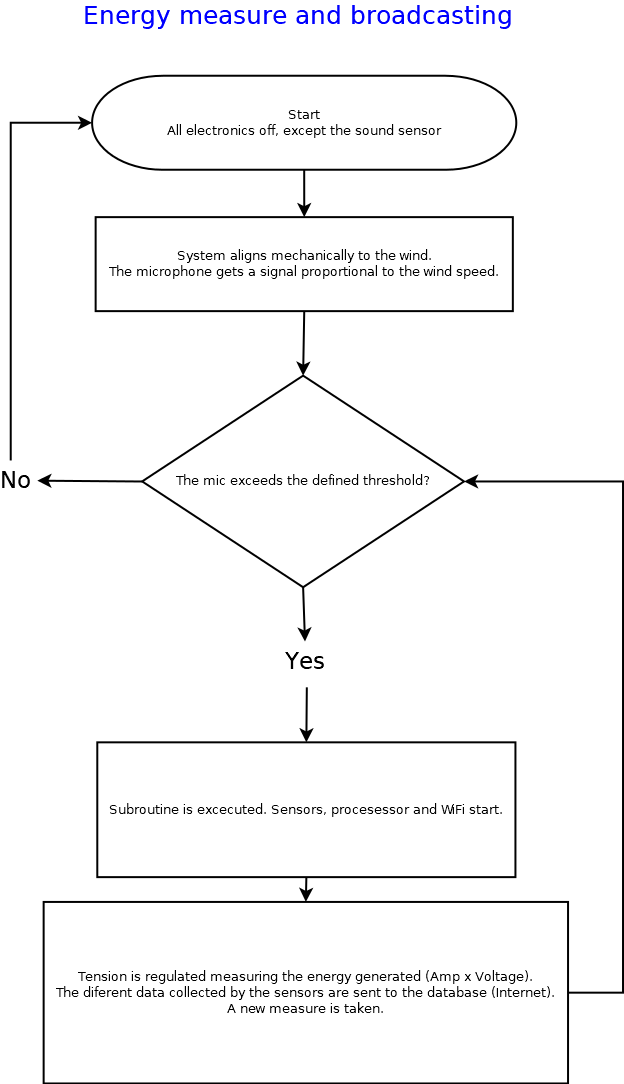
When the geometry of the body works with the wind, aligning the structure towards the wind's direction, the microphone activates the system and wakes it up.
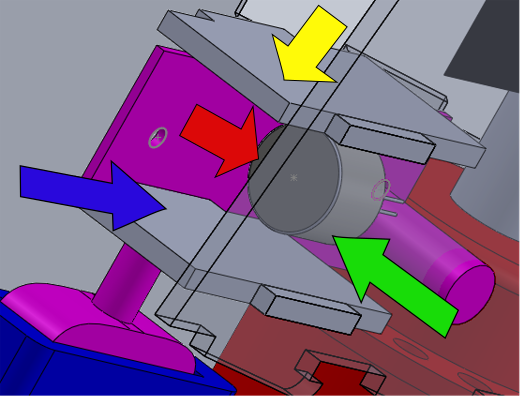
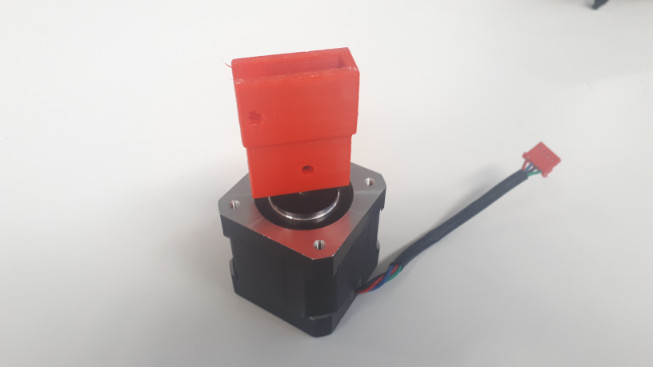
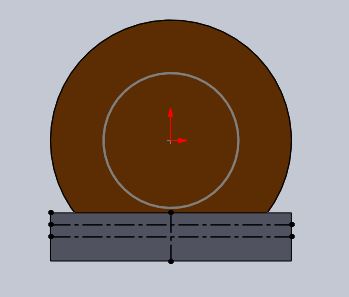
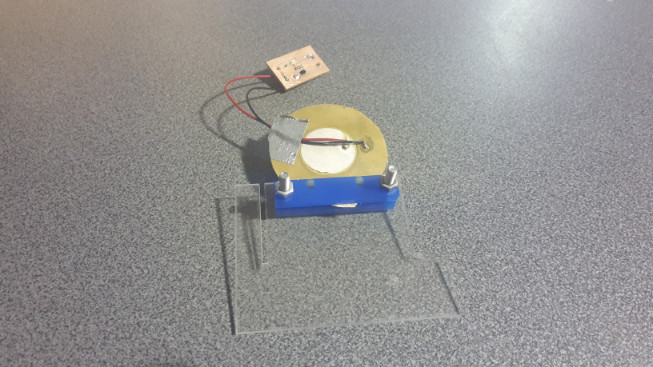
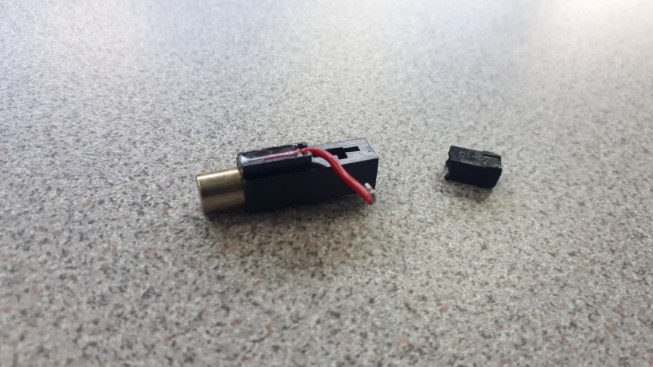
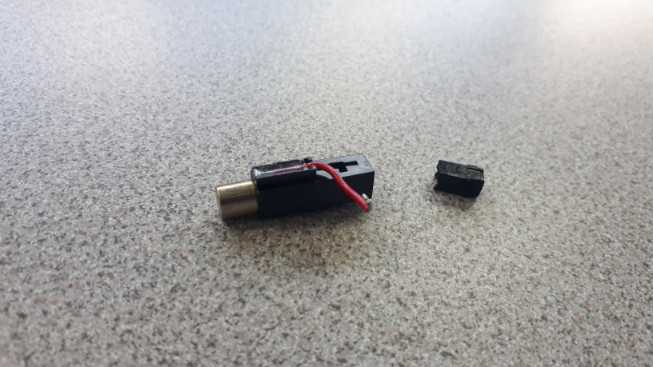
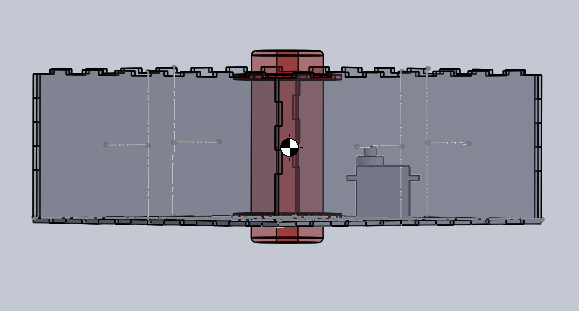
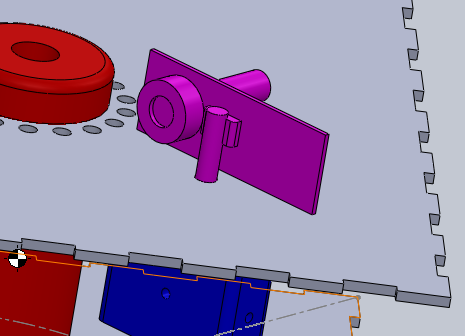
Here we can see the device facing the wind. The blue arrow reperesents the wind direction. The microphone is marked with the red arrow. We can see that the case blocks both the wind in the horizontal direction, marked with a green arrow, and the vertical direction, shown by the yellow arrow.
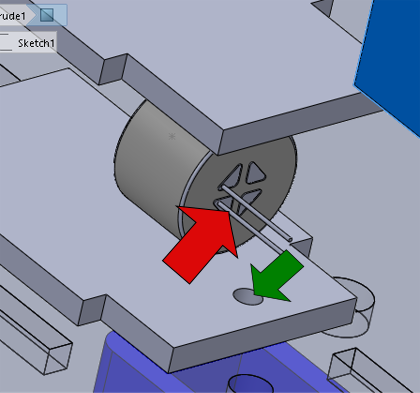
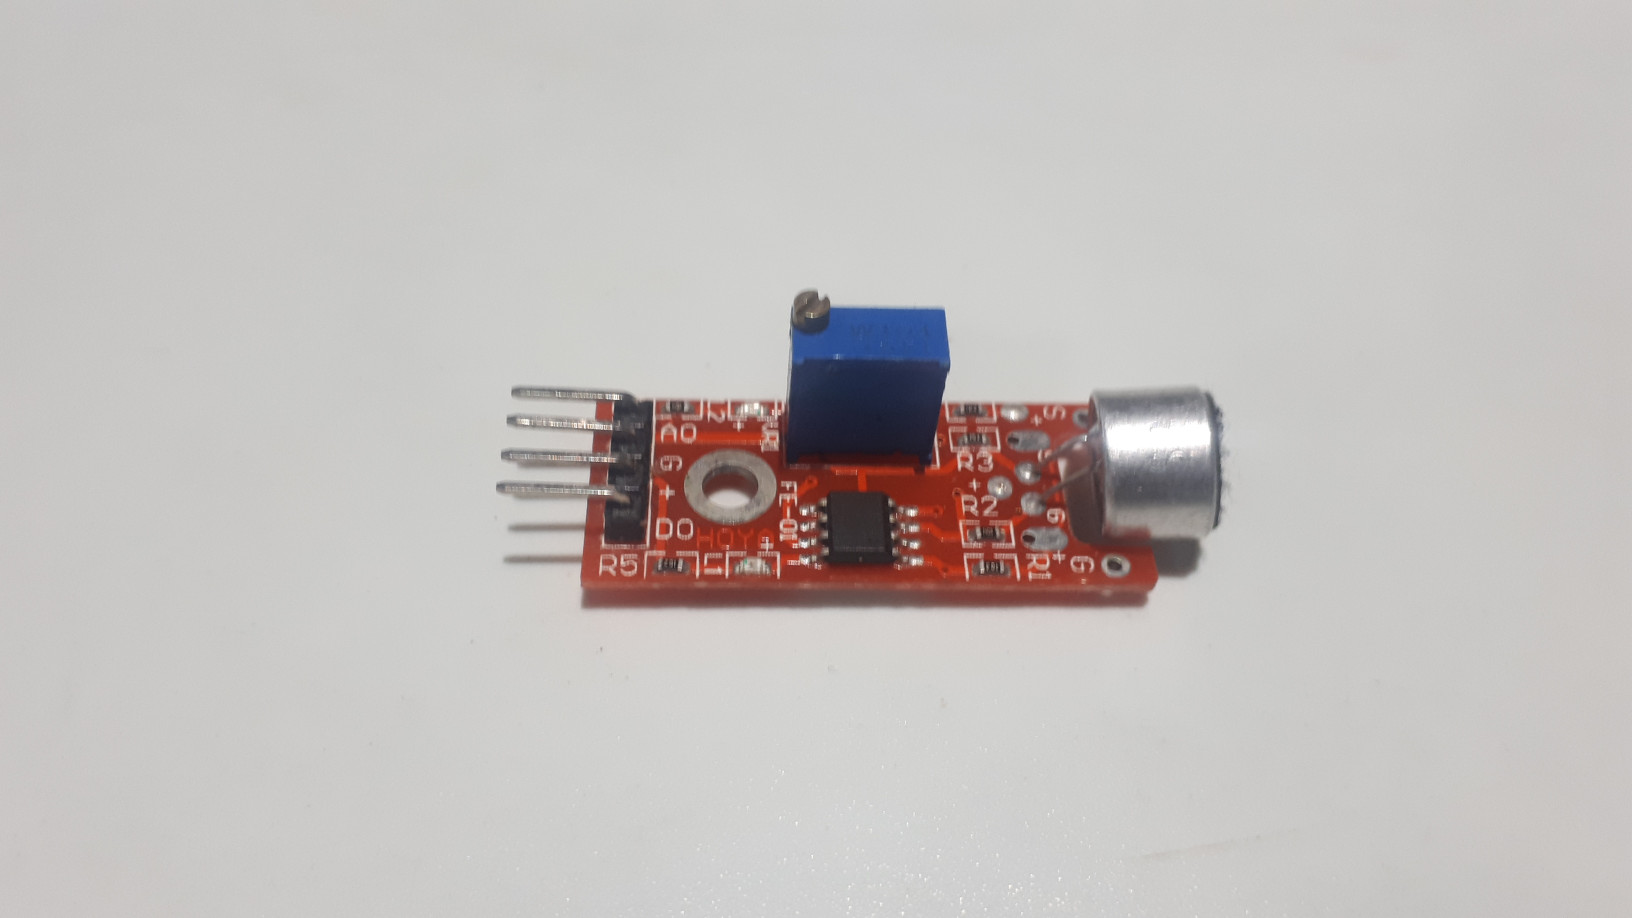
The wind/sound is picked by the microphone, and when crossing the threshold calibrated by the integrated potentiometer, sets the wires at 5V, giving the signal to wake up the system. The signal is transduced from mechanical to electical, and creates a potential in the wires shown in the rear part of the microphone, marked with a red arrow. Then, the signal is passed using a cable through the hole in the structure, marked with a green arrow.
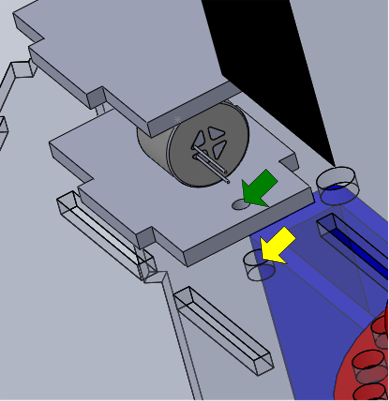
The cable is then passed through the bottom hole into the electronics chamber, here marked by a yellow arrow.
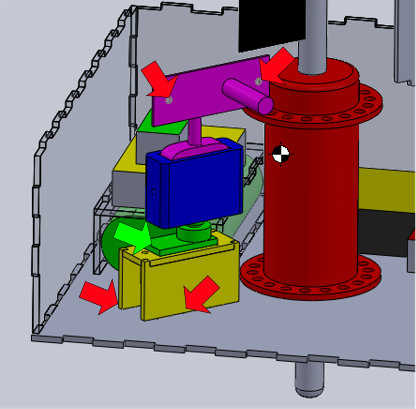
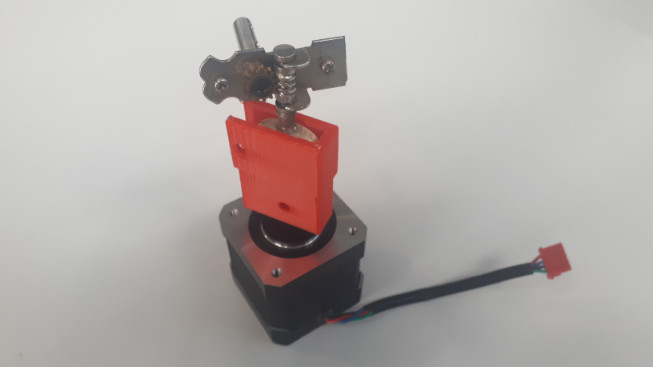
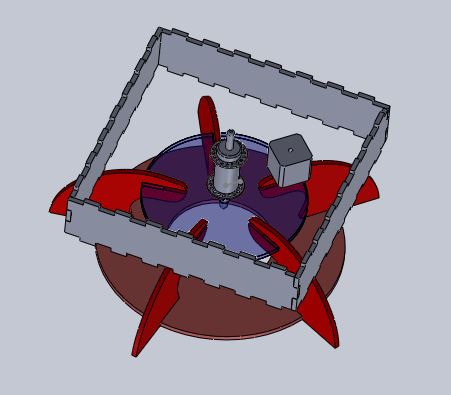
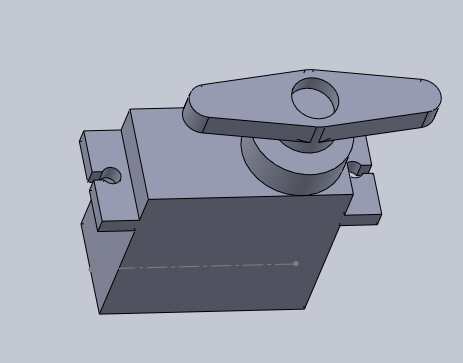
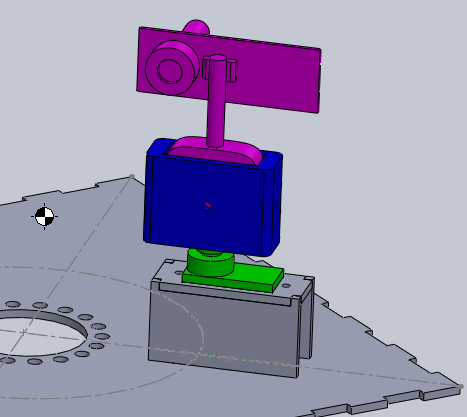
Once the system is awake, it will take some measurements and broadcast it to the web. This information is also used to calibrate the tension of the band. Here we can see the fixed points of the actuator marked by red arrows. The servo, marked in green, moves the vertical and horizontal axes of the peg system.
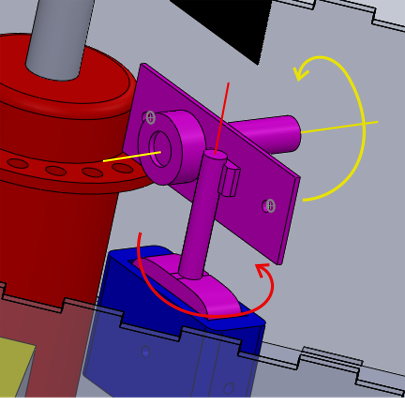
The turn drives the vertical movement to the axis shown in red. Then the worm screw changes the direction of the turn, from vertical to horizontal, marked here in yellow. Finally, a string provides the tension to the band.
Materials, construction and design:
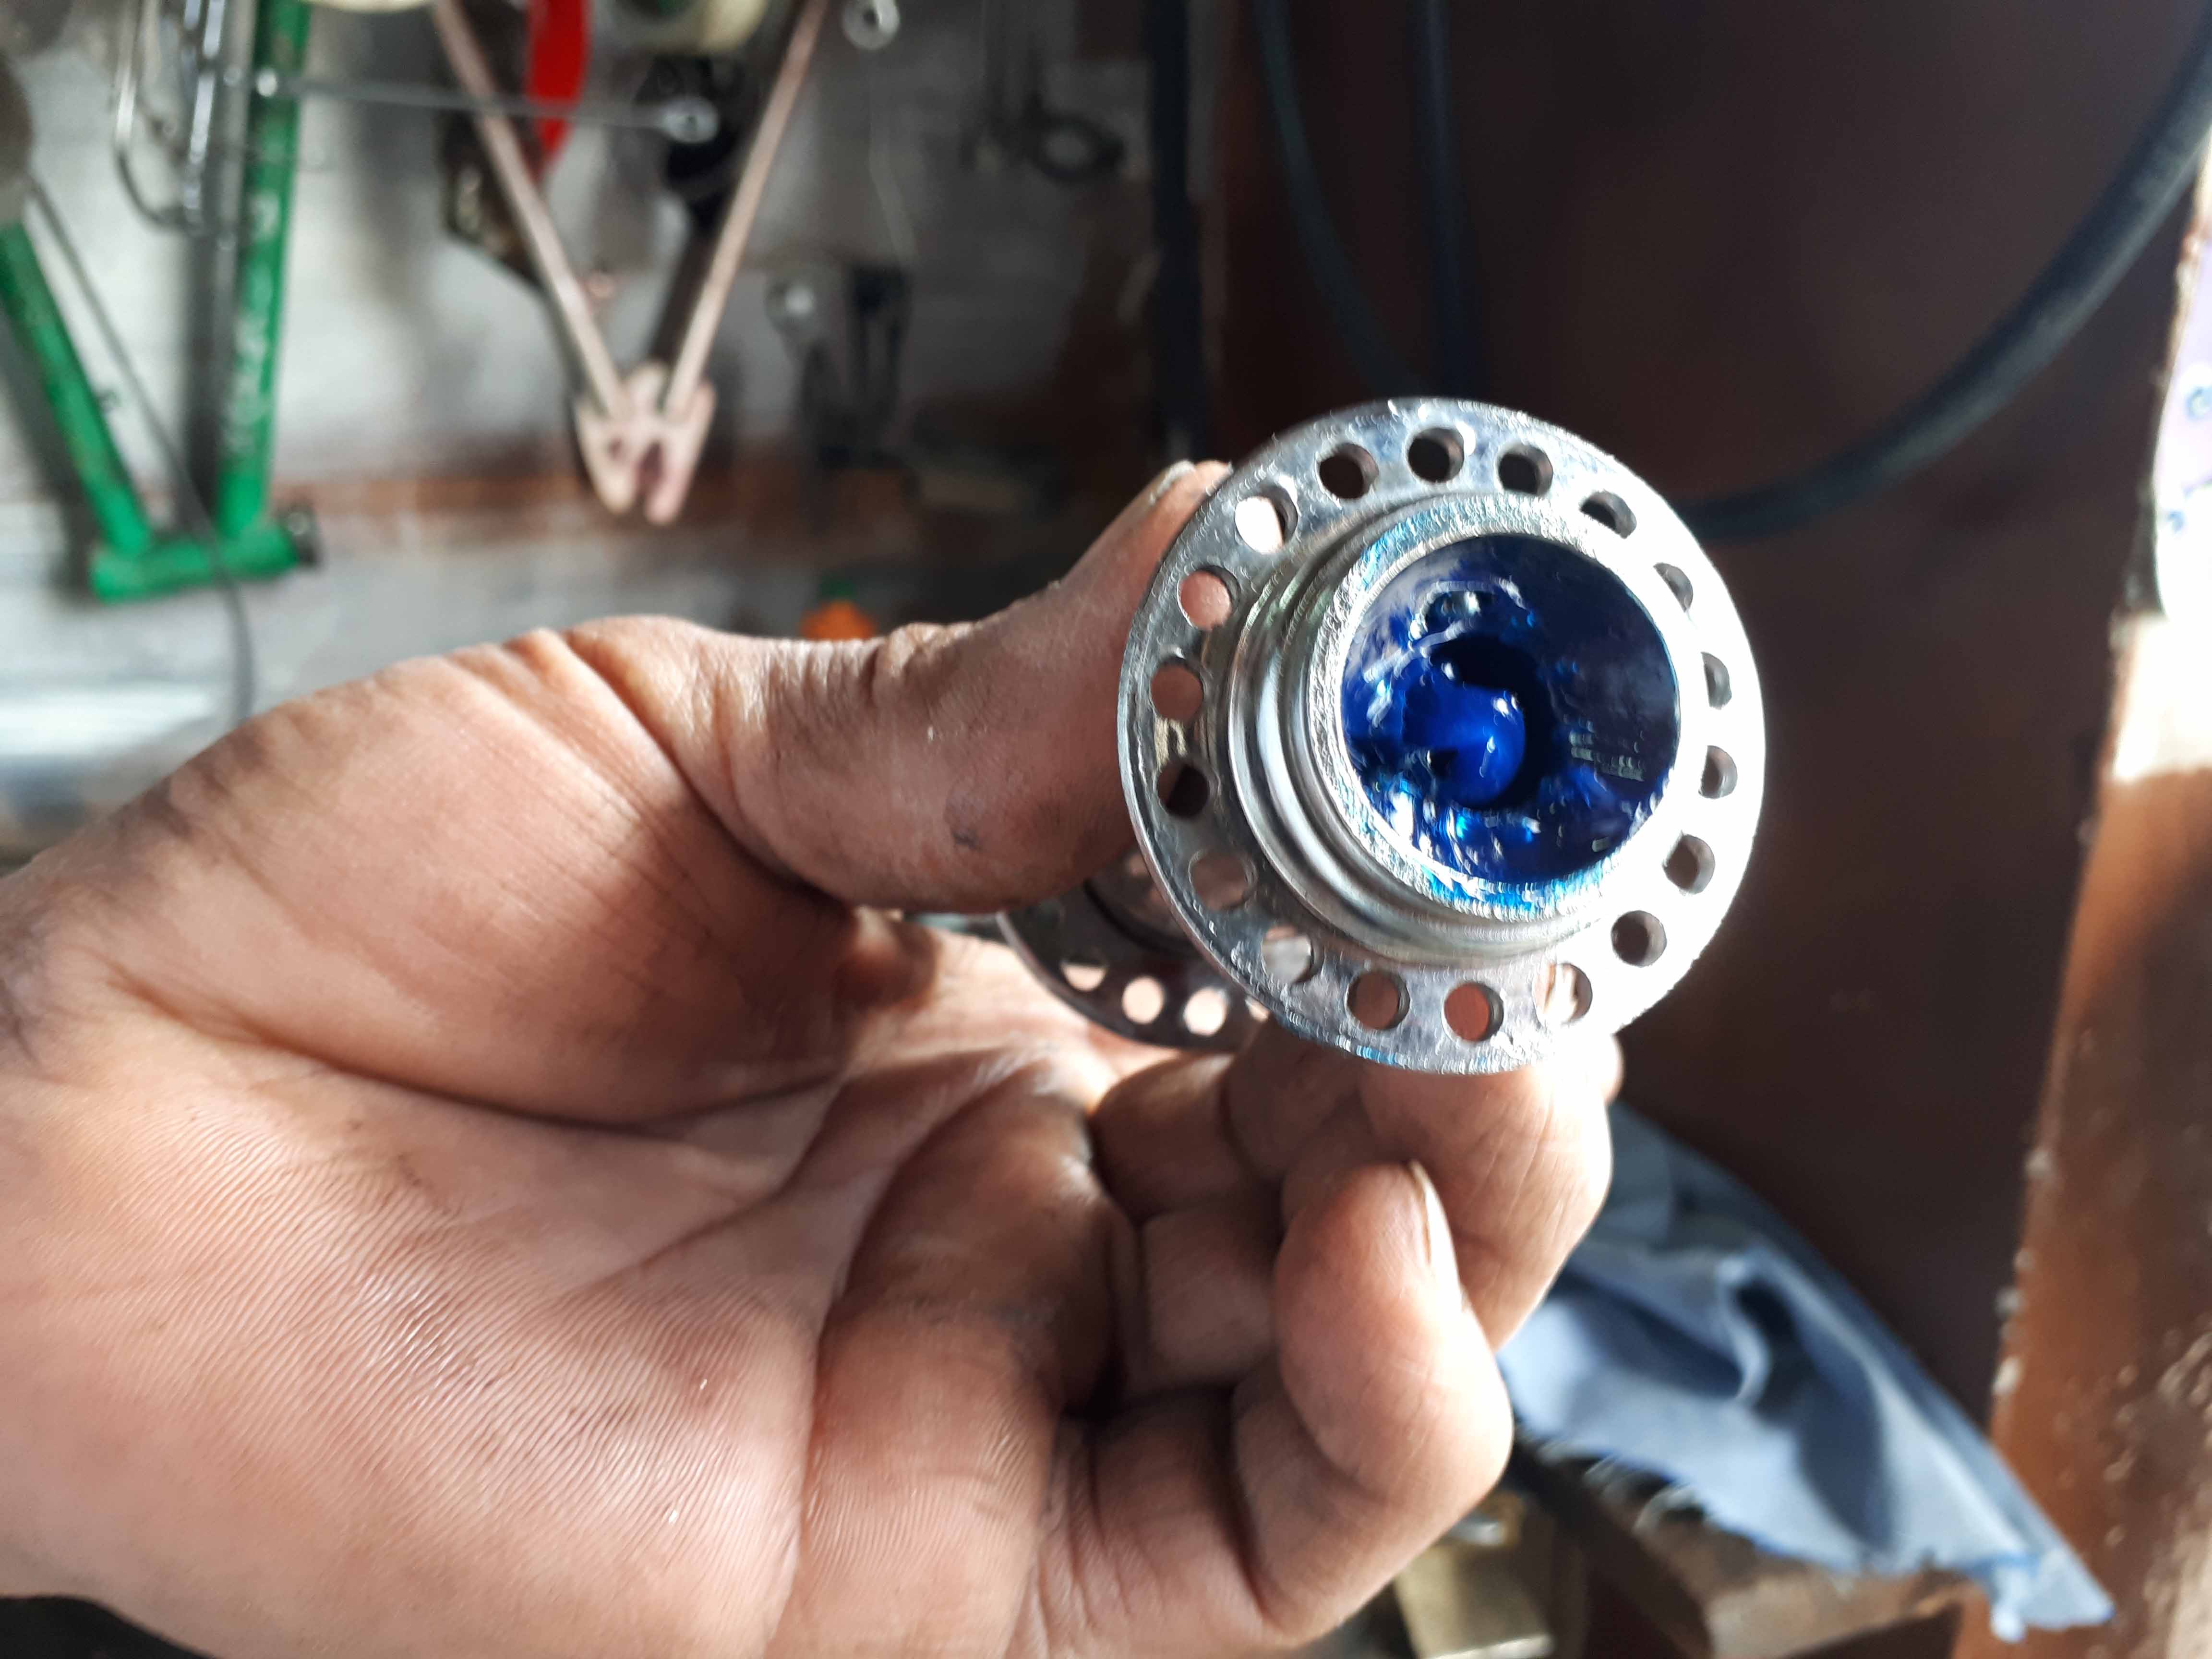
Recycled moving axis
For the axis, I got an axis system (a hub) in a bicycle store. The internal holders were removed to promote movement.
At the beginning, I was thinking in designing a gear system for the band tension. Acylic cutting, 3D printing or molding amd casting were some alternatives, but I saw an old, brocken guitar in my home, so I decided to recycle the tunning pegs system on it. In a sring instument like a guitar, the pegs are the mechanism in charge of the strings tension. The desing keeps the string tense, and at the same time provide mechanical advantage for the task.
The materials used in the construction of the instument system are made of metal, so they will resist stress and use, contrary to the plastic/wood based alternatives.
The systems uses an infinite screw coupled with a gear. It's usefullness, coming from the musical instrument design, mantains tension (aka, no energy needed when not moving). When a change is required, the torque needed is small.
I needed now a material around the axis. Y chose acrlylic, because it can withstand the elements, as the machine will work outdors.
I needed to conect my guitar system to the machine, so it will control the tension. Fot that, I used 3D design and 3D printing.
3D design and 3D printing
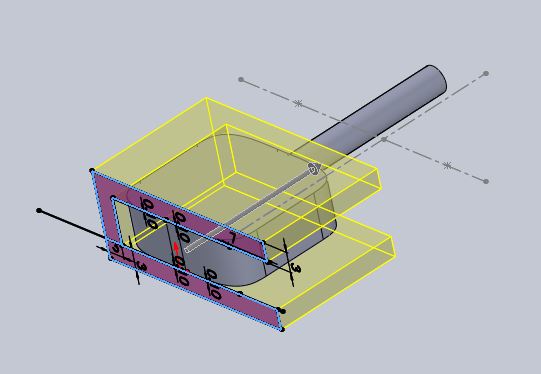
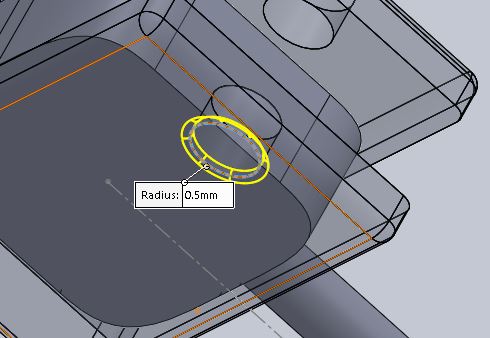
So, I started with the design of a peg and a holder was developed around it (in context desing).
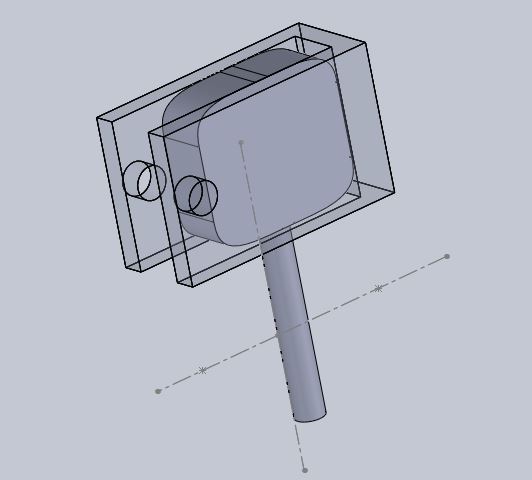
This is other angle and with transparency. Here we can see how the holder embraces the peg.
Then I added some chanfer.
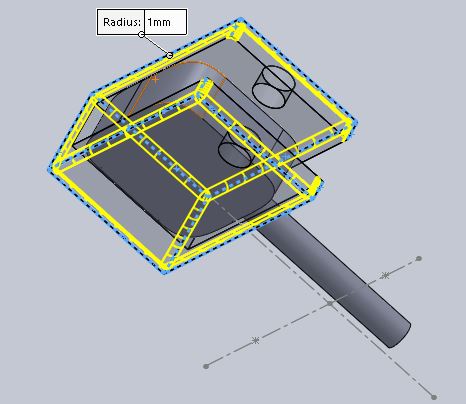
The holes for the screw and bolt are going to secure the piece in place. They will have a chanfer too.
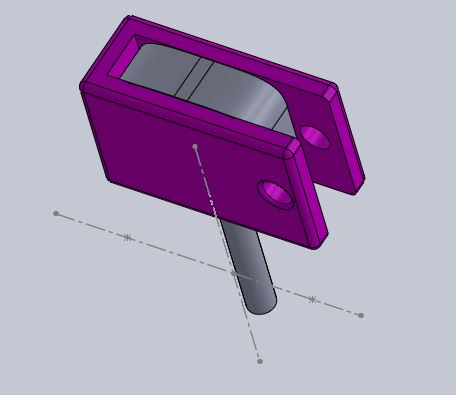
Here is the finished piece.
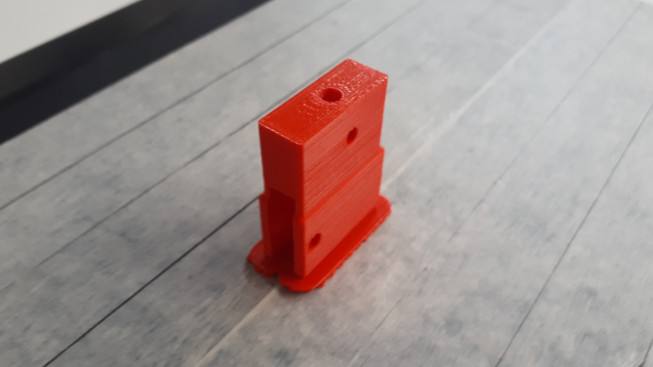
Then, the bits became atoms by 3D printing.
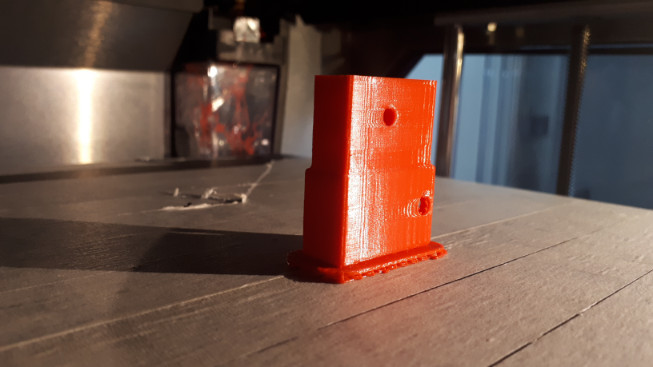
Out of the printer. Remove the base quickly, before it gets stuck to your piece!
Time to test the fitting with the stepper. Perfect fit.
And with the guitar mechanism. Again, perfect fit.
2D/3D design and acrylic cutting
I choose acrylic as a material because of its resistance to stress and rain.
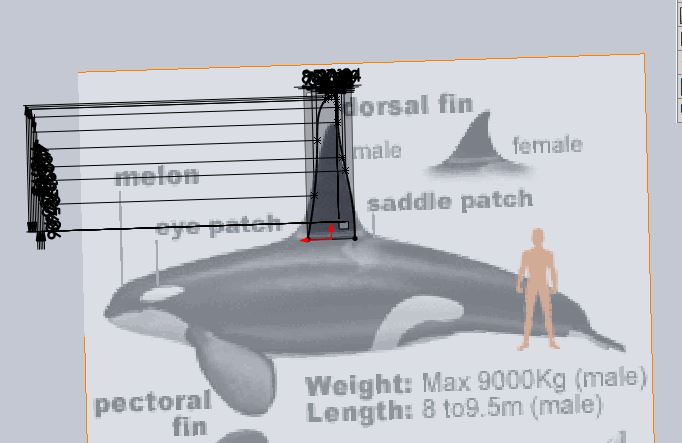
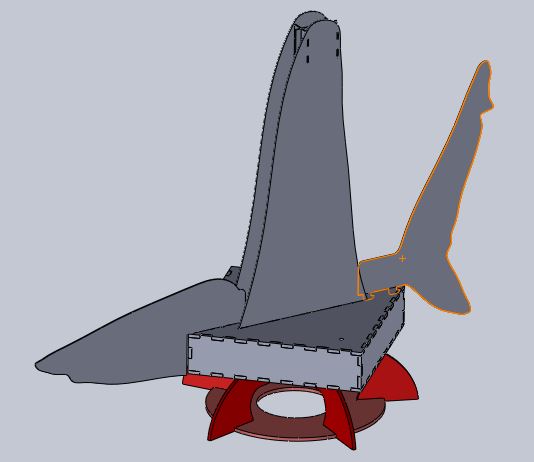
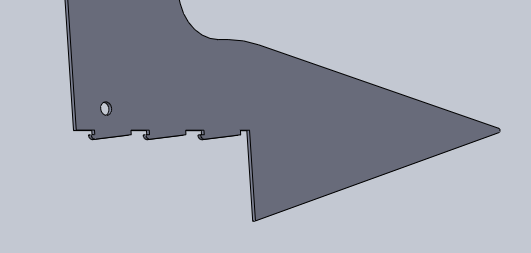
The machine has to be aerodinamyc/hydrodinamic. Nature has been evolving fluid dynamics for 3.7 billion years. For that reason, I was inspired by an Orca to make the tape holder and a fin that will align with the wind.
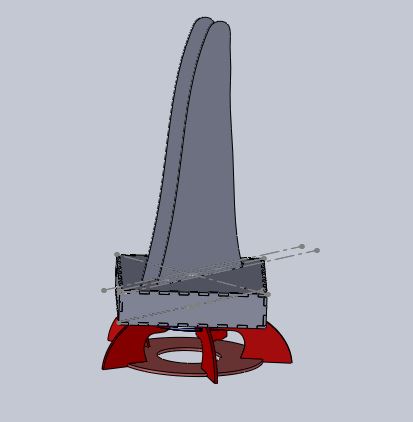
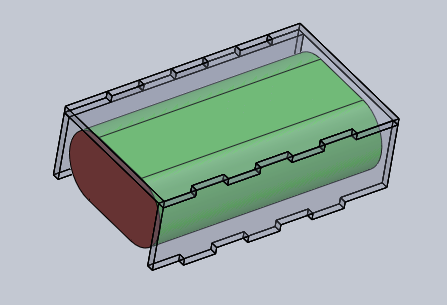
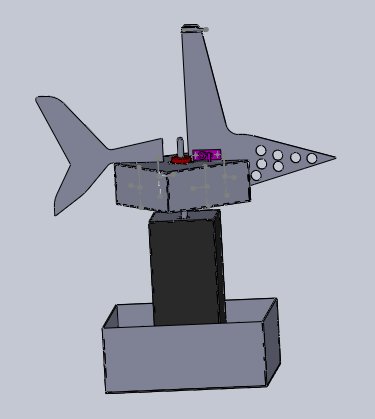
Here it is, assembled. The tape is located in the middle of the two fin shaped holders. The goal is to make them vibrate with laminar wind flow dynamics.
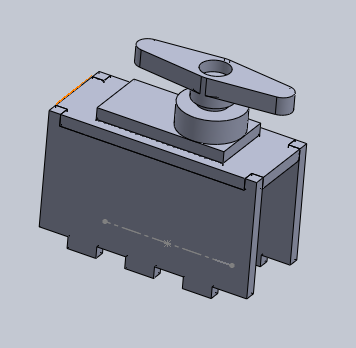
This is the holder for the piezo-electric device. It has to be precisely located.
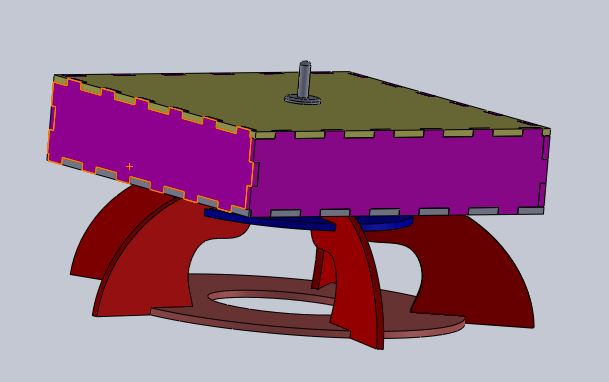
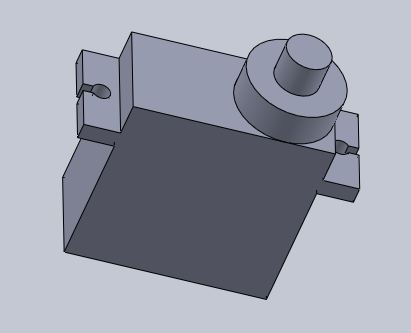
Here is the base coupled with the turnning, upper part.
Here is the machine designed.
Here are some parts hidden, so we can see where the stepper will go.
Electronics and communications
Electronics
Here is the fabricated board. It will sense the input form the piezos, and respond with a change in the tension of the tape.
This is the board that controls the stepper motor that tenses the belt.
Here is the piece that holds the belt. It is linked to the acrylic piece that is easy to remove, and change the belt easily. We also can see here the recrifier bridge (that transforms altern current to direct), and a voltage regulator.
Here we can see the stepper motor attached to the board. The stepper is attached to the acrylic structure by screws, as the board itself.
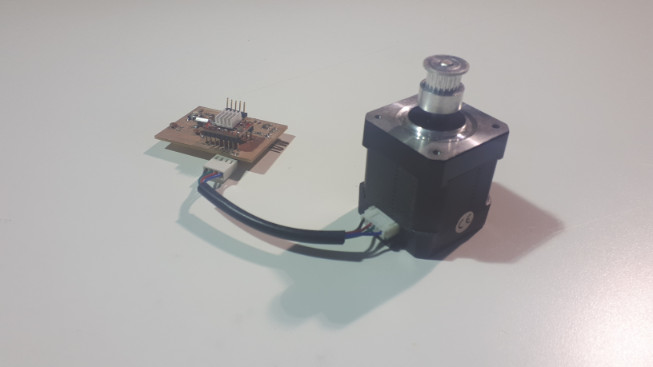
I was worried for the ammount of force to be enough to drive the system, so initially I used a stepper motor. The system was working, but the stepper resulted to be too big and strong for the requirements of the project. Later I found that a smaller device (a servo, continuous motor) would suit our needs with less power consumption. Also, the stepper opperates at 12V, and the servo at 5V. This favor the servo, making the use a buck converter or other means to voltage increase not necessary.
The toque we need is the necessary to move the guitar peg.
Failed test and some physics
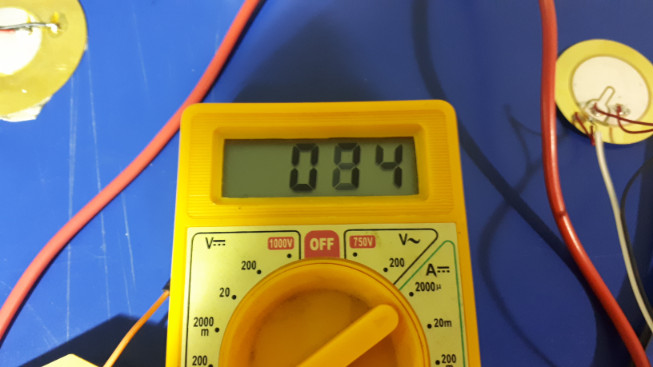
The results from the circular piezo generation output, after the AC-DC conversion resulted in voltages between 2 and 12V, correlated with wind speed. Unfoutunatelly, the current was pretty low, in the range of micro Amperes.
I measured the voltage and amperage of the piezo. Unfortunately, It wasn't much. It was around 84 microamperes. This, multiplied by the voltage, that was around 12 volts give us an input of 1.008 Miliwats, too few for the requierements of the system. I would need a bigger fan or maybe a windtunnel to testing the device with more energy input, or maybe change the system of energy harvesting, as Neil proposed.
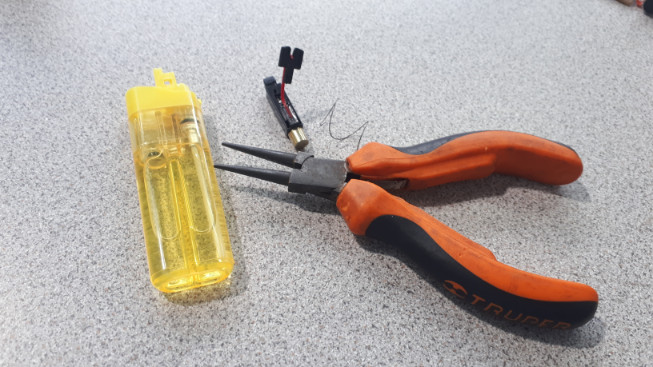
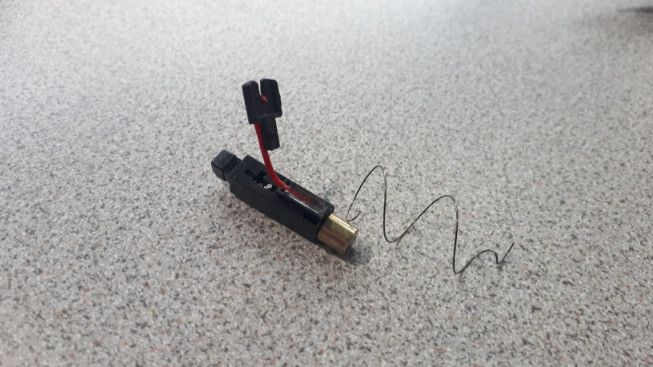
So, I tryied (and fail) with the use of an alternative option, a lighter piezoelectric and some toroidal coil.
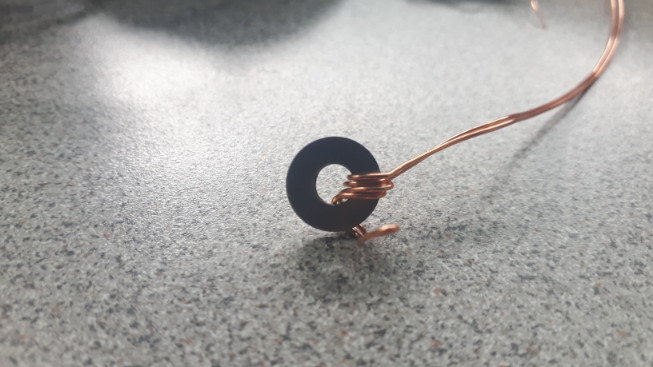

Just for testing, I tryied to meassure the output of this piezos. Latter I found that the voltage generated by this devices was very high. The test actually fried my multimeter, so I rejected this alternative.
Under my experince, it would be possible to use more circular piezos in series, to increse the current and keep the voltage constant. I will test this when I have access to more piezos.
I think the desing of the shape and size of this transductor requires a lot of experimentation and design (more than I calculated).
Communications
The original layout had to change. My original idea was to use a LoRa system to serve as a LoRa server or a LoRa transmitter. Unfortunately, a LoRa base was not available in the area, so as a proof of concept I changed the system to a conventional WiFi communication system.
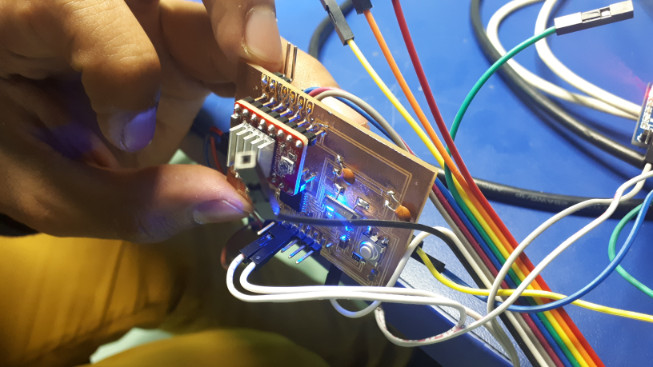
I started testing the WiFi chip (ESP8266).
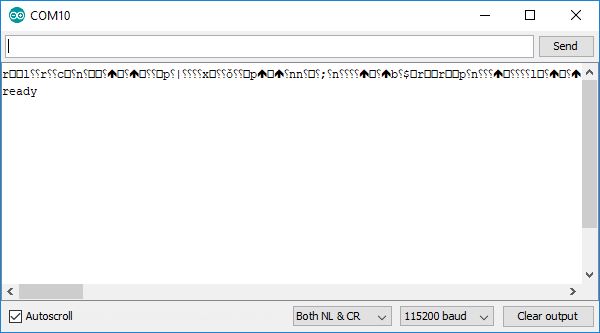
At the beginning I used an FTDI cable for communication with the ESP chip, to test it. The communication presented no problems.
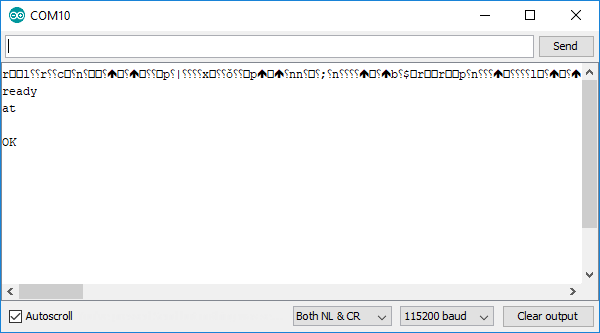
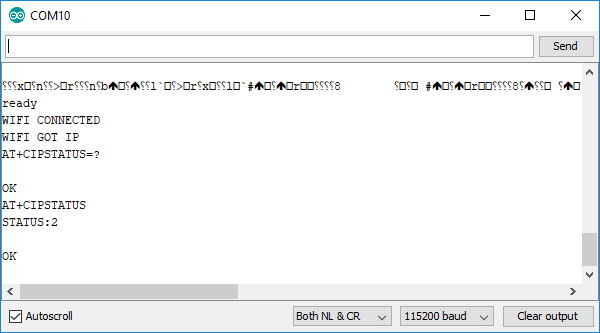
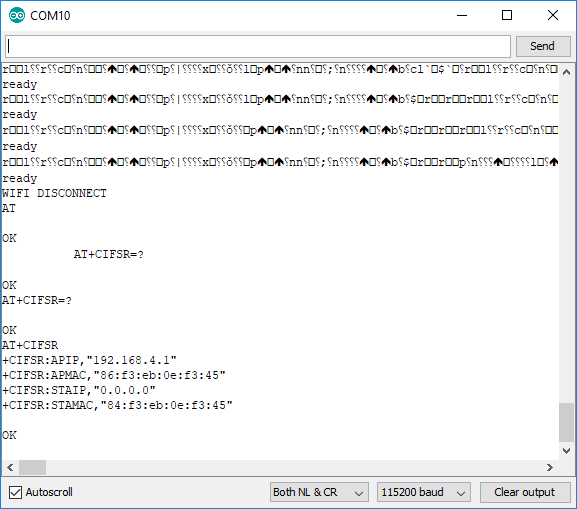
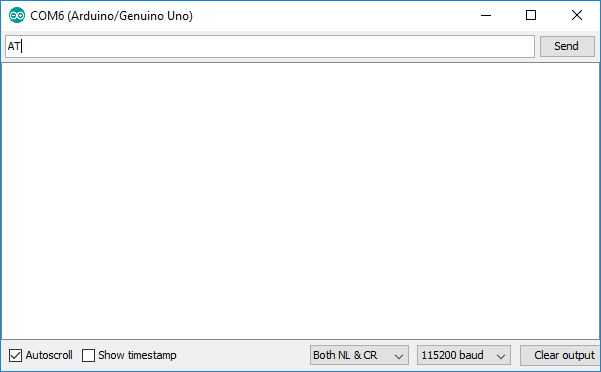
When we connect, first we see some garbage and then the word ready appears. It means that we have good connection. We have to be sure we have the baud rate set at the speed required by the WiFi to communicate through its Serial port. In this case, we are going to start at 115200 baud, the default speed of the ESP8266.
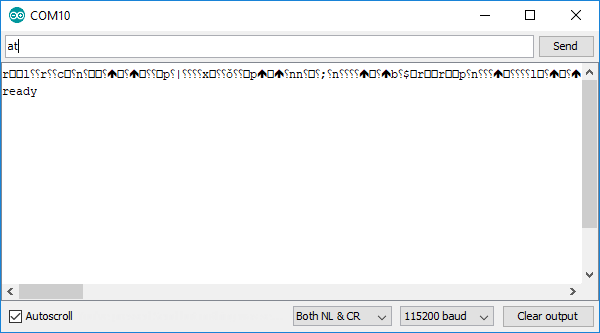
Second picture shows the letters AT in the console (serial monitor). The user can input commands here, and AT is used by the system to test if it is communicating (responding). When we hit ENTER, the command is executed.
Here we see the OK response. Then, we use the command AT+CWMODE = 3, to set the chip’s mode. We set the chip as either STA (Station mode), AP (Access Point) mode, or both. Here 3 == both AP and ST modes enabled.
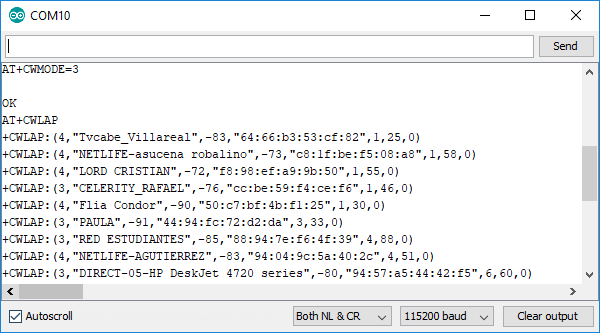
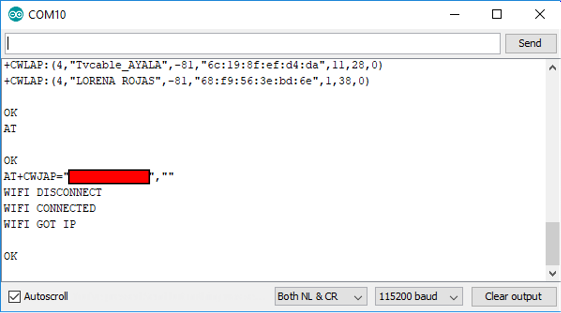
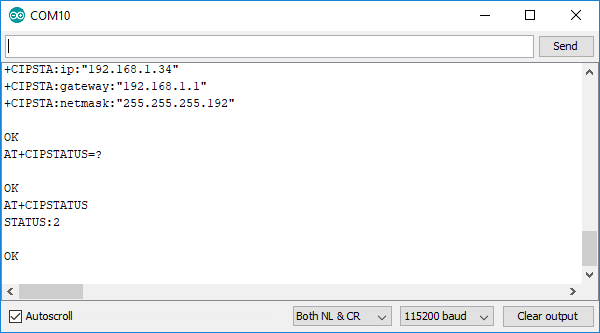
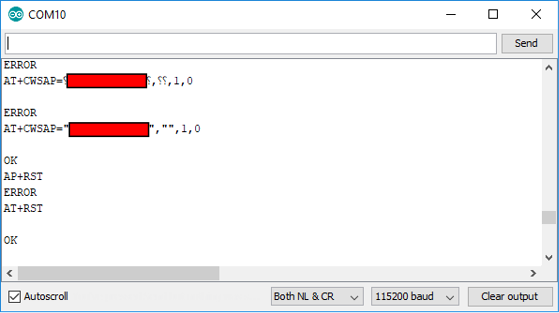
The next command, AT+CWLAP, show us the available Networks. The first number represents the connection encryption (0, open, other secured). The second argument, the name of the network (SSID), the next the signal’s strength, then the MAC address, channel, scan Type, scan time min, and scan time max. Here we can find the network where we are going to connect. I started using an open network for testing as it was in my range at the moment. The name of the network is hidden by the red square. Ww can comfirm, with AT+CIPSTATUS, that we got an IP address.
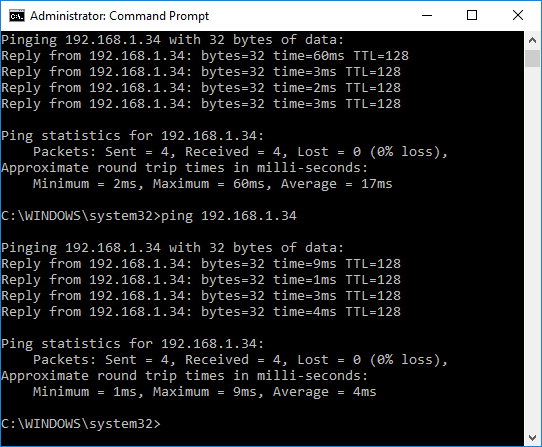
Then, when I tryied to ping the device from a command console, I didn't have an answer.
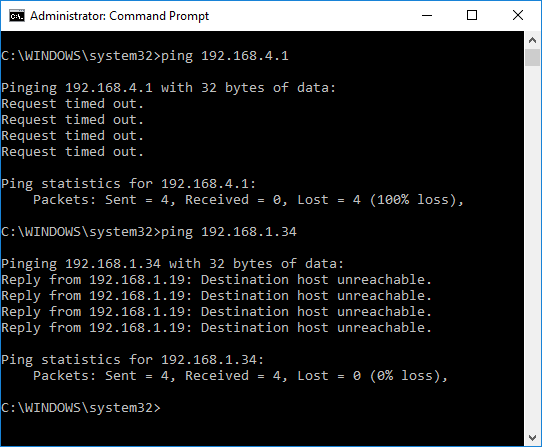
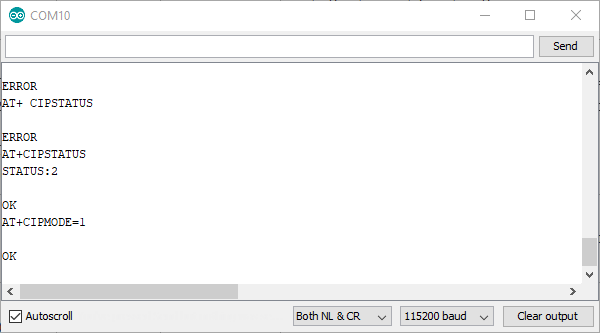
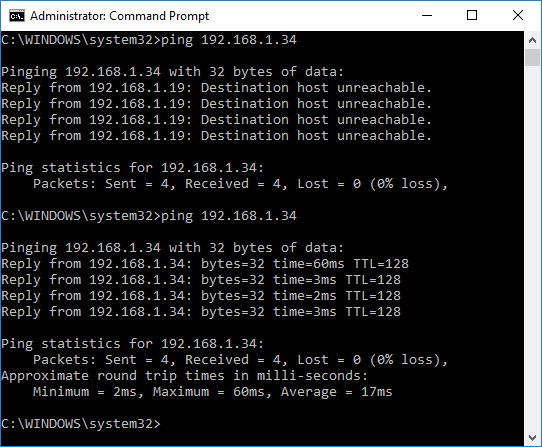
I changed the ip address of the device, but still no luck. Finally, I changed the transfer mode to 1 using AT+CIPMODE = 1. Then, I've got a response from a ping command from the console.
Trying other commands is interesting, like this one, that creates a (soft) Access Point. The ping command still gets a response.
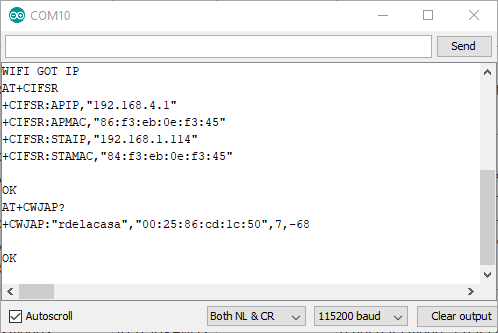
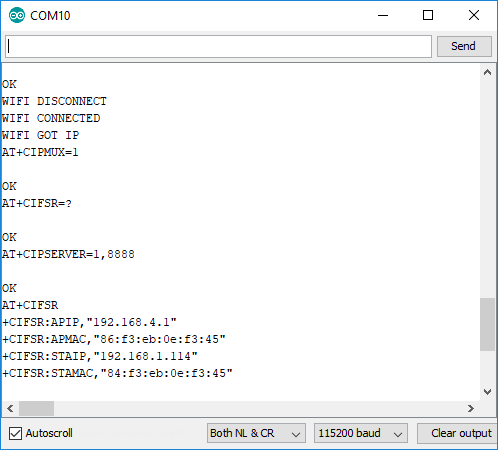
AT+CIFSR is a command that presents the AP and MAC addresses of the ESP8266. Then we start a server with the command AT+CIPSERVER, with a type 1 and a port 8888.
AT+CIPSTART starts a connection. The parameters are: ID of connection, type of connection, address and port. I tryied a few times, but I had got an IP ERROR message. I could connect using UDP connection, but the success was due to the correct format of the inputs (the address is a string, so it has to be enclosed in brackets). For this application, a TCP connection is adviced.
Once the connection is active, the command AT+CIPSEND prepares the message. The paramenters are: ID, and lenght of the message. The first should be used in the case of multiple connection setting (up to 4). This message used 5 characters (12345).
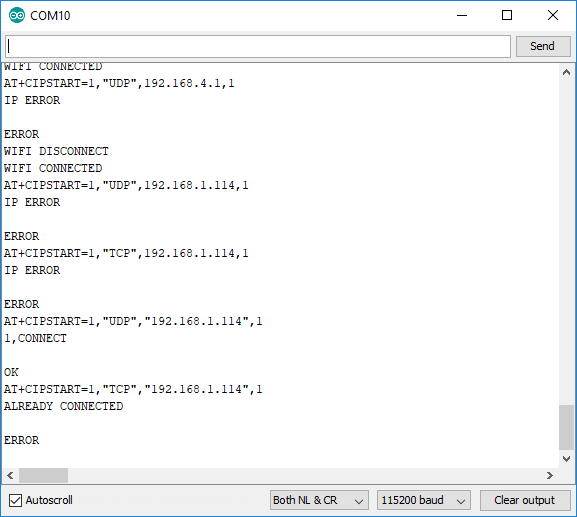
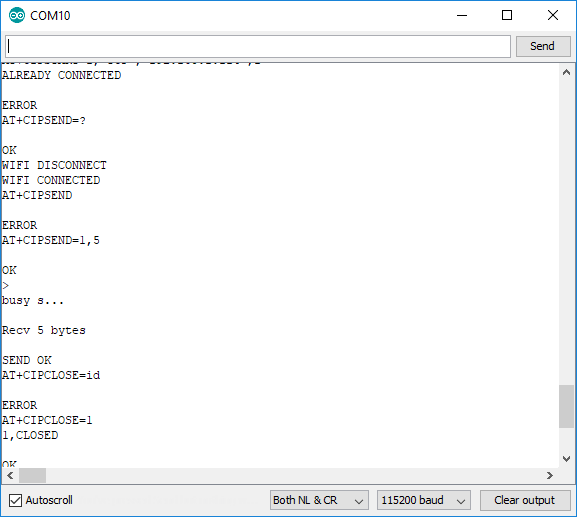
I tried the other IP address and had no luck. After that I had to change the IP (192.168.4.1:1) manually. The test form the browser returned a restricted address.


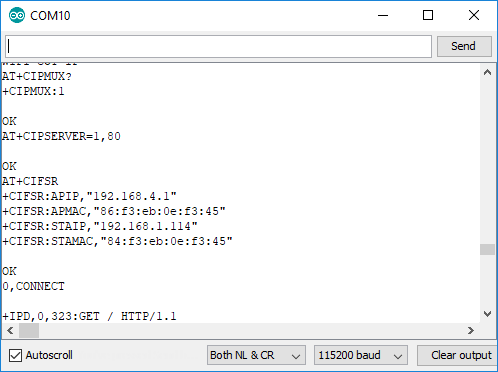
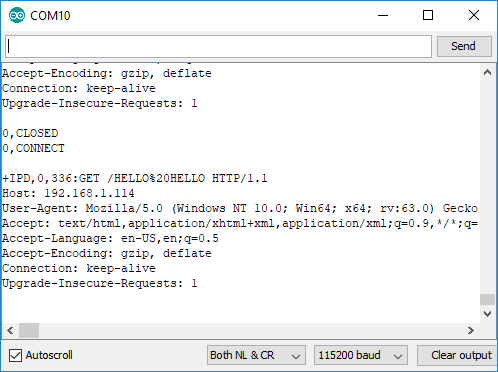
After the connection is stablished, it is posible to send messages from the web (browser) to the ESP8266. The format is: IP address (192.168.1.114), followed by a colon, the port (80), a slash, and a message. In this case it was HELLO, HELLO (to change the typical HELLO WORLD). The message and the details appear in the arduino serial monitor.

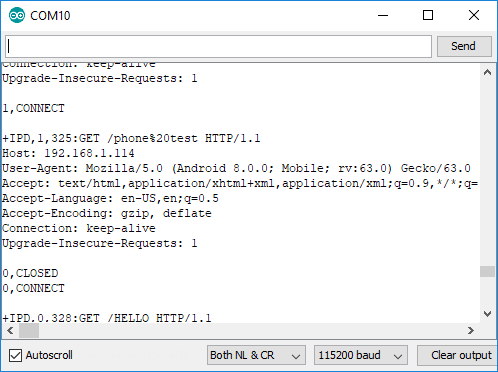
I also tryied to send a message from the phone (Android). In this case, the message was "phone test". The message also got through.
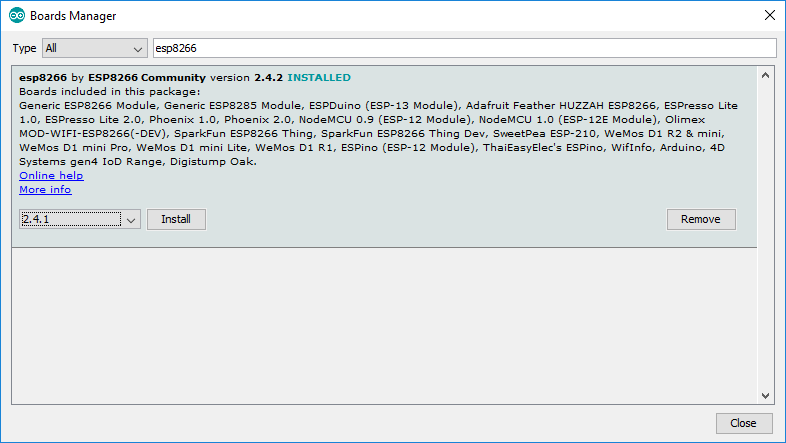
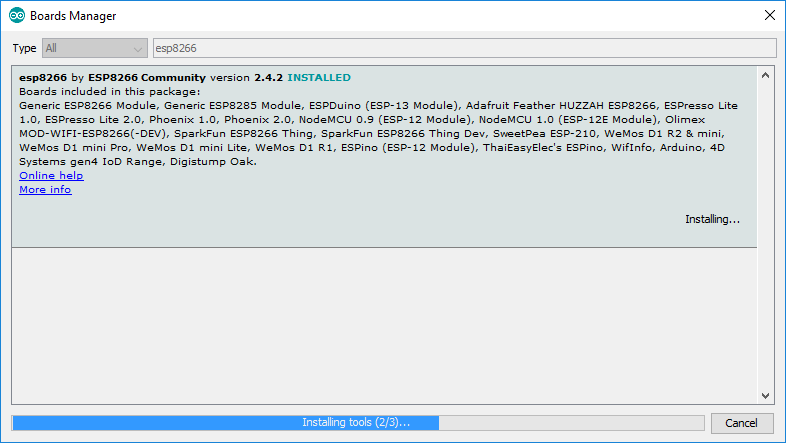
This communication works fine. I read in the datasheet that the ESP8266 itself can be programmed. It has two GPIO pins, so maybe for simpler projects it could be programmed and used independently. In any case, for this project, a serial communication with the WiFi chip is necessary. So we start installing the drivers. The installation is easy, and can be done following this tutorial.
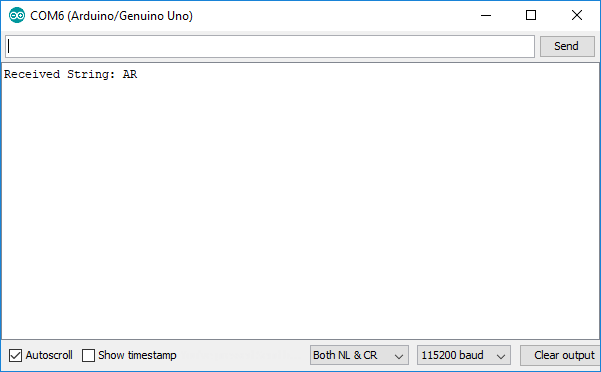
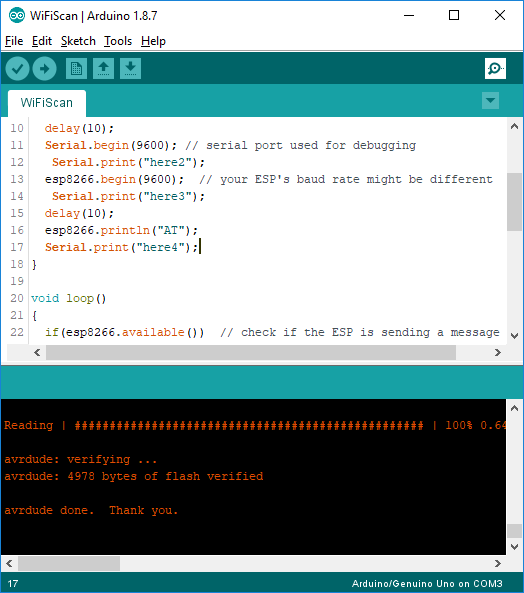
I connected the Serial to the RX and TX, hardware Serial, and FTDI/TTL to the chip. It reply with an error (AR instead of AT). Later I found that the Hardware Serial does not have to be used for debugging and transmission.
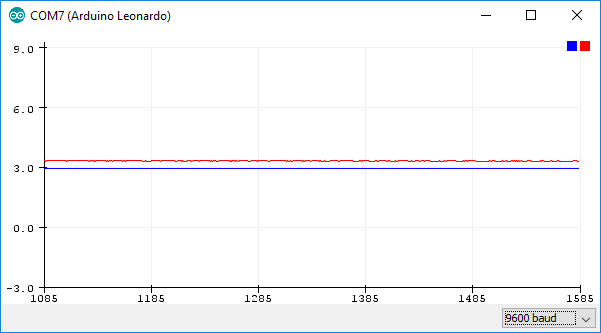
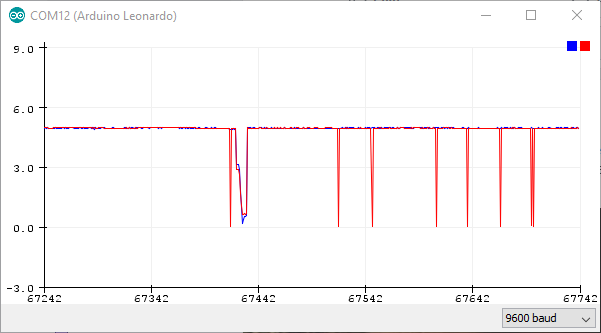
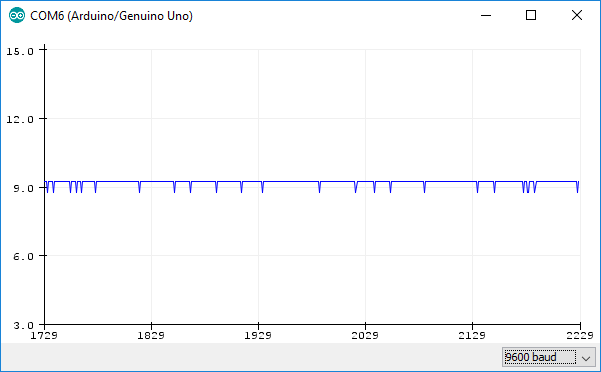
Using the Software Serial capabilities of the chip, I had no answer. It took me some time to find the problem was in the wiring itself. I used an arduino Leonardo connected independently to test the signal. Here we see that there is no change in the 3V area (the signal changes to a logical 0 when preparing transmission.

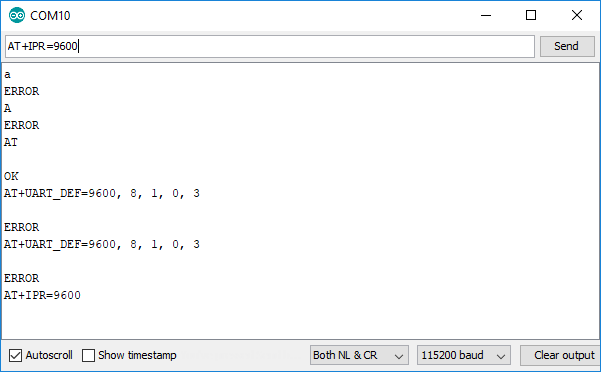
Then, using TTL, I changed the default baud rate from 12500 to 9600. We don't need so much speed for this application, and a slower baud rate helps in the fidelitity of the transmission. The command AT+IPR would do the work.
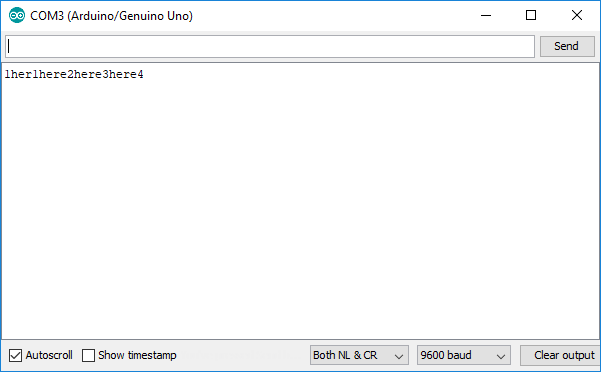
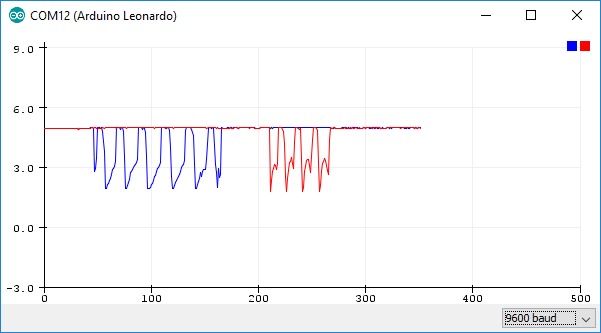
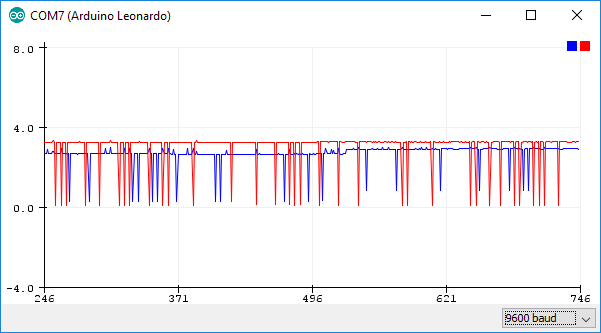
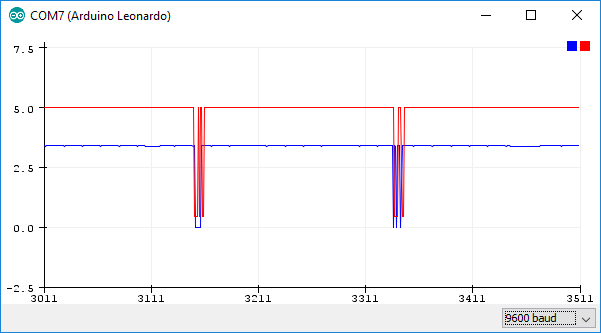
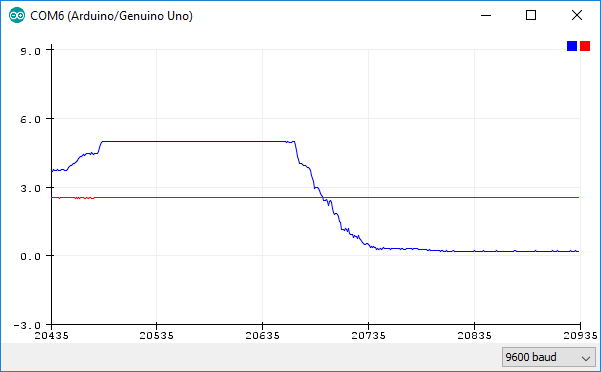
I included some debug messages to see if the transmission was executing. They where printed in the terminal. Exploring the signal in the signal tester, show us that the blue line (TX) was trying to make the connection. So the signal was present, but not receiving an answer (red line, RX). Later I swept the connections, just to be sure, and the patterns of the lines changed color.
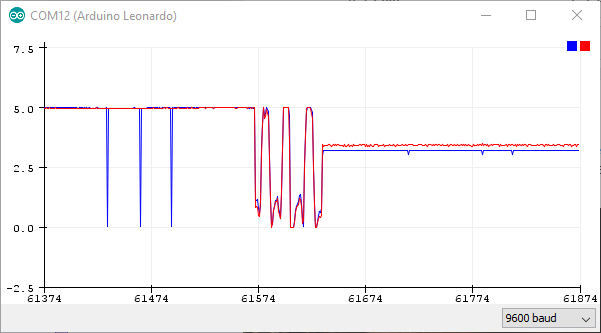
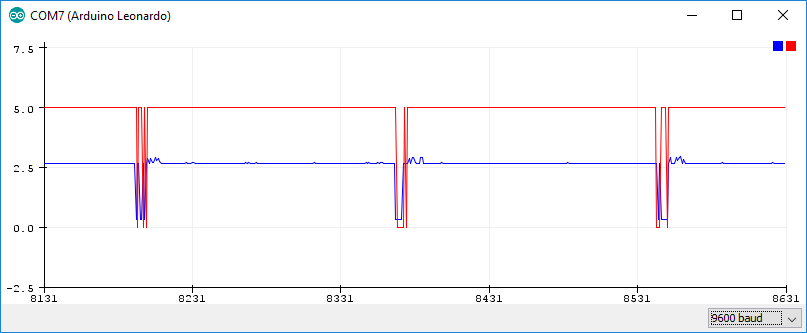
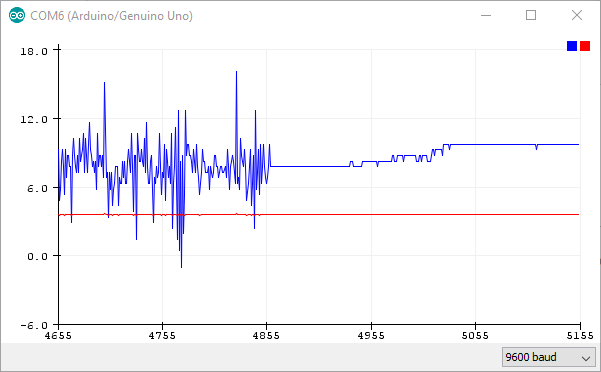
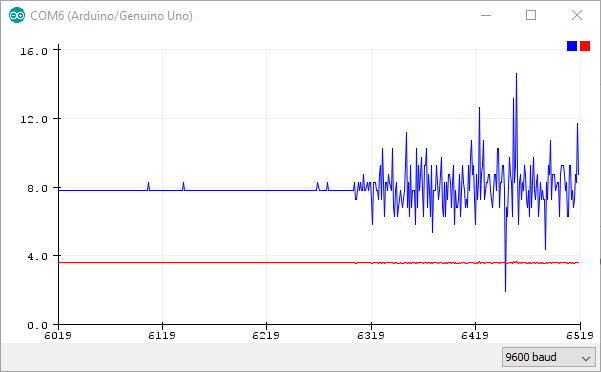
I reduced the sampling and had the communications pattern as before, at 5V. But on the 3.3V side, the signal just was a steady 3.3V (no trying to communicate at all). The pattern at the center is when I disconnected the probes in order to reconnect them on the other side of the level shifter. I tested again at 5V, and the drops to 0V appeared. Definitely, the signal wasn’t going through the shifter. The problem was here, not in the software.
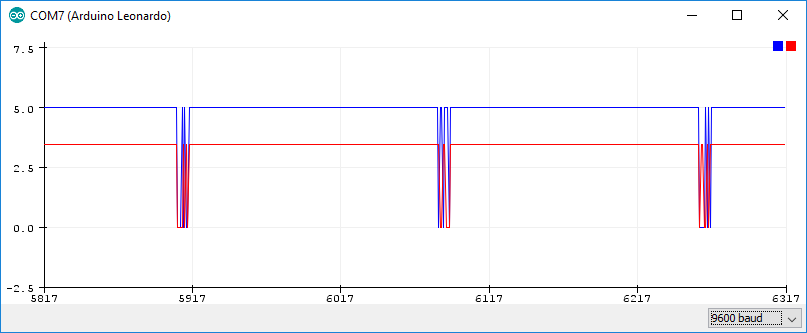
To test this hypothesis I made a voltage divider with a coupe of resistors, and the drop of the voltage was consistent in both sides of the circuit.
Unfortunately, the final voltage was just above 2.5V, too few for a 3.3V signal. In any case, this led me to the device, reread the datasheet, and saw that I was missing a must logical HIGH pin to enable it. The pin was pulled up to 3.3V. Once it was done, the system started to work. The communication was successful, but the message sending was not.
I double-checked the signal, and it was fine. Once I change the ISP network, the message was sent to the web. Finally!
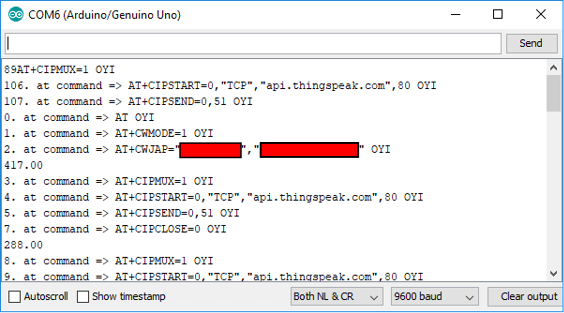
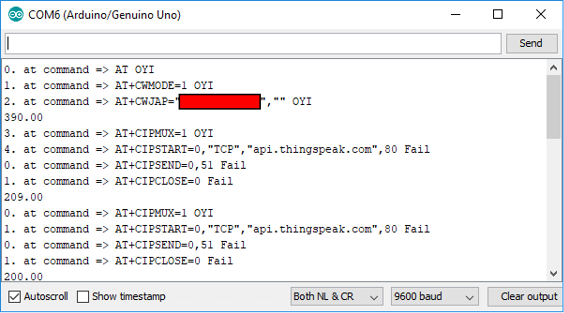
Here is some data collected by Thingspeak. Thingspeak is a plataform where it's possible to upload the data, retrieve it, get it plotted and futher processed using Mathlab. The communication with the server’s database is very straightforward. We just need to send a message with the format: >GET https://api.thingspeak.com/update?api_key=(16 characters from the API channel account)&field1=0.
7VF4UID3BL7DWWDK3 Is an example of the “thing” ID. &filed1 can be set up to 8 fields (example: &field6).
In the code I used, the message was concatenated (added) to a string, using the previous declared variables to fill the particular Thingspeak token and message. This string is fed on sendCommand, that is a user-created function that formats the message to be send, and the time to wait for a response.
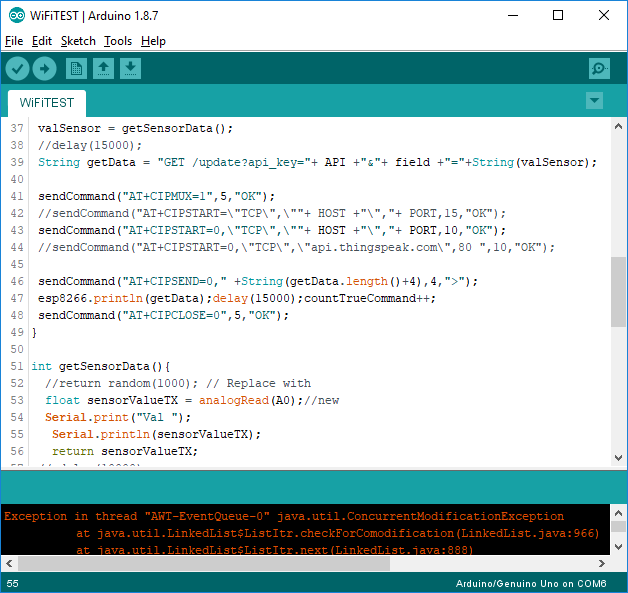
The function ultimately send the messages using the native println(); function.
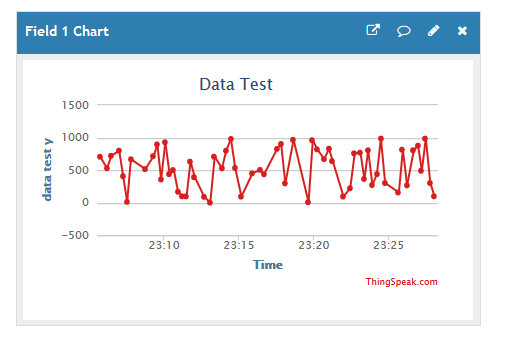
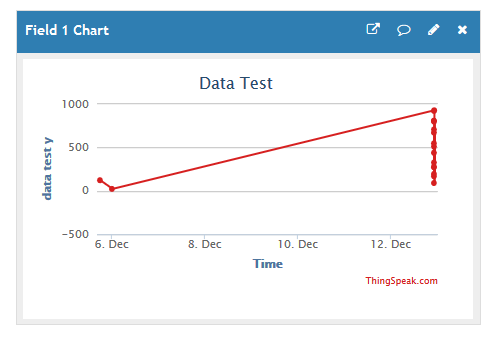
The next graphic is dynamically generated by the Dara Server of Thingspeak. The data is updated in real time, so it is possible to check the data from any Internet connected device. It is possible to hover over the graphic, and see the data in detail.
Microphone input voltage
The microphone construction has an analog and a digital output. The sensitivity is controlled by a potentiometer driven by a screw. A piece of paper with a hollow tubular shape was used to isolate the sound source (earphone output) to the surroundings.
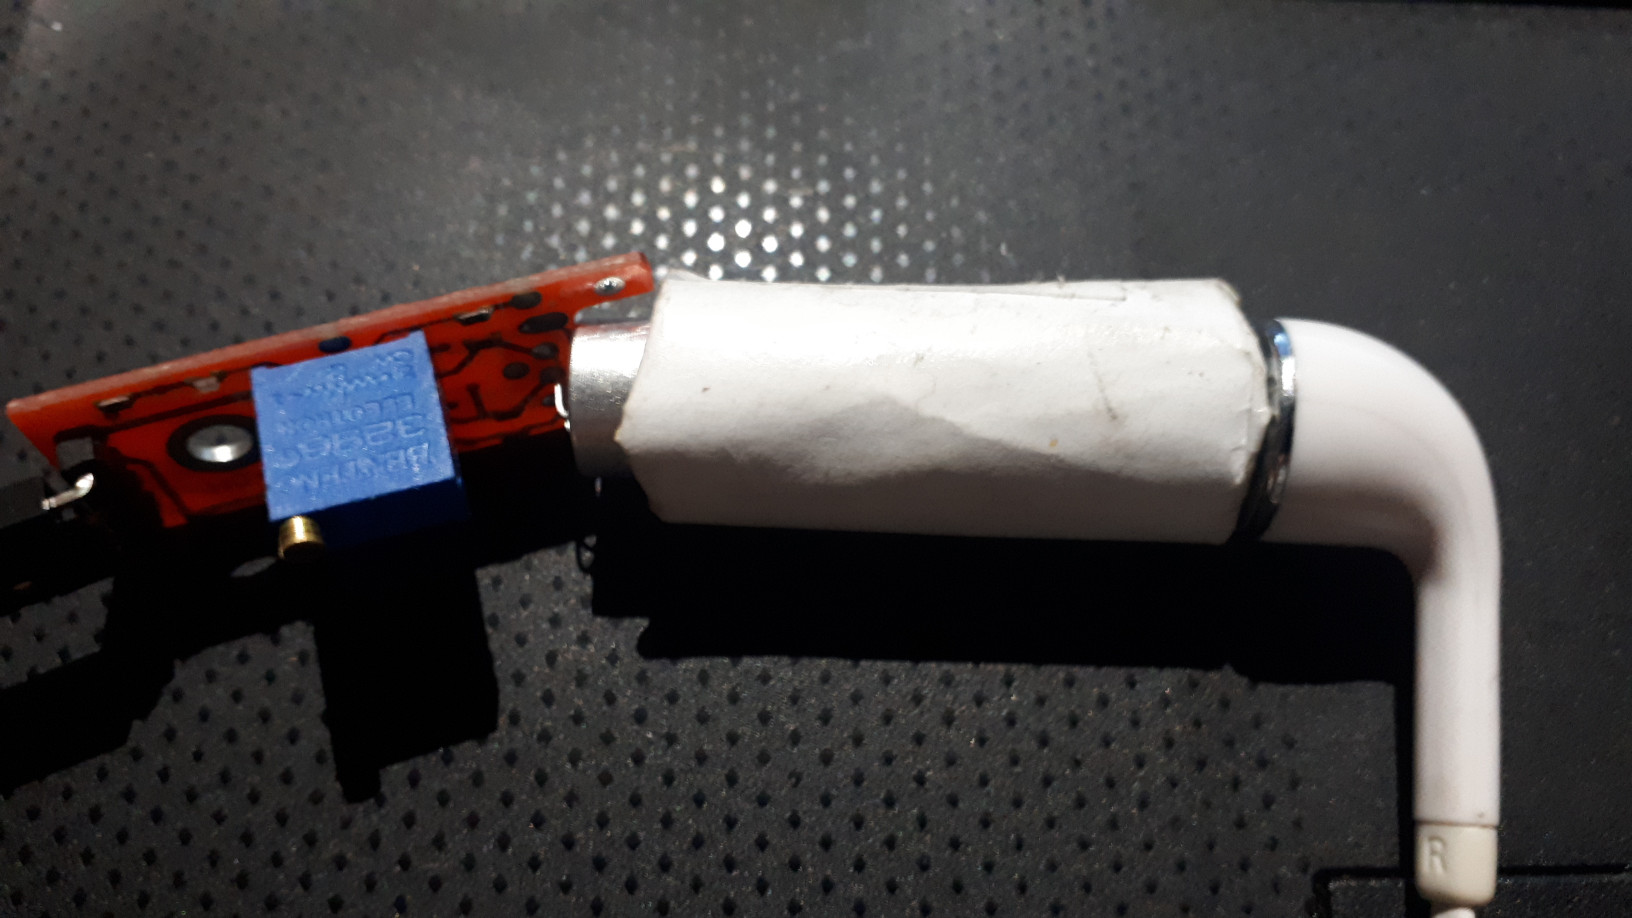
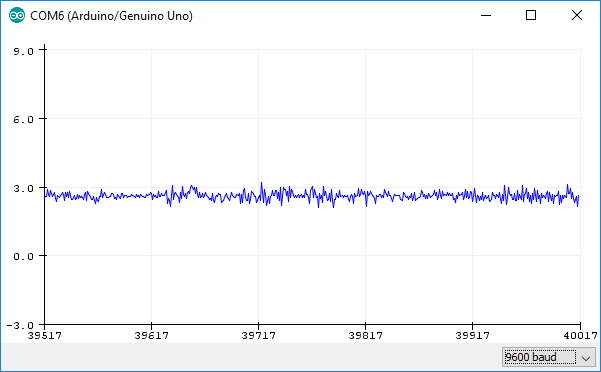
Using the voltage tester, I measured the sound directly. Here we can see it at 0 volume, and a medium volume (form the cellphone scale). Music was played.
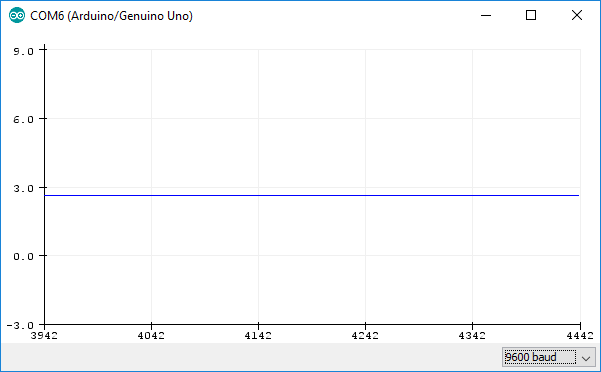
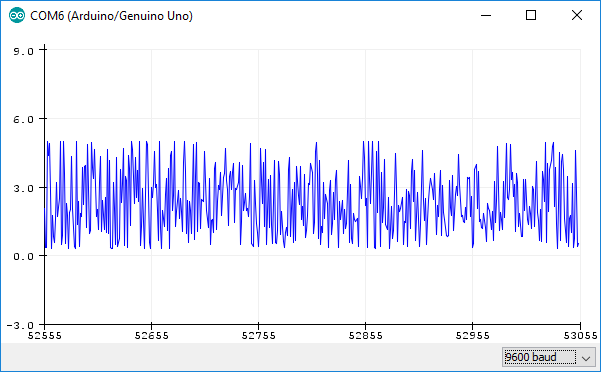
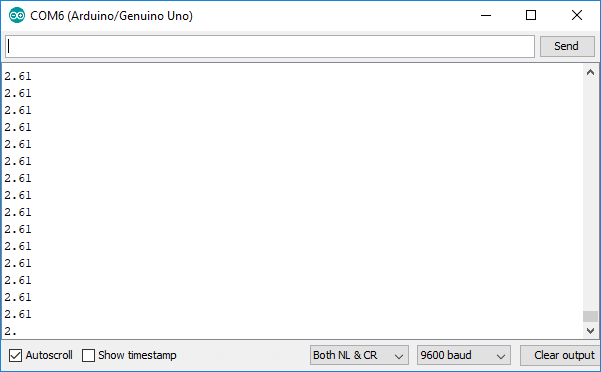
At maximum volume, we have a stronger signal, but noice appears. At maximum volume, we have a stronger signal, but the noice also increases. At silence (almost), we have a constant reading (2.61).
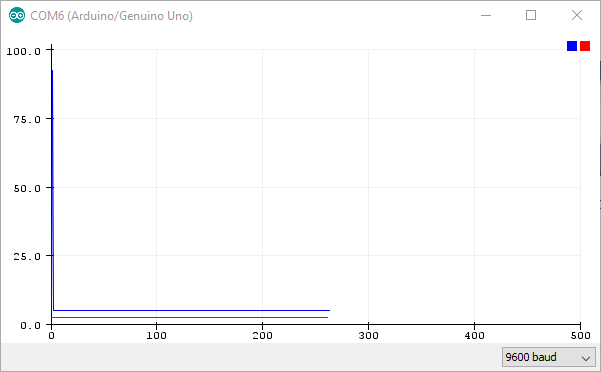
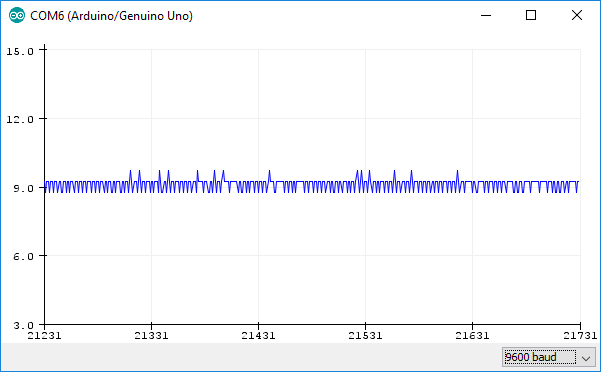
A meassure was taken with the raw signal, voltage signal and a signal processed. First, the volatage is meassured dividing the 0 to 5V scale by 1023, the 10 bit resolution of the anlago to digital converter, and multiply it by 5 (volts). This is done by the line: float voltage = sensorValue * (5.0 / 1023.0);, in the sketch ReadAnalogVoltage.ino. The variable "sensorValue" (0 to 1023, not shown in the graphic), is taken directlly from the pin. The voltage reading is shown in red, and the proceced signal (by the line: float volFilt = (voltage * 100) -350;, shown in blue.
Here we can see some test to see how we can make the signal stronger (by digital filtering).
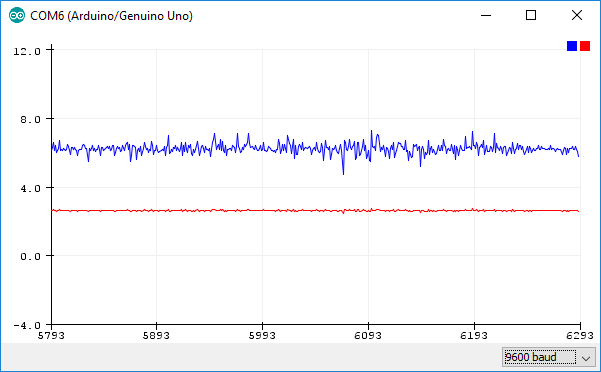
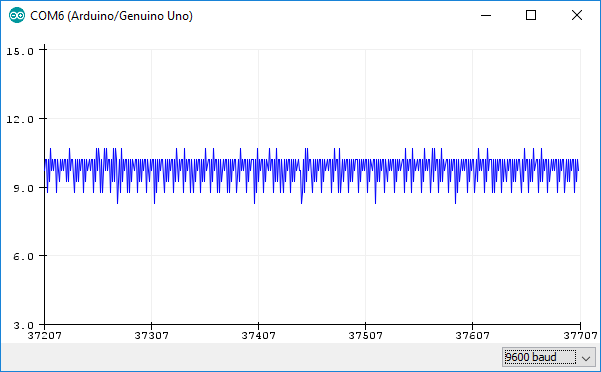
I also used a potenciometer to test the signal. Here we can see the signal in blue (the red line is just constant). In the contigous graphic, we see a test with music and then the microphone disconected.
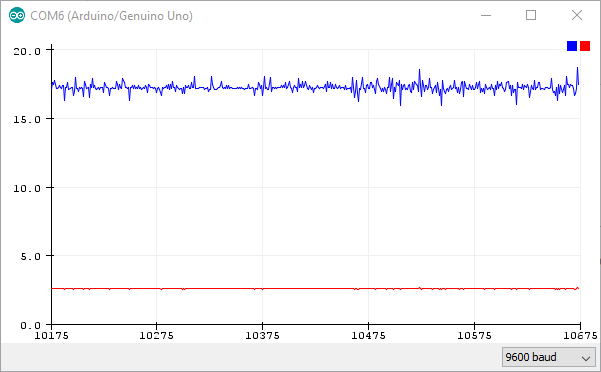
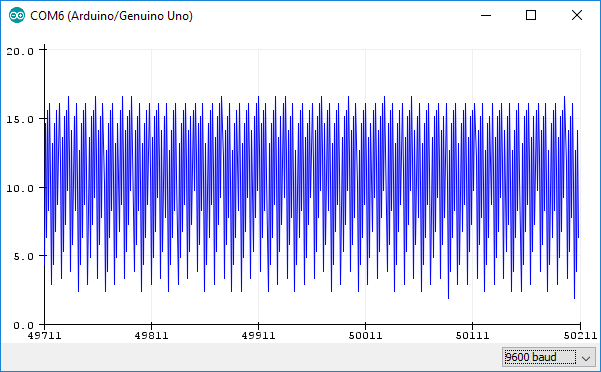
When the microphone is connected, we see the music signal again. Then, I used a sine wave (440Hz, the standard "E" in a musical scale). Here we can see a the signal with a constant frecuency. We are interested in the intensity, so the amplitude will be changed.
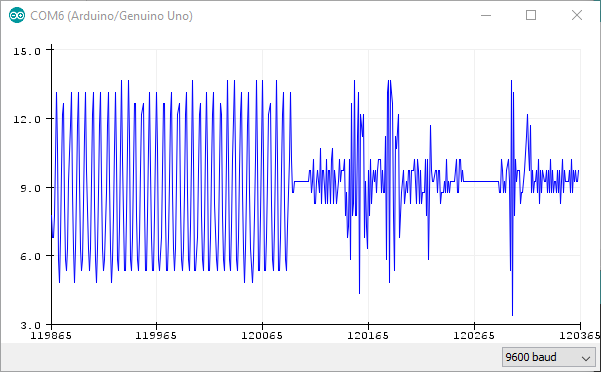
Changing the volume, we can see also a change in the amplitude of the signal. Here we see it at near 0 and medium volume.
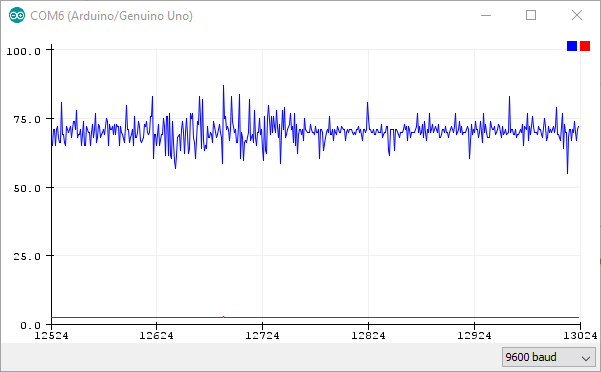
And here at maximum volume. When we change the signal to music again, we see than the amplitude changes accoding to the dymanic of the beat.
Field system design
After testing the device, I decided to make a new version, more "intelligent" or parametric, I should say. I found an useful way, at least for me, to create global variables in solidworks. It was using an external file, and then reference all the parts variables to that file ( *.txt). The method is very straighforward, and it is described in this link.
If you download the CAD files, don't forget to include your text file in the same folder. Changing global variables from this text file is easy. Just open it, and change what is necesassary. The variable for the thikness of the material (for laser cutting), can be altered based on the specific batch width. Kerf compensation can also be applied here.
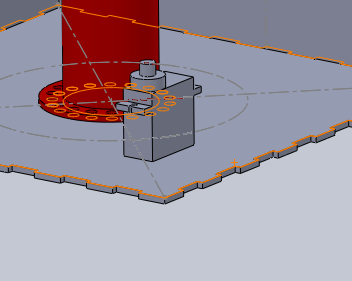
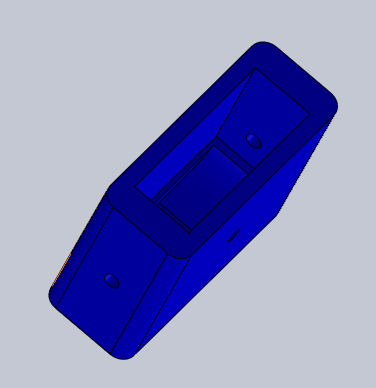
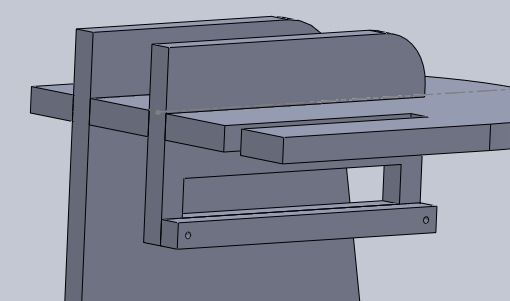
So I reused a model of the bicycle hub, and located the structural planes of the electronics and battery chamber, but this time smaller. The design purpose of the system is to broadcast information about wind speed, and the previous model was aimed to the lab, I though a better fit was possible for the location on the field.
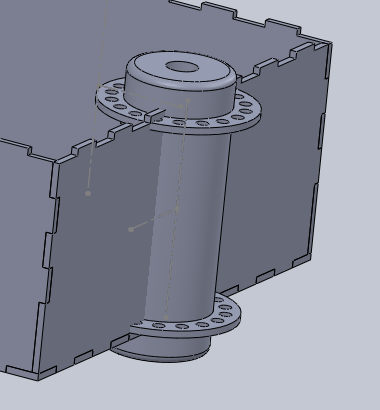
Here we can see a cut view of the structure, with the hub shown in red. It is important to have the height right, because unnecesary stress on the material is possible (or maybe not even fit). Again, change this value on the .txt file with your variables for your particular hub size.
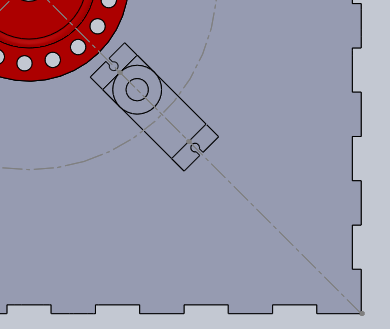
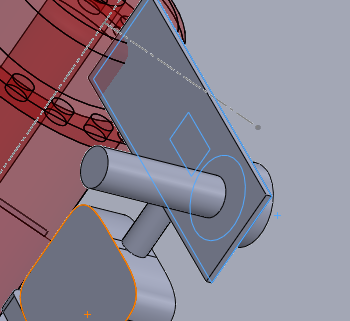
I changed (again) the choice for the actuator to a servo. The previus model used to work at 12V, and was a little big for the task. I was researching, and a 9gr. hobby servo might do the job. The energy needed to drive the tensor is fine at 5V, +- 200mAmps or 1000mW (1 Watt). So, I made a virtual servo (with the surface measurement), and used it as a refference to new parts. In an assembly, I added the part, and made a coincident mate between the bottom face of the servo and the top face of the body's bottom.
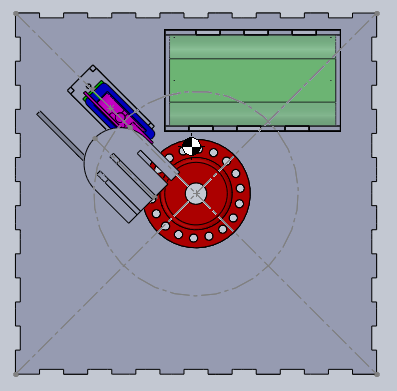
Then I created other mate, this time a colinear, between the diagonal of the squared piece and a center line in the servo. That leave us with just one degree of freedom (along the line). At this point the model ceases to be symetrical. There is a feature to set a center of mass for the model. This could be escential in planes and boats design. Here is not so important, but just to see how it changes it is shown. The ideal goal would be to have it at the lower possible point in Z dimension and as close to the axis as possible for the other two dimensions.
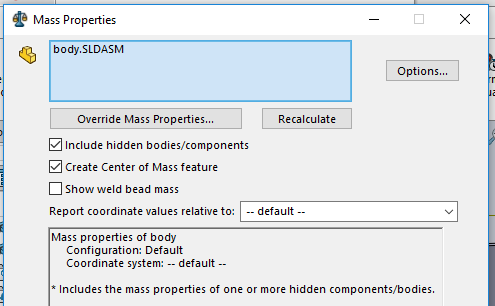
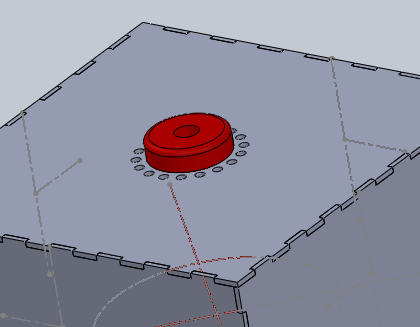
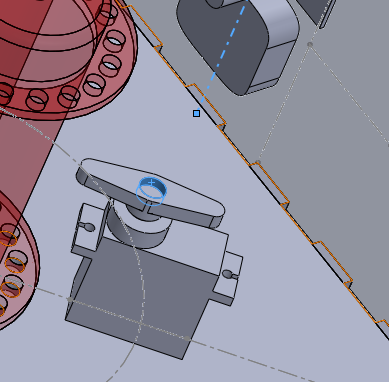
Here we can see the center of mass (the circle with black and white quarters) is just a little biassed due to the added weight of the servo. Back to the servo, we use it to create a new fitting (the standard shape that comes with the servo).
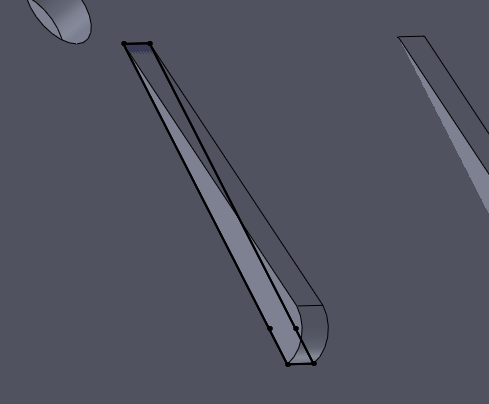
The tunning keys system was also modeled. The function of this system is to control the tension on a string of a guitar. The system consist in a worm drive. This machine uses the friction and the force direction to keep it's position. The axis is locked when in tension, what is good for a guitar string (to mantain the tune). It is also good for this system, because we don't need energy to mantain a position, just to change it. Fortunatelly, the worm drive also provides mechanical advantage to the system, that addded to the gears of the servo is enough to turn the knob. Both servo and knob/worm drive are then mated with a concetric mate, and completelly defined.
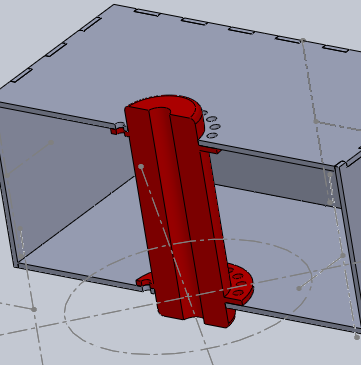
Then, an acrylic case was created to hold the body of the servo in place. Also, for the upper part, a 3D printable joint is shown in blue.
Then, the parts are joined by mates. We can even create a little hole to the axis, because the guitar system is disassemblable (actualy, one screw away). This is good, because we don't want any wather inside the battery/circuitry area.
For the fins, I added a protrussion hook to keep the piece in place. This counteracts the "nose" that is making a lever creating an upward force that could separate the joint. At the base we loose a little friction, but it is worth it in excange of the extra hold of the hook.
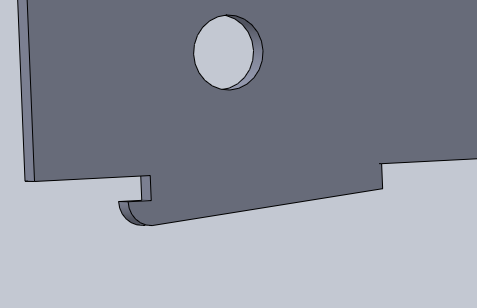
For that reason I had to slightly modify the sloth (a little longer). It is possible to cut a piece to fill this gap, but it is not necessary for this design.
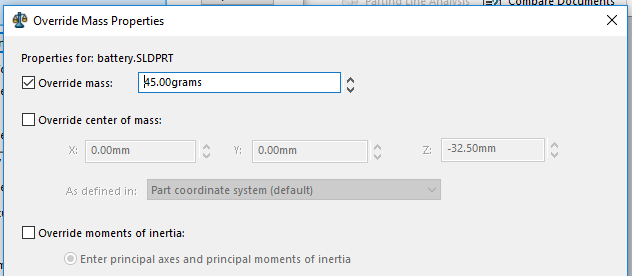
The top is made of a few planes and cavities. At this point, I am going to create a battery.
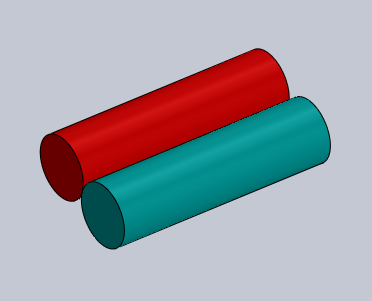
I weighted one of the units of the battery, and assigned to the part in the mass properties. This is done just for demonstration purpuses. For more accurancy (airplane design, by instance) this is very useful. However, in this case it is not critical. We can see the driffting of the center of mass, though.
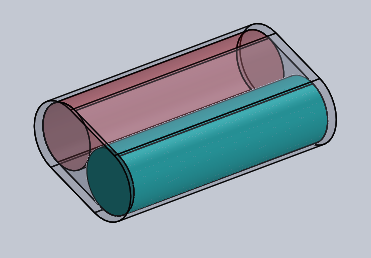
A holder was designed and located. Here the center of mass has moved to the weight added.
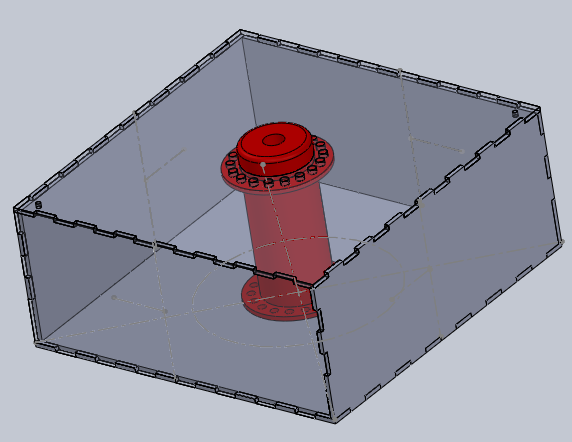
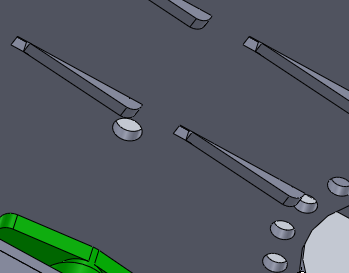
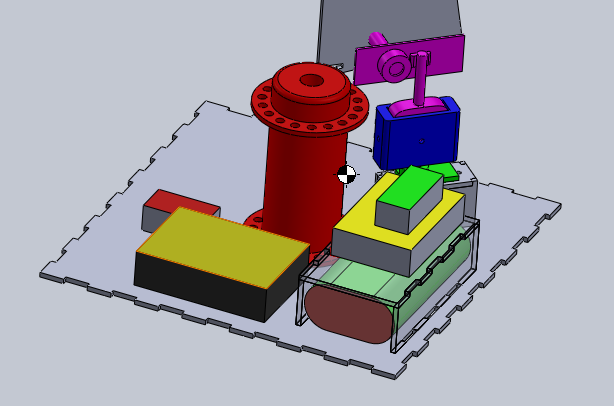
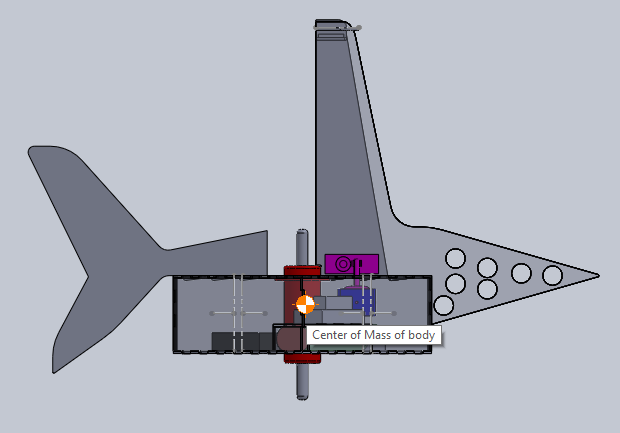
Here we can see the assembly with the spaces for the electonics accounted. After adding the other pieces (fins), the center of mass was back near the center. The holes, needed for aerodynamical reasons, also help in the stabilization.
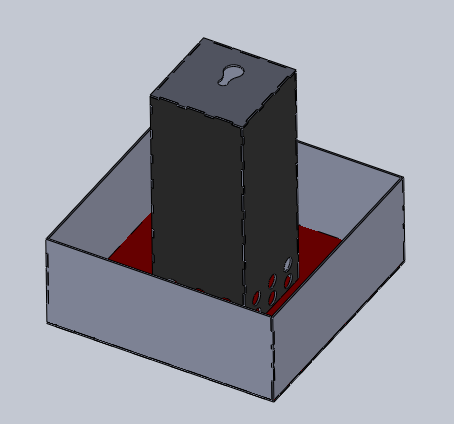
Finally, I created a holder. This time, I made it more robust, for beeing outside on the field. Here is a similar system from the lab version. The idea here is to fill the bottom of the container with cement, so it will provide a low center of mass base. The holes on the upper part are for let the cement cross, and provide a strong junction when cured. Once stable, we just have to attach the upper part.
Here is a short video with an overview of the system.
Input, output and control
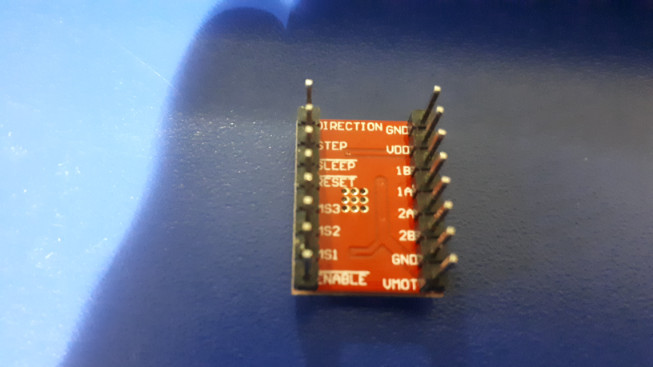
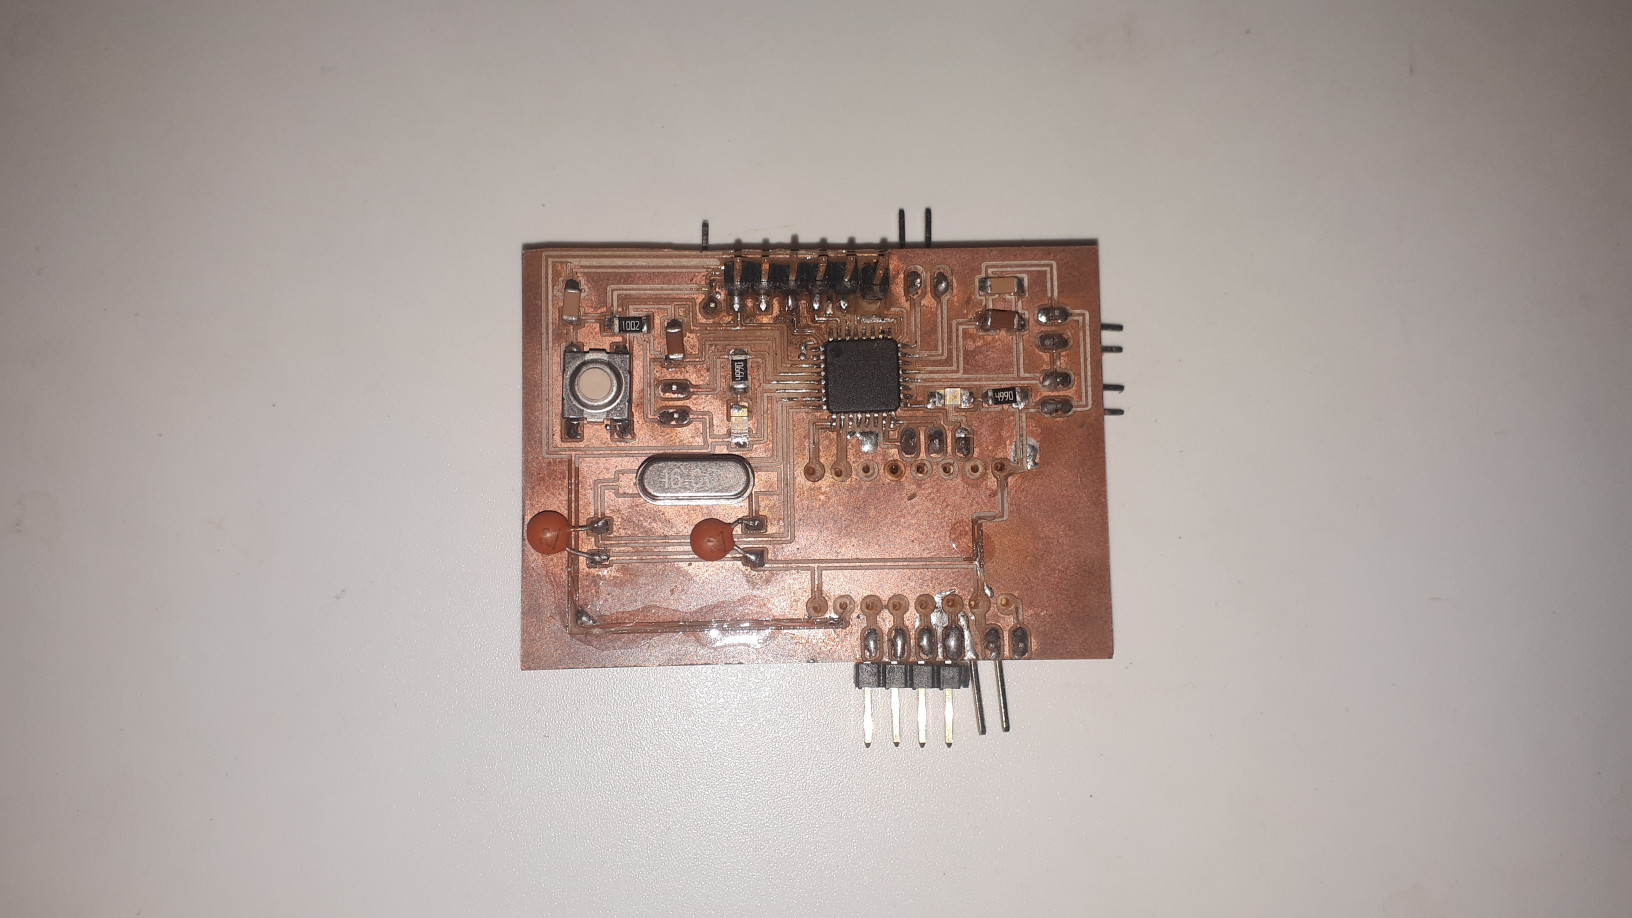
The board we are going to use is from the class Outputs, in this link. It is use it without the stepper motor controller because in this case we are going to use a servo motor. I changed the motor again. The stepper was too big and strong (and also energy hungry). After some research, I found there was not a really advantage to use the stepper (at 12V, with the need of a device to rise the voltage). Also, the use of a continuous servo helped in the range of turns to be made. That's why the stepper motor is missing. I am going to use the pins instead.
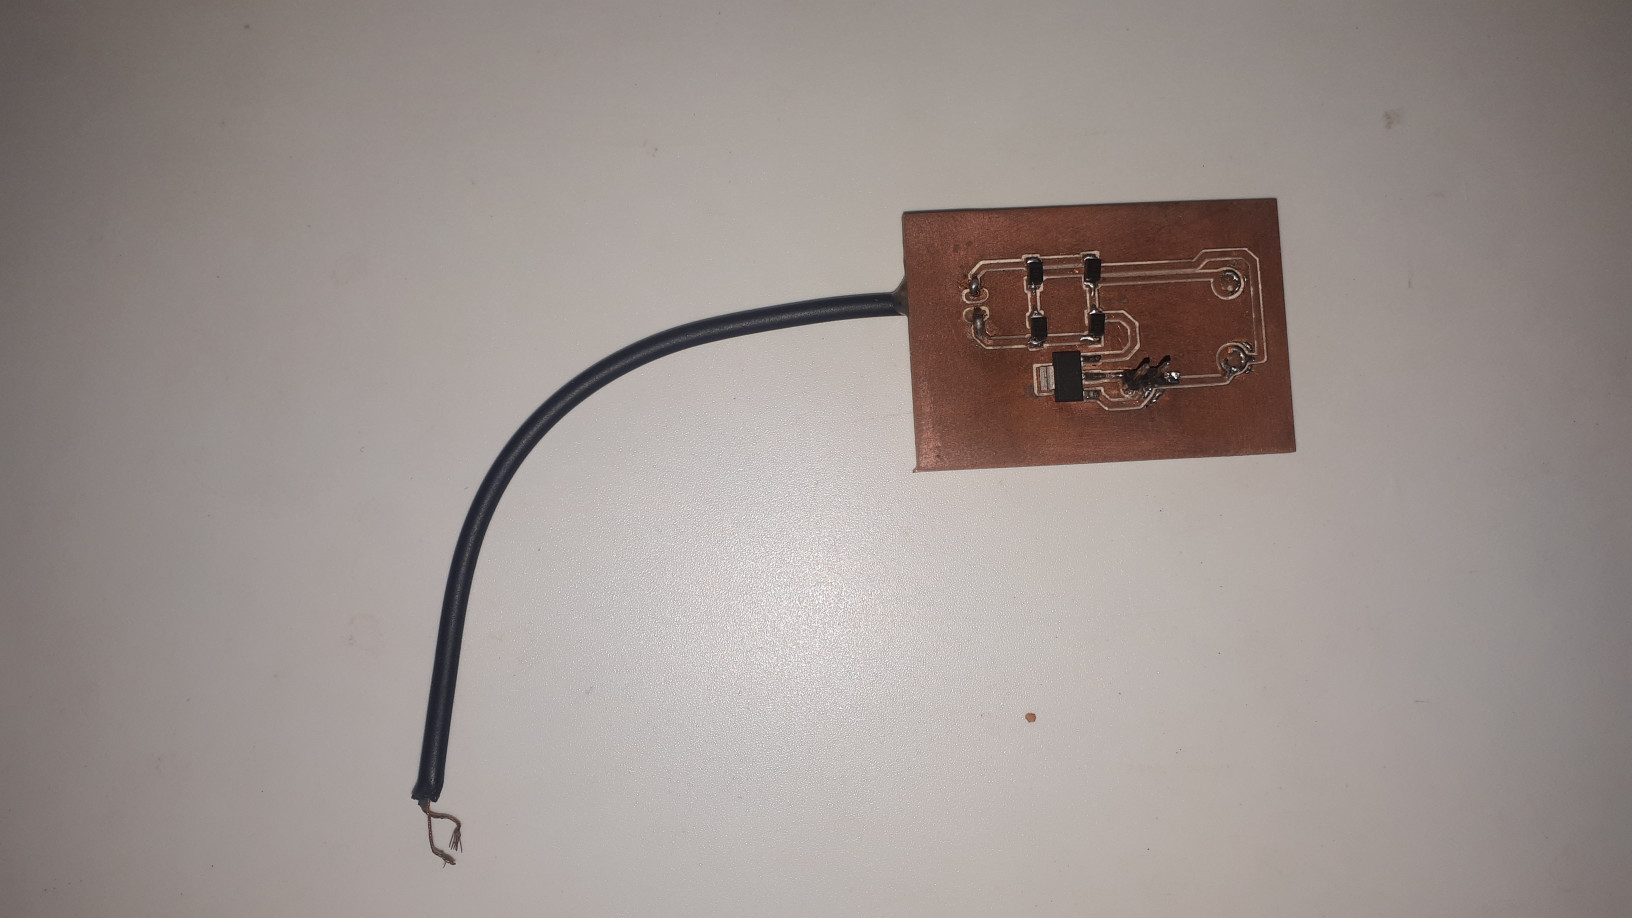
This board converts AC to DC current. The electric generation is going to be produced by vibration (alternating), and we need DC to be able to store or use the electricity. We do it with a diode bridge, that we can see here. There is also a voltage regulator, that keep the voltage at 5V. This is important. Too much voltage could damage the batteries or even worse, cause a leak or an explosion. The leads are connected to the battery manager controller that comes with the battery pack (recycled). This allows the LIthium Ion batteries to manage the energy to avoid over-charging, or over-discharging. An over-discharge could damage the battery, an over-charge could make it explode. Again, never operate Lithium batteries with proper charge management. A probe also goes here, measuring current in one lead, and voltage in both.
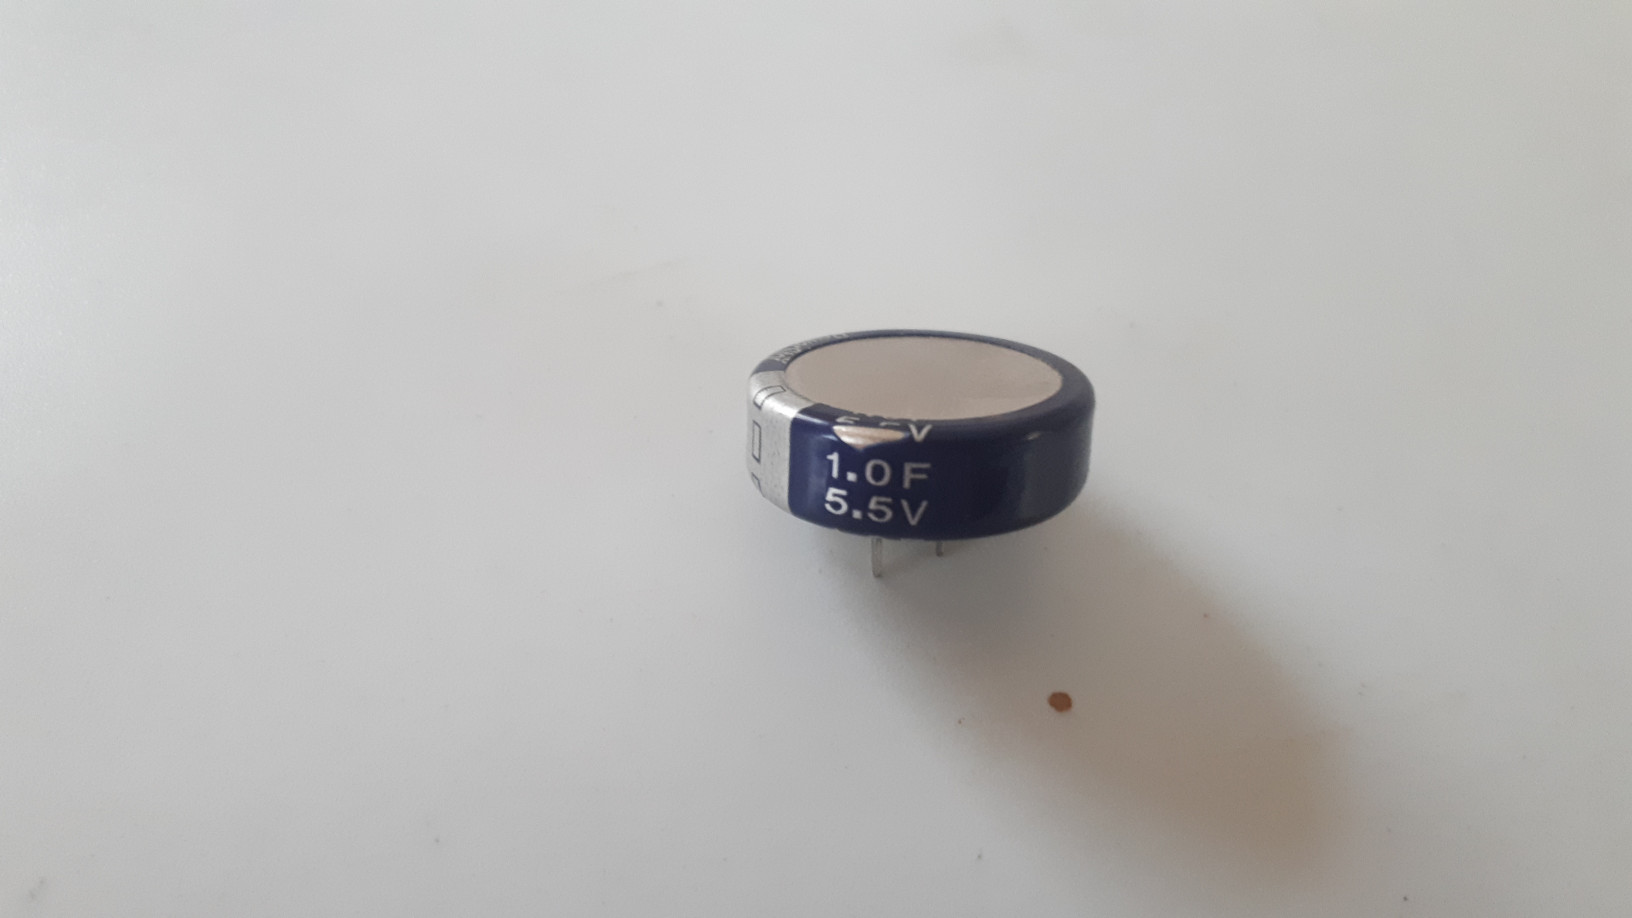
After the energy is here, a capacitor is connected to the battery charger (energy manager), and to the previous device (check the polarity). In this case, a 5.5V - 1F. Was used due to safety and for preventings spikes. This is an electrolytic capacitor (and with a relative large capacitance, 1F), so be careful it might explode if connected in a wrong polarity.
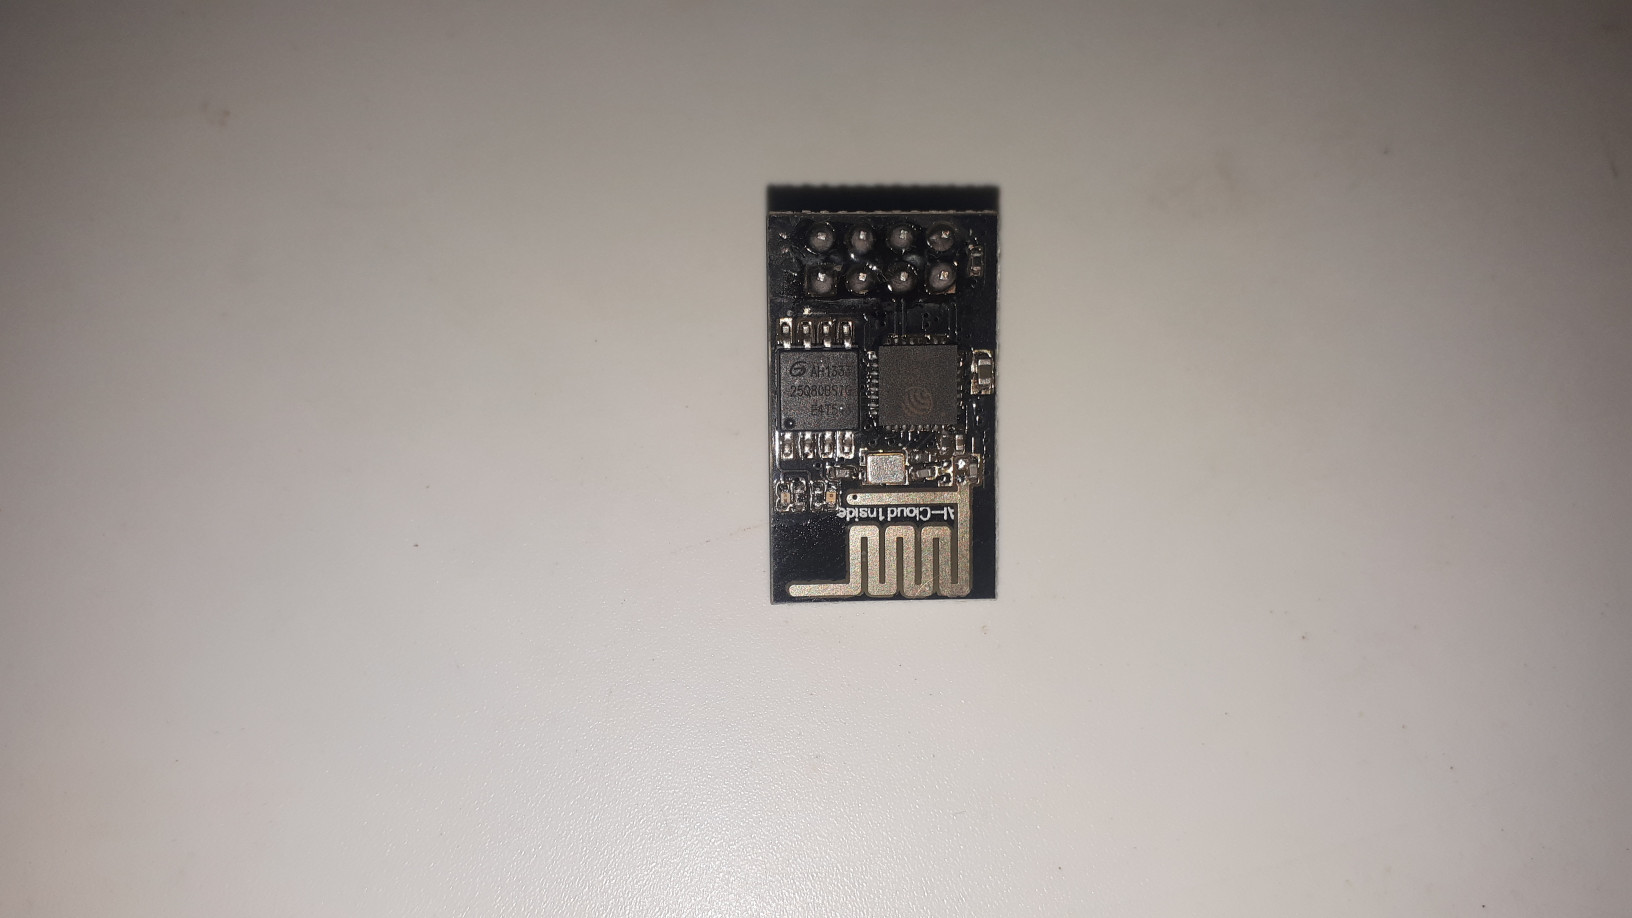
The communications are going to be managed by the WiFi chip ESP8266, version 01. Here is the datasheet. I found this device very powerful. It is programmable, what makes it very useful in simpler projects (even has General Input Output Pins GPIOs). Something to check in the next iteration and future designs. In this case, I used the pins Ground to common ground, VCC to 3.3V (put down by a voltage divider form the 5V battery) to power the chip, pins TX and RX to serial communication to the board, pin Enable (CHPD) to enable the board. No reset or GPIO pins connected (floating). An important thing to notice: The worm-like copper design on the board is the antenna. Just be careful for other electronics interferences.
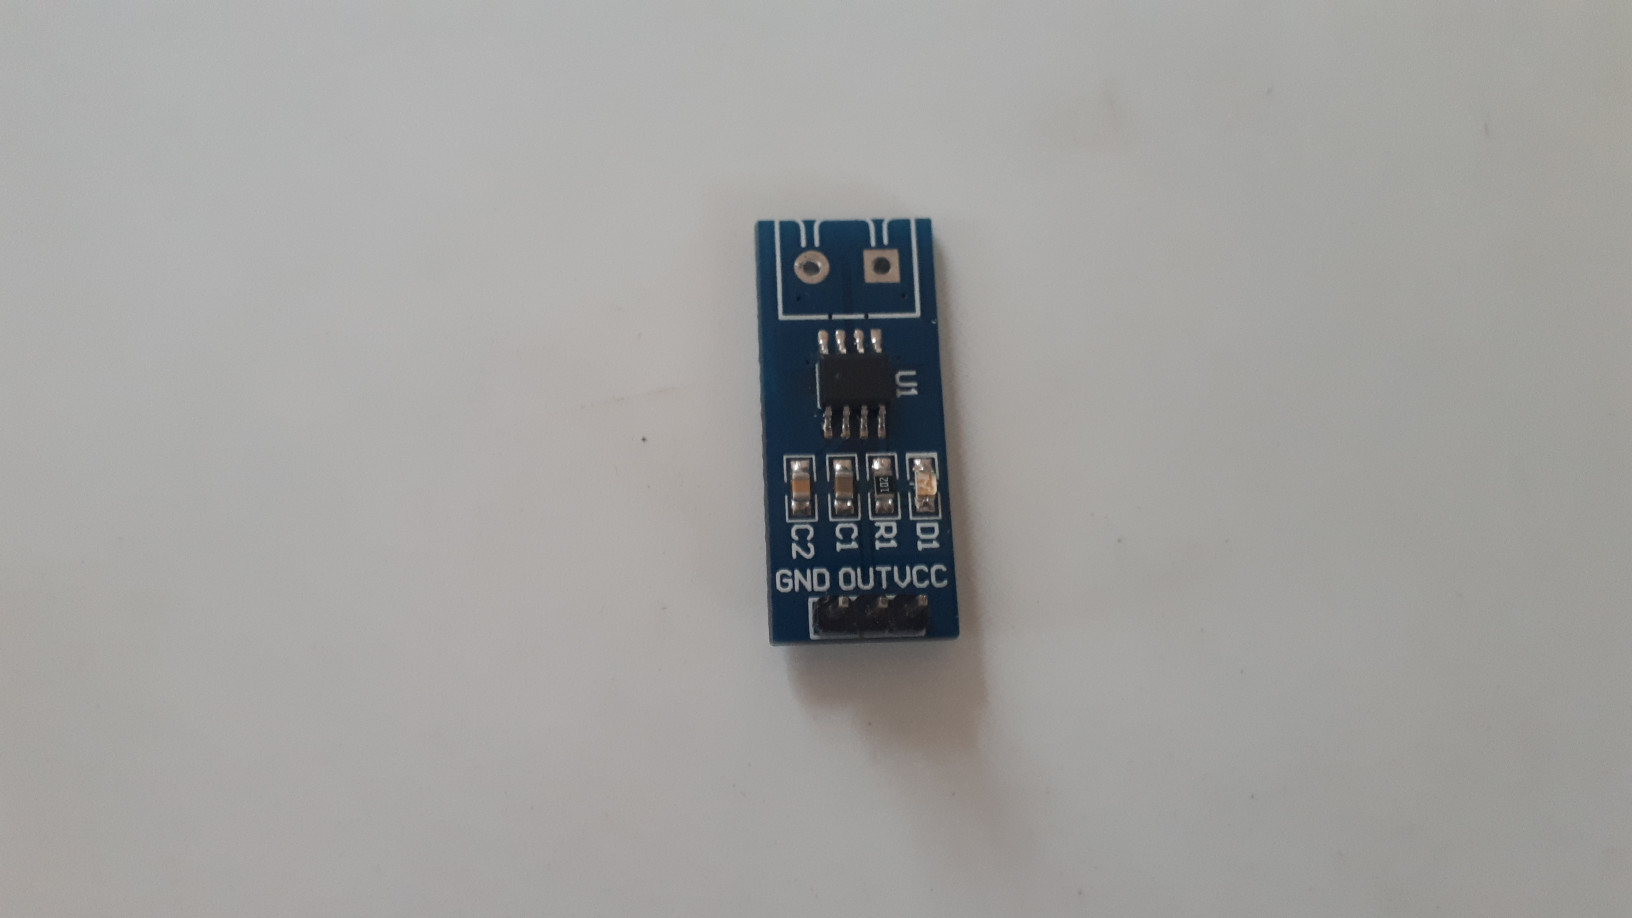
For current measurement, a Hall sensor was used. We also made a Hall device in class Inputs, but for this measure I will use a distance-calibrated sensor. The wiring is simple. The circular and the squared holes are connected in series with the positive lead of the point we want to measure (not part of the circuit), but change the magnetic field around the wire, generated proportionally to the current passing through it. The Hall sensor can register this change in the magnetic field, and output a voltage that can be measured by an analog to digital converter (our MCU analogRead). The magnetic field have a polarity, so if the wires are connected in one way, the reading will be positive, and the other way, negative (same value). This will not damage the device, the number must fit our calculations and code. The solutions or use hardware (swap the connection), or software (change the sing of the number in the code).
In the bottom side, we just feed the chip with 5V (VCC), Ground (common), and get the signal from OUT (1 to 5 Volts, or 0 to 1023 after analogRead).
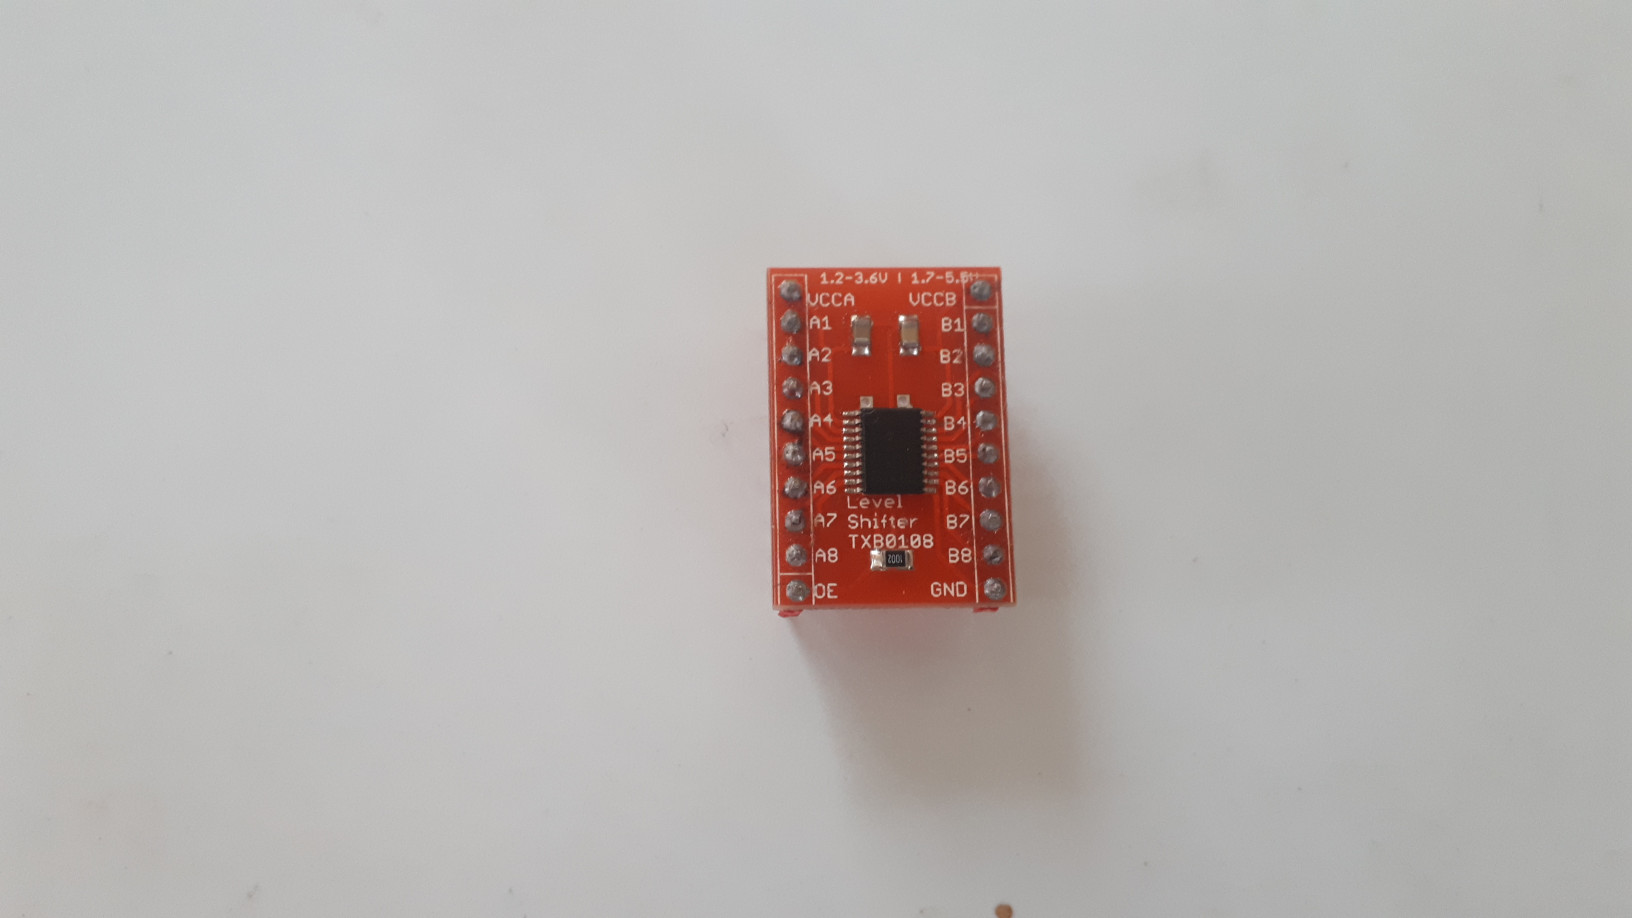
It is important to note that the ESP8266 operates at 3.3 volts, for feeding and for logic signals. This device that I had around made the conversion. The connections are simple: 3.3 Volts in the lower voltage reference pin (VCCA), 5 Volts in the upper voltage reference pin (VCCB), a common Ground, OE pulled High (to activate the chip), and use the correspondent pins and side to the incoming and outgoing signals. TX form the ESP8266 to the pin A1 (3,3 Volts side) and B1 pin (5 Volts side) to the MCU RX pin. Likewise, RX from the ESP8266 goes to pin A2 and B2 goes to the TX point of the MCU.
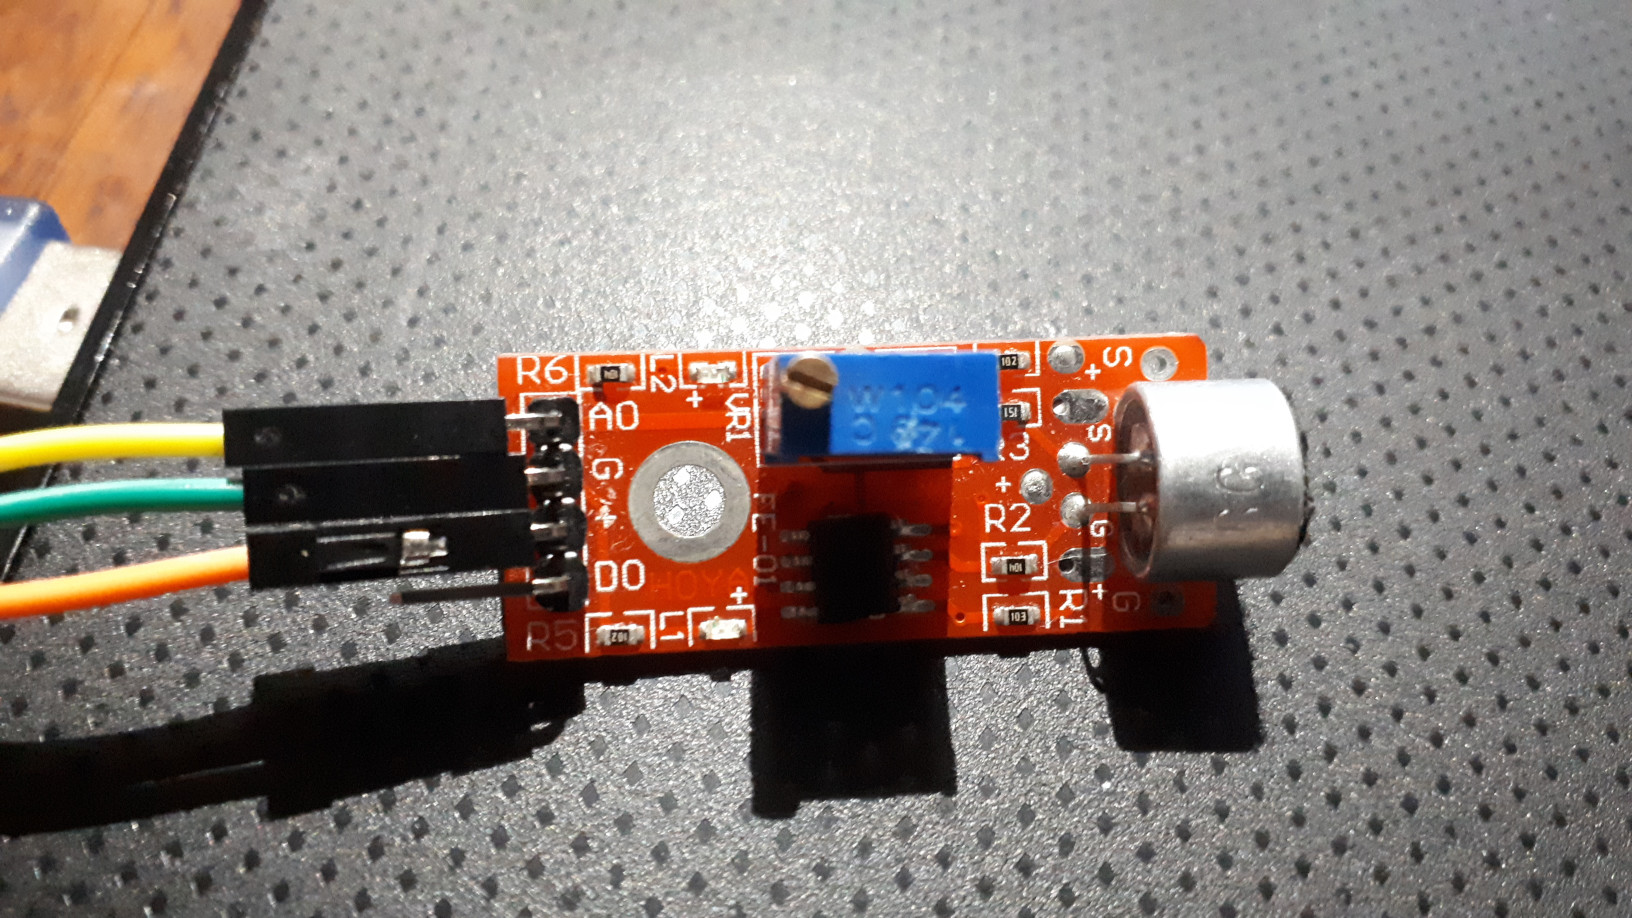
I was testing some signal amplifiers and none worked the way I wanted. I had to use a test mic-amplifier that I had around. This worked just fine. The wiring: 5V-VCC, Ground (common), and analog and digital signals to the MCU. The digital signal will be used to wake-up the MCU from deep sleep, and the analog signal to take measurements. The potentiometer (blue box with a screw), is used for calibration. Y made a test, using the arduino Plotter (serial), and the onboard led to trigger a digital 0-1 (LOW, HIGH) signal when a threshold is reached.
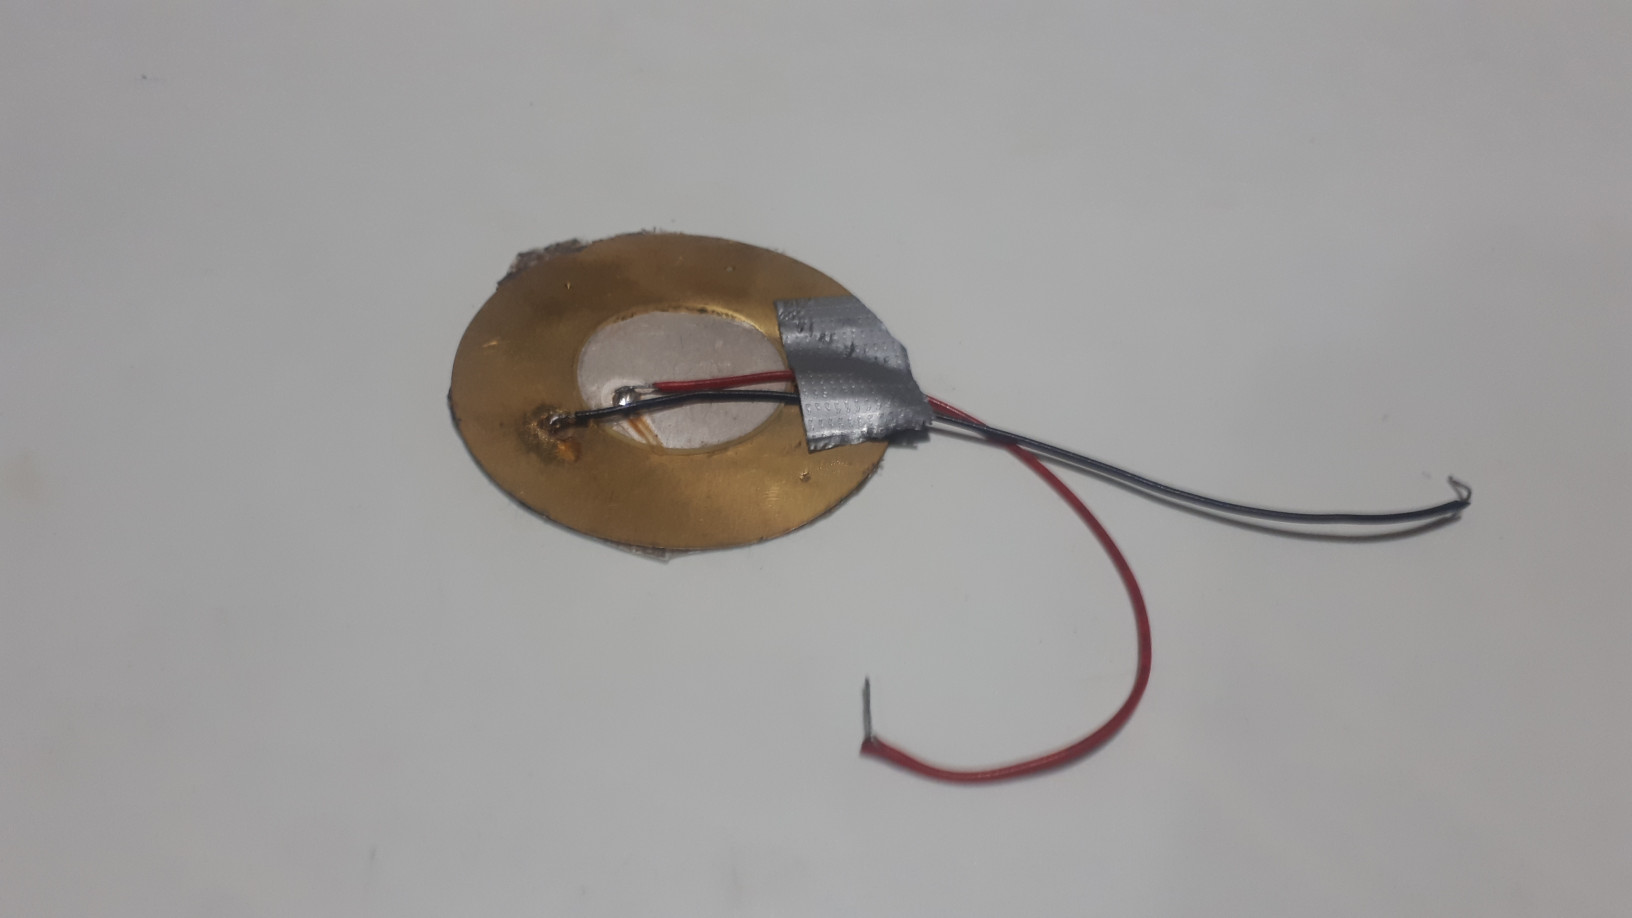
And here is the piezo. The current wasn’t big at the test, but maybe setting more in series could help in the current generation. The leads are connected directly to the bridge/regulator board. The polarity is irrelevant.
Software
After the wiring, we go for the programming. A deep-sleep routine (to save energy) will run at the MCU. An event (digital HIGH), will trigger the signal that will wake up our system, and make it work on the measurement and transmission of the data we want (mainly, energy and wind speed). The board draws 4.5 milliamps at silence, and 5.8 milliamps at sensing. Not much, but good, because it has to be on all the time, sensing the change in wind speed.
The threshold for the digital pin was used using a quiet room and a low level sound as references. A Serial monitor- Serial Plotter can also be used to set a threshold. On the sketch, first we import the sleep library (no need to import it to the IDE iif already have avr libraries installed), and a led variable to testing. Here we use an interrupt to wake up the chip and run a blink subroutine.
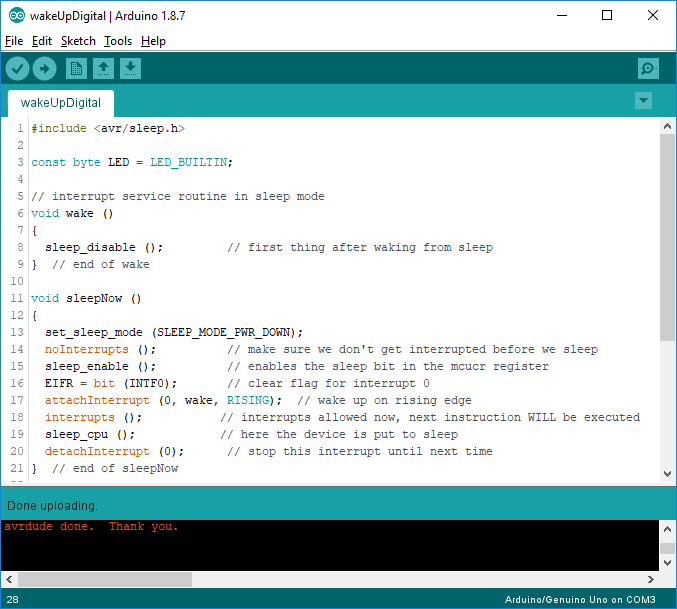
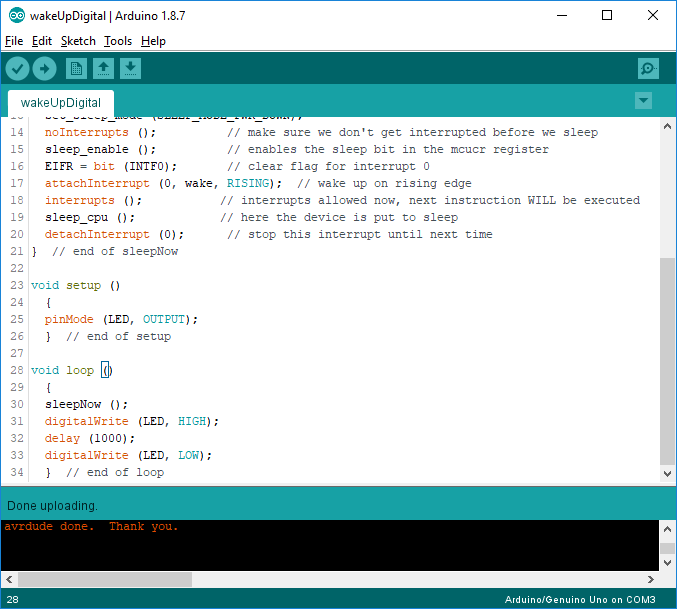
This is an interesting way to leave a "normal" loop sketch wolking only when awake, avoiding the restrictions of an interrupt-based routine. We can see at the end, at the setup() and loop() function that the subroutine sleepNow is invocated at the beggining (actually the setup and loop functions are red first). When invocated, the other functions take care of the sleep period (no wind).
Then, in the loop funcition we include the sending data routine, as shown in the WindVoices script.
Once the communications part was working, the gathering of input and the orders to actuators was just a matter of matching pins and software development.
Summary
Objectives
The objectives for this project was to develop a device that could provide IoT communications in isolated areas, and be fueled by electricity generated in situ. In the process of developing the project, I found that the system for energy harvesting was not powerful enough, so this objective couldn’t be met (at least for now). Still, the device’s battery and sleep system could allow the system to work for a long time, broadcasting the wind speed, measured by the microphone, the voltage (charge) of the battery, and the net energy inferred by the real time measurement of voltage and amperage.
Achievements
At the end, the machine was able to wake up from sleep with a wind speed threshold trigger, take the measurents, broadcast them to the internet, and go back to sleep mode. This information will be useful to define the potential energy that could be harvested and the changes to be made in future designs, changing the variables of surface of the tape, elasticity (material used), and software adjustment of the tension. Professional programs offer the chance to simulate flow patterns and forces. This could be useful, as a wind tunnel. Unfortunately, we didn’t have this resources, so I had to improvise and use intuition in the design. Nevertheless, the aerodynamics worked for the hardware. The communications part was a challenge, but finally worked with the regulations in voltage. Still, this project could be rearranged once the changes are made and the physical information gathered is processed (after a few months/one year of getting the info together).
Changes
After the first design I choose to redesign the model. The second version used a servo motor instead of a stepper motor, and was designed with a smaller space for the actuators, battery and electronics. With less size, comes less resistance (drag), and less material used. The parametric model helps in the redesign, and future designs with other functions.
What I have learned
Beside the knowledge about electronics and signals, I learned to plan the design in an spiral way. Even when the idea is defined, in the middle of the design process new problems and challenges appear, and sometimes you have to be creative, or change the overall perspective. In any case, the parametric design and the advantage of having previous electronics design allow us to rapid prototyping and testing.
The documents from this page can be found here:
Motor-tensor interfase, Shaft part.
Wind voices, first design.
Cut, cut board
Traces board, board traces.
Board, board
Wind Voices Body and base, New desing, parts and assembly.
Software, Software used in this page.