Week 14: Visualization
Light Sensor Line Graph in Processing
Files
Processing Code
Processing
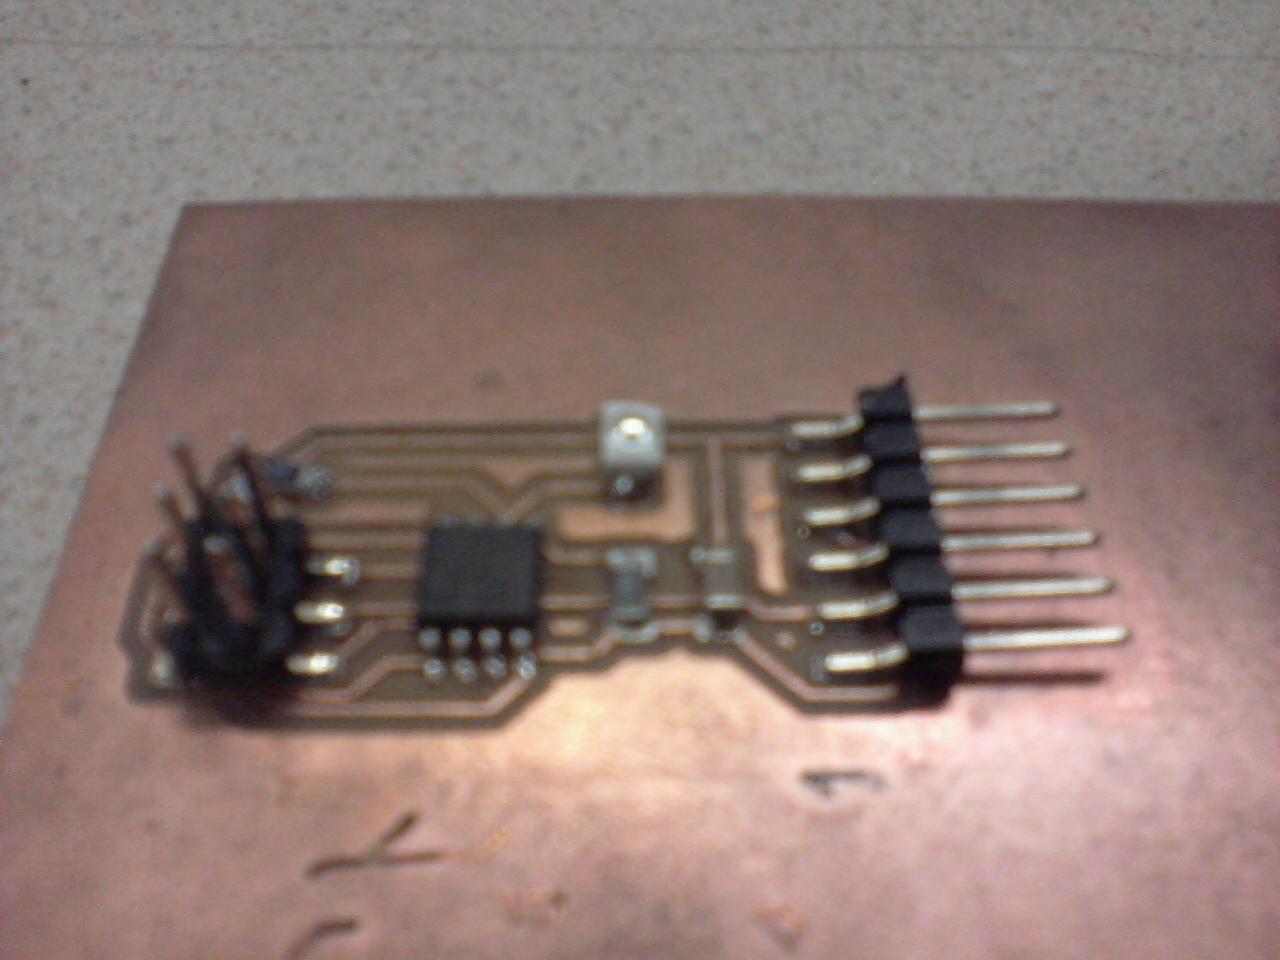
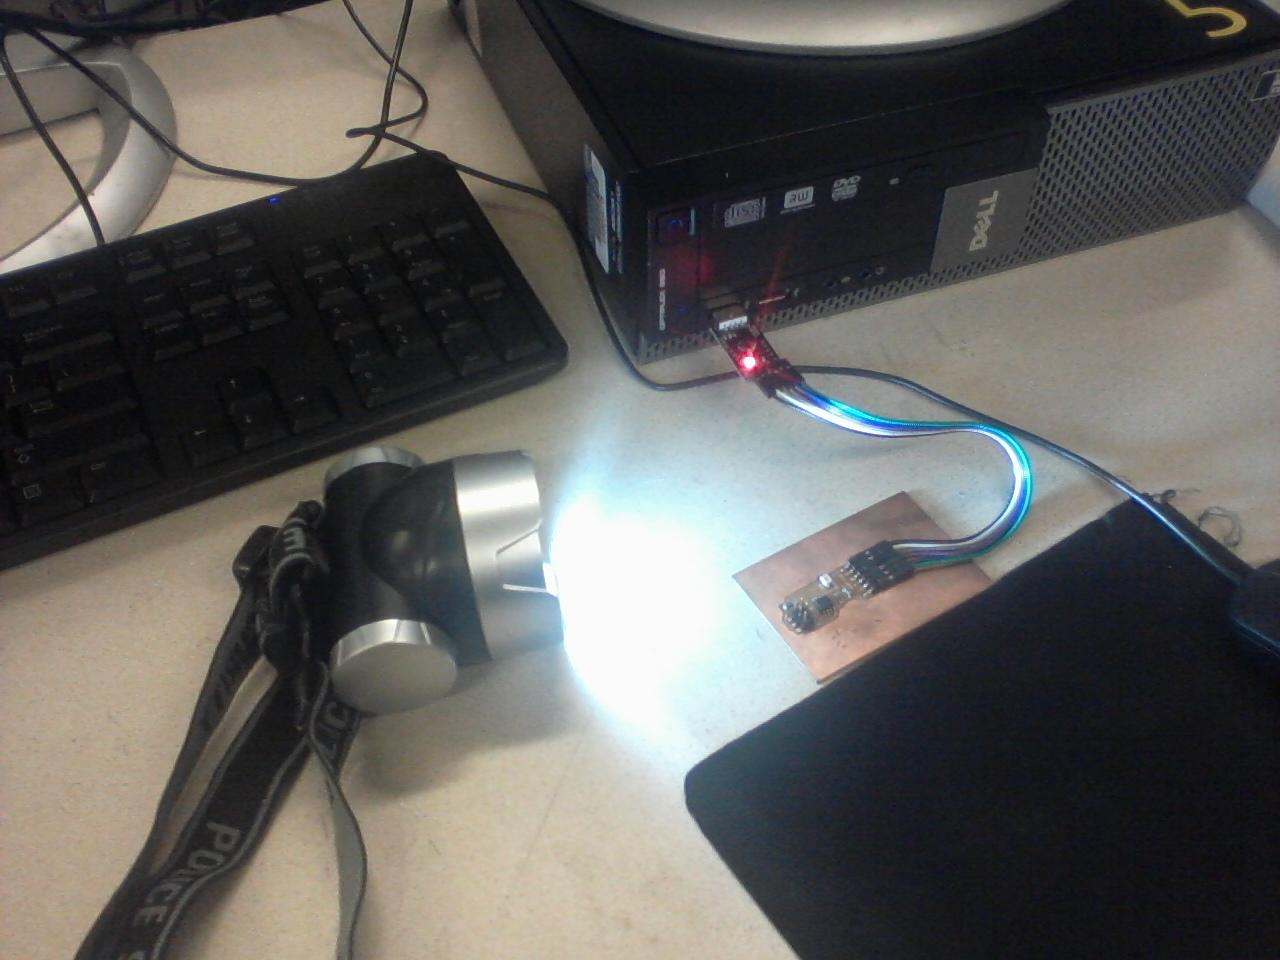
Processing is a sister program to Arduino that I used to make a line graph. I learned using processing to make line graphs is a poor choice. Processing is good for manually making lines and circles and shapes and such. Manually making graphs using lines and hashes and markers and such is a coding task I want no part of. I used my old light sensor board design, but I had to make a new board because my old one was damaged, and I used a different phototransistor as we had run out of the old ones. My code read in the data on the serial port and graphed the data so it appears to be meaningful.
Processing Code
The notable problem I had to troubleshoot was trimming and parsing the data that was coming in off the serial port in the loop. The data comes in from the board as a string, and I need to trim it to get it down to just numbers, and then parse it from a string into an integer. After that, the code prints the value to the screen and rewdraws the graph with the new value.
Code Below:
import processing.serial.*;
ArrayList dataPoints = new ArrayList();
Serial myPort; // Create object from Serial class
String val; // Data received from the serial port
String val2;
int val3=0;
int val4=0;
//PFont f;
void setup()
{
size(600, 240);
String portName = Serial.list()[2];
myPort = new Serial(this, portName, 4800);
}
void draw()
{
background(-1);
noFill();
stroke(0);
beginShape();
for (int i=0;i Points P = (Points)dataPoints.get(i);
vertex(P.x, P.y);
if (P.x<0)dataPoints.remove(i);
P.x--;
}
endShape();
if ( myPort.available() > 0) // If data is available,
{
val = myPort.readStringUntil('\n'); // read it and store it in val
if (val !=null)
{
val2= trim(val);
val3= parseInt(val2);
val4= val3-800;
Points P = new Points(width, val4 );
dataPoints.add(P);
println(val4);
}
}
}
class Points {
float x, y;
Points(float x, float y) {
this.x = x;
this.y = y;
}
}
Home
Projects